

Key Points
RNR hyperactivation disrupts dNTP homeostasis, promoting myeloid differentiation in AML.
dNTP pool imbalance induces excessive ERK activation, contributing to leukemia cell differentiation/viability inhibition outcome.

Abstract
Differentiation blockade is a hallmark of acute myeloid leukemia (AML). A strategy to overcome such a blockade is a promising approach against the disease. The lack of understanding of the underlying mechanisms hampers development of such strategies. Dysregulated ribonucleotide reductase (RNR) is considered a druggable target in proliferative cancers susceptible to deoxynucleoside triphosphate (dNTP) depletion. Herein, we report an unanticipated discovery that hyperactivating RNR enables differentiation and decreases leukemia cell growth. We integrate pharmacogenomics and metabolomics analyses to identify that pharmacologically (eg, nelarabine) or genetically upregulating RNR subunit M2 (RRM2) creates a dNTP pool imbalance and overcomes differentiation arrest. Moreover, R-loop–mediated DNA replication stress signaling is responsible for RRM2 activation by nelarabine treatment. Further aggravating dNTP imbalance by depleting the dNTP hydrolase SAM domain and HD domain-containing protein 1 (SAMHD1) enhances ablation of leukemia stem cells by RRM2 hyperactivation. Mechanistically, excessive activation of extracellular signal-regulated kinase (ERK) signaling downstream of the imbalance contributes to cellular outcomes of RNR hyperactivation. A CRISPR screen identifies a synthetic lethal interaction between loss of DUSP6, an ERK-negative regulator, and nelarabine treatment. These data demonstrate that dNTP homeostasis governs leukemia maintenance, and a combination of DUSP inhibition and nelarabine represents a therapeutic strategy.
Introduction
Acute myeloid leukemia (AML) is characterized by differentiation arrest within bone marrow (BM).1,2 Successful use of all-trans retinoic acid (ATRA) or inhibitors of mutant isocitrate dehydrogenase (IDH) highlights the achievement of differentiation therapy.3-5 Other differentiating compounds whose effects are not limited to any specific leukemia subtype are those intervening nucleotide metabolism, including nucleoside analogs (eg, Ara-C)6 or inhibitors of dihydroorotate dehydrogenase.7 There is an unmet need to understand mechanisms underlying activity of those agents.
Proliferative cancer cells hijack de novo deoxynucleoside triphosphate (dNTP) biosynthesis to meet DNA replication demands.8 A key player in dNTP biosynthesis is ribonucleotide reductase (RNR).9 The functional RNR catalytic unit is a cytosolic heterotetramer consisting of 2 large subunits (RRM1) and 2 small subunits (RRM2 and RRM2B).9 RRM2 levels vary throughout the cell cycle; its transcription is minimal in G0/G1 and maximal in S phase, determining RNR activity.10-12 RRM2 levels are tightly regulated by the DNA damage-induced ataxia telangiectasia and Rad3-related (ATR) pathway,13,14 which is downstream of augmented R-loops, the triple-stranded DNA:RNA hybrids.15,16 Moreover, high dNTP levels are reportedly mutagenic via perturbing DNA replication and impairing mitochondrial function.17 The dNTP hydrolase SAM domain and HD domain-containing protein 1 (SAMHD1), which degrades dNTP and functionally antagonizes RNR,17-19 reportedly promotes resistance to nucleoside-based chemotherapies by hydrolyzing active triphosphate metabolites like Ara-CTP.20,21 Last, RNR activation may have opposing effects on tumorigenesis,22 prompting us to explore the role of RNR hyperactivation in AML.
Herein, we identify nelarabine (NEL) from our differentiation compound screen. Its effects stem from R-loop–mediated replication stress and RNR hyperactivation-induced dNTP imbalance. We further characterize extracellular signal-regulated kinase (ERK) hyperactivation as downstream of the imbalance.
Methods
Patient samples
Peripheral blood or BM specimens were obtained from patients with AML at City of Hope (COH) Comprehensive Cancer Center. Patient characteristics are summarized in supplemental Table 4 available at the Blood Web site. Risk groups are based on World Health Organization classification. All subjects signed informed consent forms. Sample acquisition was approved by COH Institutional Review Board in accordance with the Declaration of Helsinki.
Mice
Immunodeficient NOD-scid IL2Rgnull-3/GM/SF (NSGS) mice used for human-in-mouse xenograft models were obtained from the Jackson Laboratory (stock no. 013062). Mll-AF9/Samhd1−/− mice were generated by crossing Samhd1−/− mouse23 with Mll-AF9 (MA9) knock-in mouse (Jackson Laboratory, stock no. 009079). CD45.1+ congenic mice were from the National Cancer Institute (strain no. 01B96). Mouse care and experimental procedures complied with established institutional guidance and approved protocols from the Institutional Animal Care and Use Committee at COH.
Metabolomic analysis
Metabolites were extracted with methanol and subjected to targeted metabolomic profiling on the UltiMate 3000 UPLC chromatography system coupled with Q-Exactive orbitrap mass spectrometer. Targeted metabolites were quantified by area under the curve (AUC). Other details are provided in supplemental Materials.
Mass cytometry
Primary cells were treated as indicated and processed according to the Fluidigm protocol. Other analysis procedures are provided in supplemental Methods.
RNA-Seq analysis
Total RNA was isolated from cells treated as indicated. RNA sequencing libraries preparation procedures are provided in supplemental Methods. Sequencing run was performed in the single read mode using Illumina HiSeq 2500.
Statistics
Data obtained from multiple experiments were reported as mean ± standard error of the mean (SEM). Unpaired, 2-sided Student t test was used to compare means between 2 groups. One-way analysis of variance with multiple comparisons was used to compare means among 3 or more groups.
Results
Functional screen reveals a differentiation-induction activity of NEL
To define potential differentiation indicators for virtual screen, analysis of GSE125112 revealed 35 genes commonly upregulated by ATRA24 (fold-change ≥ 1.5; P < .01; Figure 1A; supplemental Table 1). In parallel, analysis of gene expression profiles of differentiation-inducing agents from NCI-60,25 including ATRA, zalcitabine,26 and sodium butyrate,27 revealed 55 commonly upregulated genes (r > 0.3, P < .01; Figure 1A; supplemental Table 2). There was an overlap of only 1 gene, CD38, whose high expression is seen at later stages of hematopoietic differentiation.28 Interestingly, transcriptome analysis of the lineage−Sca+cKit+ (LSK) subset sorted from conditional Idh2R140Q;Flt3ITD knock-in mice revealed that Cd38 was upregulated by in vivo administration of AG-221, a potent IDH2 inhibitor29 (supplemental Figure 1A). We confirmed CD38 induction in U937, KG1A, and NB4 after ATRA, zalcitabine, or sodium butyrate treatment (supplemental Figure 1B) and IDH2R140Q-expressing TF-1 after AG-221 treatment as reported28 (supplemental Figure 1C).
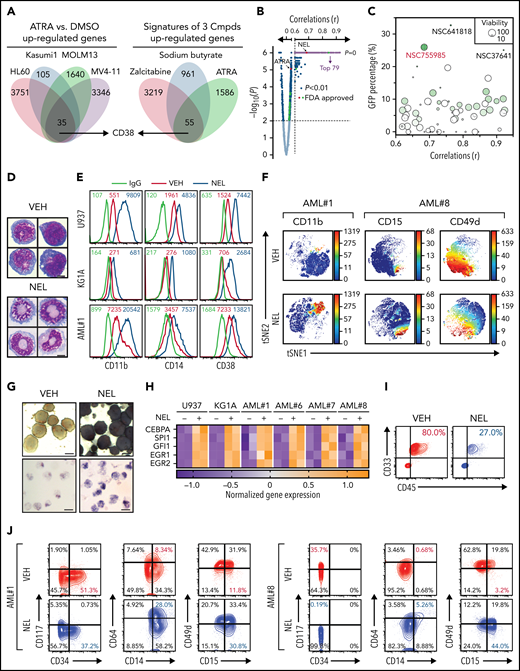

Functional screen reveals a differentiation-induction activity of nelarabine. (A) Venn plots depicting the approach to identify a differentiation marker by integrative analyses of GSE125112 dataset and CellMiner. Thirty-five genes were identified as overlapped upregulated genes after ATRA treatment in 4 AML lines (i); 55 genes were identified as overlapped upregulated genes among 3 differentiation-induction agents mediated gene expression profiles (ii). CD38 is the only overlapped gene from 2 lists. (B) Volcano plot showing Pearson correlations vs -Log10P values for all compounds retrieved from CellMiner with CD38 as input. FDA-approved compounds are highlighted in green. Isotretinoin (ATRA) and nelarabine (NEL) are highlighted in red. Among the top 193 compounds (r > 0.6, P = 0, highlighted in purple), 79 available compounds were requested for further analysis. (C) Effects of 79 compounds on differentiation assessed by green fluorescent protein percentage in ER-HoxA9 cells. The diameter indicates the relative cell viability. Nelarabine (NSC755985) is highlighted in red. (D) Representative morphologic changes in ER-HoxA9 cells that accompanied myeloid differentiation shown by Wright-Giemsa staining of cells in the presence and absence of nelarabine treatment (10 µM, 96 hours). Scale bar, 5 μm. (E) Expression levels of surface markers CD11b, CD14, and CD38 in indicated cell lines and primary AML CD34+ cells (AML#1) after NEL treatment (U937, KG1A, 10 µM, 96 hours; AML#1, 20 µM, 96 hours). Mean fluorescence intensity is indicated in histograms. (F) Representative t-distributed stochastic neighbor embedding (tSNE) display of mass cytometry analyses of primary AML cells treated with NEL (20 µM, 96 hours), colored by expression of the indicated markers based on CD3−CD19− subsets. (G) Representative cytochemical staining of U937 cells after NEL treatment (10 µM, 96 hours) assessed by monocyte-specific α-naphthyl acetate esterase assay (i) and nitroblue tetrazolium reduction assay (ii). Scale bar, 15 μm. (H) Heatmap showing expressions of myeloid transcription factors in indicated AML cells after NEL treatment (U937, KG1A, 10 µM, 48 hours; AML#1, AML#6, AML#7, AML#8, 20 µM, 48 hours). Gene expression levels shown in duplicates were first normalized to GAPDH and then vehicle-treated cells. (I-K) Purified cells (1 × 10⁶ cells per mouse) from primary specimens AML#1 (CD34+ cells) and AML#8 (CD3+ depleted cells) were injected into sublethally irradiated NSGS mice. Following confirmation of >1% engraftment in peripheral blood (PB), mice were treated with NEL (217 mg/kg, IV, daily) or vehicle (PBS) for 2 weeks (n = 6 mice per group). Human cell engraftment was analyzed 12 weeks after bone marrow transplantation (BMT). Representative CD45 and CD33 expression in BM of xenografts (I), immunophenotype of the primitive subpopulation (CD34+ or CD117+), monocyte subpopulation (CD14+/CD64+), and neutrophil subpopulation (CD15+/CD49d−) (J), and percentage of human CD45+ cells in total BM (K) are shown. For panel K, results represent the mean ± SEM. **P < .01. (L-N) U937-lucifase cells (0.5 × 10⁶ cells per mouse) were injected into sublethally irradiated NSGS mice. Following engraftment confirmation, mice were treated with NEL (217 mg/kg, IV, daily) or vehicle (PBS) for 7 days (n = 9 per group) and then assessed for engraftment by in vivo bioluminescence imaging (L). Quantitative results from bioimaging (M) and mice survival after treatment discontinuation (N) are shown. For panel M, results represent mean ± SEM. ns, nonsignificant; **P < .01.
Functional screen reveals a differentiation-induction activity of nelarabine. (A) Venn plots depicting the approach to identify a differentiation marker by integrative analyses of GSE125112 dataset and CellMiner. Thirty-five genes were identified as overlapped upregulated genes after ATRA treatment in 4 AML lines (i); 55 genes were identified as overlapped upregulated genes among 3 differentiation-induction agents mediated gene expression profiles (ii). CD38 is the only overlapped gene from 2 lists. (B) Volcano plot showing Pearson correlations vs -Log10P values for all compounds retrieved from CellMiner with CD38 as input. FDA-approved compounds are highlighted in green. Isotretinoin (ATRA) and nelarabine (NEL) are highlighted in red. Among the top 193 compounds (r > 0.6, P = 0, highlighted in purple), 79 available compounds were requested for further analysis. (C) Effects of 79 compounds on differentiation assessed by green fluorescent protein percentage in ER-HoxA9 cells. The diameter indicates the relative cell viability. Nelarabine (NSC755985) is highlighted in red. (D) Representative morphologic changes in ER-HoxA9 cells that accompanied myeloid differentiation shown by Wright-Giemsa staining of cells in the presence and absence of nelarabine treatment (10 µM, 96 hours). Scale bar, 5 μm. (E) Expression levels of surface markers CD11b, CD14, and CD38 in indicated cell lines and primary AML CD34+ cells (AML#1) after NEL treatment (U937, KG1A, 10 µM, 96 hours; AML#1, 20 µM, 96 hours). Mean fluorescence intensity is indicated in histograms. (F) Representative t-distributed stochastic neighbor embedding (tSNE) display of mass cytometry analyses of primary AML cells treated with NEL (20 µM, 96 hours), colored by expression of the indicated markers based on CD3−CD19− subsets. (G) Representative cytochemical staining of U937 cells after NEL treatment (10 µM, 96 hours) assessed by monocyte-specific α-naphthyl acetate esterase assay (i) and nitroblue tetrazolium reduction assay (ii). Scale bar, 15 μm. (H) Heatmap showing expressions of myeloid transcription factors in indicated AML cells after NEL treatment (U937, KG1A, 10 µM, 48 hours; AML#1, AML#6, AML#7, AML#8, 20 µM, 48 hours). Gene expression levels shown in duplicates were first normalized to GAPDH and then vehicle-treated cells. (I-K) Purified cells (1 × 10⁶ cells per mouse) from primary specimens AML#1 (CD34+ cells) and AML#8 (CD3+ depleted cells) were injected into sublethally irradiated NSGS mice. Following confirmation of >1% engraftment in peripheral blood (PB), mice were treated with NEL (217 mg/kg, IV, daily) or vehicle (PBS) for 2 weeks (n = 6 mice per group). Human cell engraftment was analyzed 12 weeks after bone marrow transplantation (BMT). Representative CD45 and CD33 expression in BM of xenografts (I), immunophenotype of the primitive subpopulation (CD34+ or CD117+), monocyte subpopulation (CD14+/CD64+), and neutrophil subpopulation (CD15+/CD49d−) (J), and percentage of human CD45+ cells in total BM (K) are shown. For panel K, results represent the mean ± SEM. **P < .01. (L-N) U937-lucifase cells (0.5 × 10⁶ cells per mouse) were injected into sublethally irradiated NSGS mice. Following engraftment confirmation, mice were treated with NEL (217 mg/kg, IV, daily) or vehicle (PBS) for 7 days (n = 9 per group) and then assessed for engraftment by in vivo bioluminescence imaging (L). Quantitative results from bioimaging (M) and mice survival after treatment discontinuation (N) are shown. For panel M, results represent mean ± SEM. ns, nonsignificant; **P < .01.
We next queried the developmental therapeutics program database (>20 000 compounds) with CD38 as input (Figure 1B). Among compounds retrieved from CellMiner,25 26 US Food and Drug Administration (FDA)-approved compounds were positively correlated with CD38 level (r > 0.3, P < .01), including ATRA (NSC-122758; r = 0.543, P < .01). We requested the top 79 compounds available from the National Cancer Institute (r > 0.6, P = 0) for phenotypic screen (Figure 1B; supplemental Table 3) using ER-HoxA9 cells, a murine differentiation-arrest model.7 At a fixed dose of 5 µg/mL, 3 compounds (NSC-641818, NSC-37641, and NSC-755985 [NEL]) exhibited remarkable differentiation (GFP+ percentage >25%; Figure 1C). NEL was the only FDA-approved compound identified.30-34 Following NEL treatment, ER-HoxA9 cells underwent neutrophil-like changes (Figure 1D).
We next determined whether NEL promoted differentiation in human AML. NEL treatment upregulated myeloid marker expression levels within a clinically achievable concentration35 (Figure 1E-F; supplemental Figure 1D-E; supplemental Table 4). NEL-treated cells also showed cytochemical changes and cellular morphology suggestive of neutrophil or monocyte maturation36 (Figure 1G; supplemental Figure 1F). NEL treatment upregulated levels of transcription factors associated with myeloid differentiation37 (Figure 1H), eventually resulting in apoptosis and growth inhibition (supplemental Figure 1G-H). NEL’s differentiation induction effects were correlated with viability inhibition in AML cells (supplemental Figure 1I-J); the treatment had less effects on viability of normal CD34+ cells (supplemental Figure 1I). Moreover, colony-formation capacity (CFC) of AML cells was suppressed (supplemental Figure 1K).
To evaluate in vivo effects of NEL treatment, we injected CD34+ or T cell–depleted AML cells into NSGS mice38 (supplemental Figure 1L). NEL treatment39 significantly decreased leukemic cell engraftment (Figure 1I,K; supplemental Figure 1M). In vivo differentiation effects were confirmed (Figure 1J). Specifically, loss of the primitive subpopulation (CD117+ or CD34+) and emergence of monocyte or neutrophil subpopulation (CD14b+/CD64+ or CD15+/CD49d−) were seen. We further extended our study to NSGS mice xenografted with U937 cells. Importantly, NEL administration significantly delayed leukemia onset and conferred a survival advantage relative to controls (Figure 1L-N).
NEL’s differentiation-induction is caused by dNTP imbalance
Ara-GTP is NEL’s active metabolite40,41 (supplemental Figure 2A). Accordingly, U937 cells that are more sensitive to NEL relative to THP1 accumulated higher levels of Ara-GTP after comparable treatment (supplemental Figures 1I and 2B). We hypothesized that NEL-induced differentiation was related to nucleotide metabolism perturbation. Metabolomic analysis of NEL-sensitive cells (U937 and KG1A) revealed that many deoxynucleotides increased to different extents after NEL treatment (Figure 2A; supplemental Figure 2C; supplemental Table 5). Moreover, the analyses were performed after treatment for 12 hours when the cell growth had not been altered yet (supplemental Figure 1H), suggesting that these changes were unlikely consequences of cell death. NEL treatment did not increase fractions of newly generated deoxynucleotides synthesized from glucose or glutamine (Figure 2B; supplemental Figure 2D; supplemental Tables 6-7), excluding the contribution of de novo synthesis.
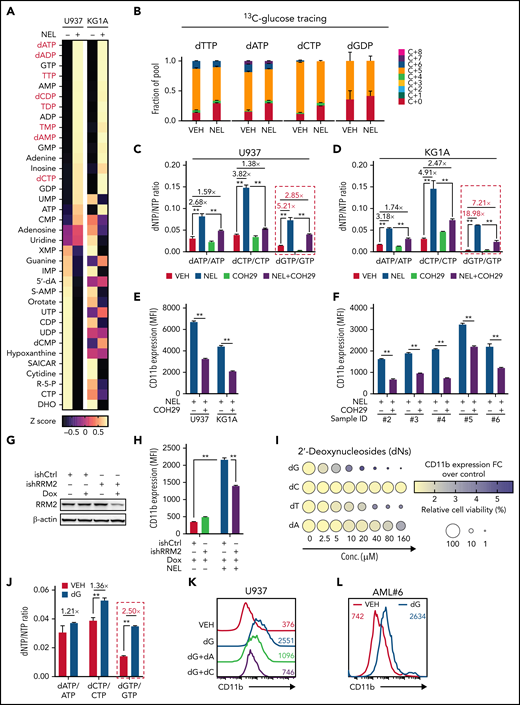
NEL’s differentiation-induction is caused by dNTP imbalance. (A) Heatmaps showing changes of 36 intracellular nucleotide metabolites in U937 (i) or KG1A (ii) cells treated with vehicle or NEL (10 µM) for 12 hours. Commonly increased deoxynucleotides in both lines are highlighted in red. Data from duplicates are represented as Z-score–normalized intensities. (B) Fractional labeling of indicated deoxynucleotides in vehicle- or NEL-treated U937 cells cultured in media containing 13C-labeled glucose for 12 hours. The color indicates different isotopologues. Data from triplicates are normalized to total amounts of individual deoxynucleotides and represented as mean ± SEM. (C-D) U937 (C) and KG1A (D) were treated with vehicle, NEL (10 µM), COH29 (10 µM), or combination for 12 hours, and intracellular dNTP levels were quantified relative to their NTP counterparts by high-performance liquid chromatography/mass spectrometry (HPLC/MS). Numbers denote the fold changes of dNTP/NTP ratios relative to vehicle-treated controls. Results represent the mean ± SEM. **P < .01. (E-F) CD11b expression levels in indicated AML lines (E) or primary AML CD34+ cells (F) treated with NEL (U937 and KG1A, 10 µM, 96 hours; primary AML cells, 20 µM, 96 hours) in the absence or presence of COH29 (10 µM). Results represent mean ± SEM. **P < .01. (G) Western blot of RRM2 proteins in U937 cells transduced with inducible shRRM2 (ishRRM2) or shCtrl (ishCtrl) construct with or without doxycycline induction (2 µg/mL). (H) CD11b expression levels of ishCtrl- and ishRRM2-U937 cells with or without NEL treatment (10 µM, 96 hours) after doxycycline induction. Results represent mean ± SEM. **P < .01. (I) Relative cell viability and CD11b expression levels of U937 cells treated with gradually increasing doses of deoxynucleosides (dA, dT, dC, dG) for 48 hours. The color represents CD11b expression fold changes over vehicle control; the diameter indicates the relative cell viability. (J) U937 cells were treated with vehicle or dG (10 µM) for 12 hours, and intracellular dNTP levels were quantified relative to their NTP counterparts by HPLC/MS. Numbers denote the fold changes of dNTP/NTP ratios relative to vehicle-treated controls. Results represent mean ± SEM. **P < .01. (K) CD11b expression levels in U937 cells treated with vehicle, dG (10 µM), dG (10 µM) plus dA (10 µM), dG (10 µM) plus dC (10 µM) for 48 hours. (L) CD11b expression levels in primary AML CD34+ cells from specimen AML#6 treated with vehicle or dG (15 µM, 48 hours). (M-N) CD11b expression levels (M) and relative cell viability (N) of sgCtrl- and sgSAMHD1-THP1 cells treated with vehicle or dG (15 µM, 48 hours). Numbers denote the fold changes relative to vehicle-treated controls. Results represent mean ± SEM. **P < .01. (O) In vitro LDA assay showing LSC frequency changes in MA9+ primary murine AML cells (i) and primary AML CD34+ cells from specimen AML#1 (ii) after dG treatment (15 µM, 7 days). (P-R) Primary AML CD34+ cells (1 × 10⁶ cells per mouse) from specimen AML#1 were first treated with vehicle or dG (15 µM, 48 hours) ex vivo and then injected into sublethally irradiated NSGS mice (6-8 mice per group). Mice were killed 12 weeks after BMT for analysis of human cell engraftment, followed by secondary transplantation. Representative CD45 and CD33 expression in BM of primary transplants (P), percentage of human CD45+ cells in BM of primary recipient mice (Q), and secondary recipient mice (R) are shown. For panels Q and R, results represent mean ± SEM. **P < .01. (S) A working model depicting how dNTP imbalance overcomes differentiation blockade and impairs LSC self-renewal. As an active metabolite of NEL, Ara-GTP disrupts dNTP pool homeostasis through promoting RNR activity. COH29 treatment reverses the differentiation phenotype by inhibiting RNR activity, whereas SAMHD1 antagonizes increases of dNTP levels.
NEL’s differentiation-induction is caused by dNTP imbalance. (A) Heatmaps showing changes of 36 intracellular nucleotide metabolites in U937 (i) or KG1A (ii) cells treated with vehicle or NEL (10 µM) for 12 hours. Commonly increased deoxynucleotides in both lines are highlighted in red. Data from duplicates are represented as Z-score–normalized intensities. (B) Fractional labeling of indicated deoxynucleotides in vehicle- or NEL-treated U937 cells cultured in media containing 13C-labeled glucose for 12 hours. The color indicates different isotopologues. Data from triplicates are normalized to total amounts of individual deoxynucleotides and represented as mean ± SEM. (C-D) U937 (C) and KG1A (D) were treated with vehicle, NEL (10 µM), COH29 (10 µM), or combination for 12 hours, and intracellular dNTP levels were quantified relative to their NTP counterparts by high-performance liquid chromatography/mass spectrometry (HPLC/MS). Numbers denote the fold changes of dNTP/NTP ratios relative to vehicle-treated controls. Results represent the mean ± SEM. **P < .01. (E-F) CD11b expression levels in indicated AML lines (E) or primary AML CD34+ cells (F) treated with NEL (U937 and KG1A, 10 µM, 96 hours; primary AML cells, 20 µM, 96 hours) in the absence or presence of COH29 (10 µM). Results represent mean ± SEM. **P < .01. (G) Western blot of RRM2 proteins in U937 cells transduced with inducible shRRM2 (ishRRM2) or shCtrl (ishCtrl) construct with or without doxycycline induction (2 µg/mL). (H) CD11b expression levels of ishCtrl- and ishRRM2-U937 cells with or without NEL treatment (10 µM, 96 hours) after doxycycline induction. Results represent mean ± SEM. **P < .01. (I) Relative cell viability and CD11b expression levels of U937 cells treated with gradually increasing doses of deoxynucleosides (dA, dT, dC, dG) for 48 hours. The color represents CD11b expression fold changes over vehicle control; the diameter indicates the relative cell viability. (J) U937 cells were treated with vehicle or dG (10 µM) for 12 hours, and intracellular dNTP levels were quantified relative to their NTP counterparts by HPLC/MS. Numbers denote the fold changes of dNTP/NTP ratios relative to vehicle-treated controls. Results represent mean ± SEM. **P < .01. (K) CD11b expression levels in U937 cells treated with vehicle, dG (10 µM), dG (10 µM) plus dA (10 µM), dG (10 µM) plus dC (10 µM) for 48 hours. (L) CD11b expression levels in primary AML CD34+ cells from specimen AML#6 treated with vehicle or dG (15 µM, 48 hours). (M-N) CD11b expression levels (M) and relative cell viability (N) of sgCtrl- and sgSAMHD1-THP1 cells treated with vehicle or dG (15 µM, 48 hours). Numbers denote the fold changes relative to vehicle-treated controls. Results represent mean ± SEM. **P < .01. (O) In vitro LDA assay showing LSC frequency changes in MA9+ primary murine AML cells (i) and primary AML CD34+ cells from specimen AML#1 (ii) after dG treatment (15 µM, 7 days). (P-R) Primary AML CD34+ cells (1 × 10⁶ cells per mouse) from specimen AML#1 were first treated with vehicle or dG (15 µM, 48 hours) ex vivo and then injected into sublethally irradiated NSGS mice (6-8 mice per group). Mice were killed 12 weeks after BMT for analysis of human cell engraftment, followed by secondary transplantation. Representative CD45 and CD33 expression in BM of primary transplants (P), percentage of human CD45+ cells in BM of primary recipient mice (Q), and secondary recipient mice (R) are shown. For panels Q and R, results represent mean ± SEM. **P < .01. (S) A working model depicting how dNTP imbalance overcomes differentiation blockade and impairs LSC self-renewal. As an active metabolite of NEL, Ara-GTP disrupts dNTP pool homeostasis through promoting RNR activity. COH29 treatment reverses the differentiation phenotype by inhibiting RNR activity, whereas SAMHD1 antagonizes increases of dNTP levels.
Given that our initial metabolomics analysis cannot distinguish isobaric nucleotides, we performed a targeted nucleotide quantification assay to assess NEL treatment effects on a full panel of dNTPs/NTPs (Figure 2C-D; supplemental Figure 2E) and found that NEL treatment increased dNTP levels unequally. The resultant imbalance was featured by a dramatic increase in dGTP levels (Figure 2C-D; supplemental Figure 2F), in contrast to modest and symmetric increases of dNTPs during G1/S transition when RNR activity increases41-43 (supplemental Figure 2G-H).
We then asked whether the unequal increases in dNTPs and differentiation outcome were mediated by RNR. To test the possibility, we used an RNR inhibitor COH29, which targets the ligand-binding pocket of RRM2.44 Supplementation with COH29 alleviated dNTP imbalance (Figure 2C-D; supplemental Figure 2F) and reversed differentiation after NEL exposure (Figure 2E-F). Similar rescue was seen after treatment of hydroxyurea (HU), another RNR inhibitor45 (data not shown). Unlike short-term exposure (Figure 2C-D), long-term treatment of COH29 depleted dNTPs44 (supplemental Figure 2I). Although COH29 treatment alone did not induce differentiation (supplemental Figure 2J), it did inhibit cell growth in both normal and AML cells (supplemental Figure 2K-L). To validate the viability rescue by diminishing dNTP imbalances, we established an “RRM2-low” line by introducing a doxycycline (DOX)-inducible RRM2-shRNA construct (ishRRM2) into U937 cells. DOX treatment decreased RRM2 protein levels by approximately 50% (Figure 2G), with minimal effects on cell cycling (supplemental Figure 2M). As anticipated, after NEL treatment, this line exhibited less dNTP imbalance (supplemental Figure 2N), differentiation (Figure 2H; supplemental Figure 2O), and viability inhibition (supplemental Figure 2P) than those seen in controls (ishCtrl).
We then tested whether supplementing cells with individual deoxynucleosides (dNs)18 to experimentally create a dNTP imbalance would phenocopy NEL treatment, given that exogenous dNs can be salvaged to form dNTPs.46 Indeed, dG treatment induced robust differentiation and cell death (Figure 2I; supplemental Figure 2Q). dT or dA treatment induced differentiation at relatively higher doses, whereas dC did not antagonize cell viability as reported18,47 (Figure 2I). dG treatment promoted a significant increase in total dGTP levels to an extent greater than that of any other dNTPs (Figure 2J; supplemental Figure 2R). Notably, addition of dC or dA could diminish dG’s effects (Figure 2K; supplemental Figure 2R-S). Furthermore, addition of forodesine, an inhibitor of purine nucleoside phosphorylase,48 could exacerbate dG-triggered imbalance, whereas forodesine alone was less effective than dG (supplemental Figure 2T). dG treatment induced differentiation and inhibited viability of AML cells within a clinically achievable dosage49 (Figure 2L; supplemental Figure 2U-V). We further depleted SAMHD1 as a safeguard of dNTP homeostasis19 in SAMHD1-proficient THP1 cells (supplemental Figure 2W-Y) and observed enhanced dG-mediated differentiation and growth inhibition relative to SAMHD1 wild-type (WT) controls (Figure 2M-N), confirming the importance of dNTP imbalance.
To evaluate the effects of dNTP pool imbalance on leukemia stem cell (LSC) activity, we conducted in vitro limiting dilution assay50-52 using BM cells from Mll-AF9 transgenic mice53 or primary AML cells. dG treatment resulted in a decrease in LSC frequency and differentiation induction (Figure 2O; supplemental Figure 2Z). Relative to vehicle controls, dG pretreatment markedly decreased engraftment of leukemic cells in NSGS mice at 12 weeks after transplantation (Figure 2P-Q). Notably, secondary transplantation of BM cells from mice receiving dG-pretreated cells resulted in nearly complete elimination of leukemia engraftment (Figure 2R) compared with those of control cells, highlighting the impairment of LSC self-renewal (Figure 2S).
Replication stress-mediated RRM2 upregulation is responsible for myeloid differentiation
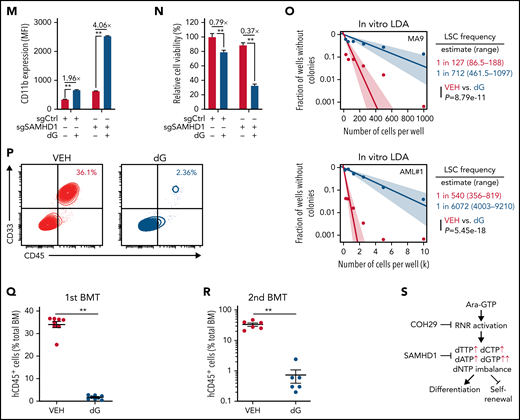
We next asked whether treatment of NEL, a known genotoxin, upregulated RNR subunits through DNA damage response machinery.9,54 Among RNRs, RRM2 levels were significantly upregulated by NEL treatment (Figure 3A-B). Immunofluorescence revealed enhanced cytoplasmic level and nuclear localization of RRM2 (Figure 3C). Notably, NEL treatment for 12 hours significantly altered levels of ATR signaling effectors, including p-CHK1 and E2F1, whereas modest alterations were seen on p-CHK2 (Figure 3B). Consistently, unlike ATM inhibition, ATR inhibition or E2F1 knockdown reduced NEL-mediated upregulation of RRM2 (Figure 3D-E; supplemental Figure 3A-C), confirming that NEL treatment upregulated RRM2 via the ATR/CHK1/E2F1 axis.55 RRM2 levels correlate with NEL sensitivity in hematopoietic cancer cell lines in contrast to the role of SAMHD1 as reported56 (Figure 3F; supplemental Figure 3D). Accordingly, NEL treatment caused more robust increased levels of RRM2 and DNA damage effectors in SAMHD1 knockout (KO) THP1 cells compared with WT controls (supplemental Figure 3E), consistent with SAMHD1’s function in preventing Ara-GTP accumulation and decreasing replication stress.21
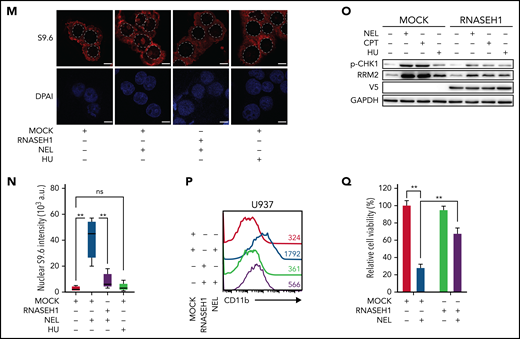
Replication stress signaling mediated RRM2 upregulation is responsible for myeloid differentiation. (A) Gene expression levels of RRM1, RRM2, and RRM2B were assessed by quantitative polymerase chain reaction analyses in indicated AML cells treated with vehicle or NEL for 12 hours (U937 and KG1A, 10 µM; AML#1, 20 µM). Data were first normalized to GAPDH levels and then vehicle-treated controls. Results represent mean ± SEM. **P < .01. (B) Western blot of the indicated proteins in U937 and primary AML CD34+ cells from specimen AML#1 treated with vehicle or NEL (U937, 10 µM; AML#1, 20 µM) for 12 hours. (C) Immunofluorescence analysis of RRM2 expression in U937 cells treated with vehicle or NEL (10 µM) for 12 hours. Scale bar, 5 μm. (D) Western blot of the indicated proteins in U937 cells treated with vehicle, NEL (10 µM), BAY1895344 (50 nM), or combination for 12 hours. (E) Western blot of the indicated proteins in U937 cells transduced with shRNA against E2F1 (shE2F1) or scramble control (shCtrl) after NEL treatment (10 µM) for 12 hours. (F) Pearson correlation of RRM2 and SAMHD1 mRNA expression levels with NEL sensitivity in a panel of 57 hematopoietic cell lines. Data were sourced from Cancer Therapeutics Response Portal (CTRP). (G) Western blot of the indicated proteins in U937 and THP1 cells treated with vehicle or Ara-C (0.5 μM) for 12 hours. (H) U937 cells were treated with vehicle, Ara-C (0.5 μM), COH29 (10 μM), or combination for 12 hours, and intracellular dNTP levels were quantified relative to their NTP counterparts by HPLC/MS. Numbers denote the fold changes of dNTP/NTP ratios relative to vehicle-treated controls. Results represent mean ± SEM. *P < .05; **P < .01. (I) CD11b expression levels in primary AML CD34+ cells (n = 5) treated with vehicle, Ara-C (0.5 μM), COH29 (10 μM), or combination for 96 hours. (J) CD11b expression levels of ishCtrl- and ishRRM2-U937 cells with or without Ara-C treatment (0.5 μM, 96 hours) after doxycycline induction. (K) Pearson correlation of RRM2 mRNA expression levels with Ara-C sensitivity in a panel of 67 hematopoietic cell lines. Data were sourced from CTRP portal. (L) Kaplan-Meier survival analysis of a cohort of patients with AML (GSE14468) after dichotomization for RRM2 mRNA levels below (blue, n = 70) and above (red, n = 192) 7.69 log2 transformed intensity (P = .019). (M-N) Representative immunofluorescence images (M) and quantification of nuclear S9.6 intensity (N) in U937 cells transduced with empty vector (MOCK) or V5-tagged RNASEH1 construct after treatment with NEL (10 µM) or HU (20 µM) for 6 hours. Regions of interest for specific quantification of nuclear S9.6 staining were highlighted by dotted white lines. Scale bar, 10 μm. Box-whisker plots indicate median, 25th to 75th percentile, and maximum and minimum values by line, box, and whiskers, respectively. ns, nonsignificant; **P < .01. (O) Western blot of the indicated proteins in MOCK- or RNASEH1-transduced U937 cells after treatment with vehicle, NEL (10 µM), CPT (20 nM), or HU (20 µM) for 12 hours. (P-Q) CD11b expression levels (P) and relative cell viability (Q) of MOCK- or RNASEH1-transduced U937 cells after treatment with vehicle or NEL (10 µM) for 96 hours. Results represent mean ± SEM. **P < .01.
Replication stress signaling mediated RRM2 upregulation is responsible for myeloid differentiation. (A) Gene expression levels of RRM1, RRM2, and RRM2B were assessed by quantitative polymerase chain reaction analyses in indicated AML cells treated with vehicle or NEL for 12 hours (U937 and KG1A, 10 µM; AML#1, 20 µM). Data were first normalized to GAPDH levels and then vehicle-treated controls. Results represent mean ± SEM. **P < .01. (B) Western blot of the indicated proteins in U937 and primary AML CD34+ cells from specimen AML#1 treated with vehicle or NEL (U937, 10 µM; AML#1, 20 µM) for 12 hours. (C) Immunofluorescence analysis of RRM2 expression in U937 cells treated with vehicle or NEL (10 µM) for 12 hours. Scale bar, 5 μm. (D) Western blot of the indicated proteins in U937 cells treated with vehicle, NEL (10 µM), BAY1895344 (50 nM), or combination for 12 hours. (E) Western blot of the indicated proteins in U937 cells transduced with shRNA against E2F1 (shE2F1) or scramble control (shCtrl) after NEL treatment (10 µM) for 12 hours. (F) Pearson correlation of RRM2 and SAMHD1 mRNA expression levels with NEL sensitivity in a panel of 57 hematopoietic cell lines. Data were sourced from Cancer Therapeutics Response Portal (CTRP). (G) Western blot of the indicated proteins in U937 and THP1 cells treated with vehicle or Ara-C (0.5 μM) for 12 hours. (H) U937 cells were treated with vehicle, Ara-C (0.5 μM), COH29 (10 μM), or combination for 12 hours, and intracellular dNTP levels were quantified relative to their NTP counterparts by HPLC/MS. Numbers denote the fold changes of dNTP/NTP ratios relative to vehicle-treated controls. Results represent mean ± SEM. *P < .05; **P < .01. (I) CD11b expression levels in primary AML CD34+ cells (n = 5) treated with vehicle, Ara-C (0.5 μM), COH29 (10 μM), or combination for 96 hours. (J) CD11b expression levels of ishCtrl- and ishRRM2-U937 cells with or without Ara-C treatment (0.5 μM, 96 hours) after doxycycline induction. (K) Pearson correlation of RRM2 mRNA expression levels with Ara-C sensitivity in a panel of 67 hematopoietic cell lines. Data were sourced from CTRP portal. (L) Kaplan-Meier survival analysis of a cohort of patients with AML (GSE14468) after dichotomization for RRM2 mRNA levels below (blue, n = 70) and above (red, n = 192) 7.69 log2 transformed intensity (P = .019). (M-N) Representative immunofluorescence images (M) and quantification of nuclear S9.6 intensity (N) in U937 cells transduced with empty vector (MOCK) or V5-tagged RNASEH1 construct after treatment with NEL (10 µM) or HU (20 µM) for 6 hours. Regions of interest for specific quantification of nuclear S9.6 staining were highlighted by dotted white lines. Scale bar, 10 μm. Box-whisker plots indicate median, 25th to 75th percentile, and maximum and minimum values by line, box, and whiskers, respectively. ns, nonsignificant; **P < .01. (O) Western blot of the indicated proteins in MOCK- or RNASEH1-transduced U937 cells after treatment with vehicle, NEL (10 µM), CPT (20 nM), or HU (20 µM) for 12 hours. (P-Q) CD11b expression levels (P) and relative cell viability (Q) of MOCK- or RNASEH1-transduced U937 cells after treatment with vehicle or NEL (10 µM) for 96 hours. Results represent mean ± SEM. **P < .01.
The mechanism of Ara-C action is similar to NEL41,57; thus, we asked whether differentiation induction seen after Ara-C treatment as reported previously6,58 involved RRM2 activation. Indeed, Ara-C significantly increased RRM2, p-CHK1, E2F1, and dNTP levels in U937 cells but only induced modest changes in SAMHD1-proficient THP1 cells (Figure 3G; supplemental Figure 3F). Next, we assessed the role of RNR in Ara-C treatment effects by applying 2 strategies mentioned above. In 1, COH29 treatment alleviated dNTP imbalance (Figure 3H; supplemental Figure 3G) and weakened differentiation markers upregulation after Ara-C treatment (Figure 3I; supplemental Figure 3H-I). In another approach using ishRRM2-U937 as a model, Ara-C treatment resulted in less differentiation induction relative to that seen in ishCtrl-U937 cells (Figure 3J). Notably, RRM2 levels are strongly and positively correlated with Ara-C sensitivity (Figure 3K; supplemental Figure 3J), whereas SAMHD1 is a resistant factor.20,21 Additionally, we asked whether patients with AML exhibiting high RRM2 levels achieve better outcomes after treatment with Ara-C–based standard care. Indeed, we observed a positive correlation between higher RRM2 levels and longer overall survival (Figure 3L; supplemental Figure 3K-L; Table 1) through retrospectively analyzing both TCGA59 and GSE1446860 cohorts.
Hazard rates for mRNA levels of RRM2 in AML patients treated with Ara-C
| mRNA | GSE14468 cohort | TCGA cohort | ||
|---|---|---|---|---|
| Overall survival* | Overall survival† | Overall survival* | Overall survival† | |
| RRM2 | 0.68 (0.49-0.94; .02) | 0.72 (0.51-1.01; .05) | 0.70 (0.43-1.15; .16) | 0.81 (0.49-1.33; .40) |
| mRNA | GSE14468 cohort | TCGA cohort | ||
|---|---|---|---|---|
| Overall survival* | Overall survival† | Overall survival* | Overall survival† | |
| RRM2 | 0.68 (0.49-0.94; .02) | 0.72 (0.51-1.01; .05) | 0.70 (0.43-1.15; .16) | 0.81 (0.49-1.33; .40) |
Shown are hazard rates, 95% confidence intervals, and P values calculated with Wald test. Bold text indicates P < .05.
Data from univariate analysis.
Data adjusted for age and sex.
To further define the differentiation-related DNA insult by NEL treatment, we tested whether the insult associated with excessive formation of R-loops that specifically activate ATR signaling.15,16,61 Interestingly, Ara-C is known to trigger R-loop formation,62 likely because of transcription-replication conflicts. Similarly, NEL treatment enhanced R-loops formation evidenced by increased nuclear staining of the S9.6 antibody (Figure 3M-N). Overexpressing RNASEH1 to resolve R-loops remarkably abrogated ATR/CHK1 activation and RRM2 upregulation, thereby blocking differentiation induction and partially rescuing viability inhibition by NEL treatment (Figure 3M-Q). Moreover, HU did not induce R-loop formation (Figure 3M-N) or differentiation (supplemental Figure 3M), although it resulted in DNA damage as evidenced by CHK1 phosphorylation (Figure 3O).
We next asked whether non–DNA-incorporating compounds could induce differentiation in an RNR-dependent manner. Camptothecin (CPT), a topoisomerase I inhibitor, reportedly induces leukemia cell differentiation.63 Similar to Ara-C, CPT treatment increased RRM2, p-CHK1, and E2F1 levels in AML cells (supplemental Figure 3N-O). Notably, the drug-induced effects on dNTP imbalance and differentiation were significantly rescued by RNR downregulation, whereas viability inhibition was partially reversed (supplemental Figure 3P-T). Moreover, CPT is also known to induce R-loop formation.55 Consistently, overexpressing RNASEH1 abrogated ATR/CHK1 activation and RRM2 upregulation by CPT treatment (Figure 3O).
Genetically elevating RRM2 levels impairs AML maintenance
We asked whether direct upregulation of RRM2 would initiate differentiation. We first used THP1 as a model. Following CDK2-mediated phosphorylation of Thr33, WT RRM2 was recognized by Cyclin-F (CCNF) via the RxI motif (aa49-aa51) for degradation at G2/M phase.14 Although ectopic expression of WT FLAG-RRM2 marginally affected RRM2 levels, expression of RRM2 mutants exhibiting less binding affinity to CCNF14 (RRM2-T33A [T33A] and RRM2-RxI/AxA [Rxl/AxA]) promoted RRM2 accumulation (supplemental Figure 4A), thereby decreasing cell viability (supplemental Figure 4B). Given that RRM2 protein accumulated mostly after Rxl/AxA overexpression (OE), we transduced an inducible RRM2-RxI/AxA mutant (iRxI/AxA) into THP1 for further analysis (Figure 4A; supplemental Figure 4C). After DOX induction, iRxI/AxA-transduced cells showed increased dNTPs, particularly a marked increase in dGTP, pronounced differentiation, and decreased viability relative to MOCK cells (Figure 4B-C; supplemental Figure 4D). To further enhance RRM2 activity, we exposed this inducible line to the combination of DOX plus NEL or DOX plus Ara-C. Relative to DOX alone, the combination further increased RRM2 levels, aggravated dNTP imbalance, enhanced CD11b induction, and inhibited viability (Figure 4A-C; supplemental Figure 4D). To assess outcomes in vivo, we transplanted these engineered cells into NSGS mice and treated mice with combination of DOX plus NEL or DOX plus phosphate-buffered saline (PBS). Mice injected with MOCK cells receiving combination of DOX plus PBS succumbed to systemic disease shortly, whereas mice injected with iRxI/AxA cells receiving combination of DOX plus PBS survived significantly longer and exhibited reduced leukemic burden (Figure 4D-E). Relative to PBS controls, NEL treatment further decreased leukemic burden and prolonged survival in mice engrafted with iRxI/AxA cells (Figure 4D-E). Similar results were seen in leukemic mice treated with Ara-C (supplemental Figure 4E-F).
![Genetically elevating RRM2 levels impairs AML maintenance. (A-B) Western blot of RRM2 protein levels (A) and primer extension assay of intracellular dNTP levels (B) in THP1 cells engineered with empty vector (MOCK) or inducible RRM2 Rxl/AxA (iRxl/AxA) mutant, further treated with vehicle or NEL (20 µM, 12 hours) after doxycycline (DOX) induction. Rxl/AxA, CCNF binding-deficient RRM2 construct: RxI motif located at RRM2 residues aa49-aa51, reportedly binding to cyclin F, was mutated to AxA. Numbers denote the fold changes relative to vehicle-treated MOCK controls. For panel B, results represent mean ± SEM. *P < .05; **P < .01. (C) CD11b expression levels in MOCK- or iRxl/AxA-THP1 cells treated with vehicle, NEL (20 µM), or Ara-C (0.5 µM) for 96 hours after DOX induction. Results represent mean ± SEM. **P < .01. (D-E) Engineered THP1 cells (1 × 10⁶ cells per mouse) were injected into NSGS mice. Following engraftment, 2 groups of mice receiving either MOCK cells or iRxl/AxA cells were treated with DOX (10 mg/kg, daily). In MOCK or iRxl/AxA transplants, mice were divided into 2 treatment groups injected with either vehicle (PBS) or NEL (217 mg/kg, IV daily; n = 5 per group) and then assessed for engraftment by bioluminescence imaging (D) or monitored for survival (E). (F) Pearson correlation of RRM2 mRNA expression with CCNF gene dependency scores in 94 hematologic cancer cell lines, sourced from Depmap portal. The x axis denotes to RRM2 expression levels of cell lines presented as log2-transformed TPM values. (G) Western blot of the indicated proteins in THP1 cells transduced with lentiviral vectors expressing shRNA against CCNF (shCCNF#1 [chosen to be used further, namely shCCNF], shCCNF#2) or scramble control (shCtrl), followed by G2/M enrichment through treatment with nocodazole (100 ng/mL, 16 hours). (H) Intracellular dNTP levels of shCtrl- or shCCNF-THP1 cells followed by G2/M enrichment through treatment with nocodazole (100 ng/mL, 16 hours). Numbers denote the fold changes relative to shCtrl-THP1 cells. Results represent mean ± SEM. **P < .01. (I) CD11b expression levels in THP1 cells transduced with shCtrl, shCCNF#1, or shCCNF#2 lentivirus for 4 days. (J) Western blot of the indicated proteins in primary AML CD34+ cells (n = 6) transduced with shCtrl or shCCNF lentivirus, followed by G2/M enrichment through treatment with nocodazole (100 ng/mL, 16 hours). (K) Primary AML CD34+ cells (n = 6) were transduced with shCtrl or shCCNF lentivirus before viability inhibition assay for 96 hours in the presence of Ara-C at the indicated concentrations. The IC50 values between cells transduced with shCtrl lentivirus and their shCCNF counterparts were analyzed by means of extra-sum-of-squares F test. Results represent mean ± SEM. *P < .05; **P < .01. (L) Serial replating of Samhd1 WT/MOCK, Samhd1 KO/MOCK, Samhd1 WT/RRM2 OE, and Samhd1 KO/RRM2 OE cells engineered from MA9+ murine AML cells. Results represent mean ± SEM. ns, nonsignificant; *P < .05; **P < .01. (M) Percentages of CD45.2+ donor chimerism in BM of recipients (n = 6 per group) transplanted with engineered cells as indicated on day 30 after DOX induction. Results represent mean ± SEM. **P < .01. (N) Survival of CD45.1+ congenic recipients transplanted with engineered MA9+ murine AML cells as indicated. Doxycycline induction (10 mg/kg, daily) started 2 weeks after transplantation. (O) In vivo LDA assay showing LSC frequency changes in MA9+ primary murine AML cells after Samhd1 KO or RRM2 OE.](https://ash.silverchair-cdn.com/ash/content_public/journal/blood/139/26/10.1182_blood.2021015108/3/m_bloodbld2021015108f4a.png?Expires=1769267838&Signature=QXp7Oq-dt4ppVW~uYD095PH9O4e0Mn5SyXC-WlQ5HereK9iH4oY4N8X9xL8WRwIMWivFhnfQYfzds44ICJ-7QhnkD6zAo8Pg-jC~jvTgVVGzuWj0jdevnnriepGTgixFDgH6FP2YqGf-V19Flho48XMQ1A1Z-zqIhP-XUeiGMfmwQVc79IfytnByzaizJ7Zx4xEKeVNCFQZR7Ny4mLxkpkS6iLs4joxv003E5-7a1zlzced5CtfBvDtJ6RLdYGH5qqkwsmO2nnPnSrqlis72rWTXVbPZmLKLeo3VQjvv8B4HmgHvhGW4R31g7Wk7At10hlexaOVCVr55iwH0gfOMPQ__&Key-Pair-Id=APKAIE5G5CRDK6RD3PGA)
![Genetically elevating RRM2 levels impairs AML maintenance. (A-B) Western blot of RRM2 protein levels (A) and primer extension assay of intracellular dNTP levels (B) in THP1 cells engineered with empty vector (MOCK) or inducible RRM2 Rxl/AxA (iRxl/AxA) mutant, further treated with vehicle or NEL (20 µM, 12 hours) after doxycycline (DOX) induction. Rxl/AxA, CCNF binding-deficient RRM2 construct: RxI motif located at RRM2 residues aa49-aa51, reportedly binding to cyclin F, was mutated to AxA. Numbers denote the fold changes relative to vehicle-treated MOCK controls. For panel B, results represent mean ± SEM. *P < .05; **P < .01. (C) CD11b expression levels in MOCK- or iRxl/AxA-THP1 cells treated with vehicle, NEL (20 µM), or Ara-C (0.5 µM) for 96 hours after DOX induction. Results represent mean ± SEM. **P < .01. (D-E) Engineered THP1 cells (1 × 10⁶ cells per mouse) were injected into NSGS mice. Following engraftment, 2 groups of mice receiving either MOCK cells or iRxl/AxA cells were treated with DOX (10 mg/kg, daily). In MOCK or iRxl/AxA transplants, mice were divided into 2 treatment groups injected with either vehicle (PBS) or NEL (217 mg/kg, IV daily; n = 5 per group) and then assessed for engraftment by bioluminescence imaging (D) or monitored for survival (E). (F) Pearson correlation of RRM2 mRNA expression with CCNF gene dependency scores in 94 hematologic cancer cell lines, sourced from Depmap portal. The x axis denotes to RRM2 expression levels of cell lines presented as log2-transformed TPM values. (G) Western blot of the indicated proteins in THP1 cells transduced with lentiviral vectors expressing shRNA against CCNF (shCCNF#1 [chosen to be used further, namely shCCNF], shCCNF#2) or scramble control (shCtrl), followed by G2/M enrichment through treatment with nocodazole (100 ng/mL, 16 hours). (H) Intracellular dNTP levels of shCtrl- or shCCNF-THP1 cells followed by G2/M enrichment through treatment with nocodazole (100 ng/mL, 16 hours). Numbers denote the fold changes relative to shCtrl-THP1 cells. Results represent mean ± SEM. **P < .01. (I) CD11b expression levels in THP1 cells transduced with shCtrl, shCCNF#1, or shCCNF#2 lentivirus for 4 days. (J) Western blot of the indicated proteins in primary AML CD34+ cells (n = 6) transduced with shCtrl or shCCNF lentivirus, followed by G2/M enrichment through treatment with nocodazole (100 ng/mL, 16 hours). (K) Primary AML CD34+ cells (n = 6) were transduced with shCtrl or shCCNF lentivirus before viability inhibition assay for 96 hours in the presence of Ara-C at the indicated concentrations. The IC50 values between cells transduced with shCtrl lentivirus and their shCCNF counterparts were analyzed by means of extra-sum-of-squares F test. Results represent mean ± SEM. *P < .05; **P < .01. (L) Serial replating of Samhd1 WT/MOCK, Samhd1 KO/MOCK, Samhd1 WT/RRM2 OE, and Samhd1 KO/RRM2 OE cells engineered from MA9+ murine AML cells. Results represent mean ± SEM. ns, nonsignificant; *P < .05; **P < .01. (M) Percentages of CD45.2+ donor chimerism in BM of recipients (n = 6 per group) transplanted with engineered cells as indicated on day 30 after DOX induction. Results represent mean ± SEM. **P < .01. (N) Survival of CD45.1+ congenic recipients transplanted with engineered MA9+ murine AML cells as indicated. Doxycycline induction (10 mg/kg, daily) started 2 weeks after transplantation. (O) In vivo LDA assay showing LSC frequency changes in MA9+ primary murine AML cells after Samhd1 KO or RRM2 OE.](https://ash.silverchair-cdn.com/ash/content_public/journal/blood/139/26/10.1182_blood.2021015108/3/m_bloodbld2021015108f4b.png?Expires=1769267838&Signature=33G4NyLoj7aD4ZYmWMkp2WWBqkmFNqXvN1TXzbxUGY3~XPVkY1xfaTVOfsURVtBeWw6hxVPq21--qGj~rUG8iaxMiX2GLXgAZ1bdSKP4C-d7dj~CtjpFh7Ehtz8~kWYilTfBEu06mU0hmpV8M3CBCb7DSnv3b63UODwTxtooqunkxWHITt7DUf~lc5O~x13VGMYbljwx-YjLup65COXORHNkZ-t7PEvWoJkMCwfVKTu0MwWtAtNb0CRK3HkNFCWLCnOak6sD4Y3QudYmmlgX~SPhC26zhe2MOuky-jpStdjs644n8QMt3sXTvPaT9eN1dwMWg6txPtLpLo~xJJ4DfQ__&Key-Pair-Id=APKAIE5G5CRDK6RD3PGA)
Genetically elevating RRM2 levels impairs AML maintenance. (A-B) Western blot of RRM2 protein levels (A) and primer extension assay of intracellular dNTP levels (B) in THP1 cells engineered with empty vector (MOCK) or inducible RRM2 Rxl/AxA (iRxl/AxA) mutant, further treated with vehicle or NEL (20 µM, 12 hours) after doxycycline (DOX) induction. Rxl/AxA, CCNF binding-deficient RRM2 construct: RxI motif located at RRM2 residues aa49-aa51, reportedly binding to cyclin F, was mutated to AxA. Numbers denote the fold changes relative to vehicle-treated MOCK controls. For panel B, results represent mean ± SEM. *P < .05; **P < .01. (C) CD11b expression levels in MOCK- or iRxl/AxA-THP1 cells treated with vehicle, NEL (20 µM), or Ara-C (0.5 µM) for 96 hours after DOX induction. Results represent mean ± SEM. **P < .01. (D-E) Engineered THP1 cells (1 × 10⁶ cells per mouse) were injected into NSGS mice. Following engraftment, 2 groups of mice receiving either MOCK cells or iRxl/AxA cells were treated with DOX (10 mg/kg, daily). In MOCK or iRxl/AxA transplants, mice were divided into 2 treatment groups injected with either vehicle (PBS) or NEL (217 mg/kg, IV daily; n = 5 per group) and then assessed for engraftment by bioluminescence imaging (D) or monitored for survival (E). (F) Pearson correlation of RRM2 mRNA expression with CCNF gene dependency scores in 94 hematologic cancer cell lines, sourced from Depmap portal. The x axis denotes to RRM2 expression levels of cell lines presented as log2-transformed TPM values. (G) Western blot of the indicated proteins in THP1 cells transduced with lentiviral vectors expressing shRNA against CCNF (shCCNF#1 [chosen to be used further, namely shCCNF], shCCNF#2) or scramble control (shCtrl), followed by G2/M enrichment through treatment with nocodazole (100 ng/mL, 16 hours). (H) Intracellular dNTP levels of shCtrl- or shCCNF-THP1 cells followed by G2/M enrichment through treatment with nocodazole (100 ng/mL, 16 hours). Numbers denote the fold changes relative to shCtrl-THP1 cells. Results represent mean ± SEM. **P < .01. (I) CD11b expression levels in THP1 cells transduced with shCtrl, shCCNF#1, or shCCNF#2 lentivirus for 4 days. (J) Western blot of the indicated proteins in primary AML CD34+ cells (n = 6) transduced with shCtrl or shCCNF lentivirus, followed by G2/M enrichment through treatment with nocodazole (100 ng/mL, 16 hours). (K) Primary AML CD34+ cells (n = 6) were transduced with shCtrl or shCCNF lentivirus before viability inhibition assay for 96 hours in the presence of Ara-C at the indicated concentrations. The IC50 values between cells transduced with shCtrl lentivirus and their shCCNF counterparts were analyzed by means of extra-sum-of-squares F test. Results represent mean ± SEM. *P < .05; **P < .01. (L) Serial replating of Samhd1 WT/MOCK, Samhd1 KO/MOCK, Samhd1 WT/RRM2 OE, and Samhd1 KO/RRM2 OE cells engineered from MA9+ murine AML cells. Results represent mean ± SEM. ns, nonsignificant; *P < .05; **P < .01. (M) Percentages of CD45.2+ donor chimerism in BM of recipients (n = 6 per group) transplanted with engineered cells as indicated on day 30 after DOX induction. Results represent mean ± SEM. **P < .01. (N) Survival of CD45.1+ congenic recipients transplanted with engineered MA9+ murine AML cells as indicated. Doxycycline induction (10 mg/kg, daily) started 2 weeks after transplantation. (O) In vivo LDA assay showing LSC frequency changes in MA9+ primary murine AML cells after Samhd1 KO or RRM2 OE.
Genetically elevating RRM2 levels impairs AML maintenance. (A-B) Western blot of RRM2 protein levels (A) and primer extension assay of intracellular dNTP levels (B) in THP1 cells engineered with empty vector (MOCK) or inducible RRM2 Rxl/AxA (iRxl/AxA) mutant, further treated with vehicle or NEL (20 µM, 12 hours) after doxycycline (DOX) induction. Rxl/AxA, CCNF binding-deficient RRM2 construct: RxI motif located at RRM2 residues aa49-aa51, reportedly binding to cyclin F, was mutated to AxA. Numbers denote the fold changes relative to vehicle-treated MOCK controls. For panel B, results represent mean ± SEM. *P < .05; **P < .01. (C) CD11b expression levels in MOCK- or iRxl/AxA-THP1 cells treated with vehicle, NEL (20 µM), or Ara-C (0.5 µM) for 96 hours after DOX induction. Results represent mean ± SEM. **P < .01. (D-E) Engineered THP1 cells (1 × 10⁶ cells per mouse) were injected into NSGS mice. Following engraftment, 2 groups of mice receiving either MOCK cells or iRxl/AxA cells were treated with DOX (10 mg/kg, daily). In MOCK or iRxl/AxA transplants, mice were divided into 2 treatment groups injected with either vehicle (PBS) or NEL (217 mg/kg, IV daily; n = 5 per group) and then assessed for engraftment by bioluminescence imaging (D) or monitored for survival (E). (F) Pearson correlation of RRM2 mRNA expression with CCNF gene dependency scores in 94 hematologic cancer cell lines, sourced from Depmap portal. The x axis denotes to RRM2 expression levels of cell lines presented as log2-transformed TPM values. (G) Western blot of the indicated proteins in THP1 cells transduced with lentiviral vectors expressing shRNA against CCNF (shCCNF#1 [chosen to be used further, namely shCCNF], shCCNF#2) or scramble control (shCtrl), followed by G2/M enrichment through treatment with nocodazole (100 ng/mL, 16 hours). (H) Intracellular dNTP levels of shCtrl- or shCCNF-THP1 cells followed by G2/M enrichment through treatment with nocodazole (100 ng/mL, 16 hours). Numbers denote the fold changes relative to shCtrl-THP1 cells. Results represent mean ± SEM. **P < .01. (I) CD11b expression levels in THP1 cells transduced with shCtrl, shCCNF#1, or shCCNF#2 lentivirus for 4 days. (J) Western blot of the indicated proteins in primary AML CD34+ cells (n = 6) transduced with shCtrl or shCCNF lentivirus, followed by G2/M enrichment through treatment with nocodazole (100 ng/mL, 16 hours). (K) Primary AML CD34+ cells (n = 6) were transduced with shCtrl or shCCNF lentivirus before viability inhibition assay for 96 hours in the presence of Ara-C at the indicated concentrations. The IC50 values between cells transduced with shCtrl lentivirus and their shCCNF counterparts were analyzed by means of extra-sum-of-squares F test. Results represent mean ± SEM. *P < .05; **P < .01. (L) Serial replating of Samhd1 WT/MOCK, Samhd1 KO/MOCK, Samhd1 WT/RRM2 OE, and Samhd1 KO/RRM2 OE cells engineered from MA9+ murine AML cells. Results represent mean ± SEM. ns, nonsignificant; *P < .05; **P < .01. (M) Percentages of CD45.2+ donor chimerism in BM of recipients (n = 6 per group) transplanted with engineered cells as indicated on day 30 after DOX induction. Results represent mean ± SEM. **P < .01. (N) Survival of CD45.1+ congenic recipients transplanted with engineered MA9+ murine AML cells as indicated. Doxycycline induction (10 mg/kg, daily) started 2 weeks after transplantation. (O) In vivo LDA assay showing LSC frequency changes in MA9+ primary murine AML cells after Samhd1 KO or RRM2 OE.
To assess effects of stimulating RRM2 activity in primary AML cells, we used a strategy of CCNF depletion.14 We noted CCNF dependency score was negatively correlated with RRM2 basal levels in 94 hematologic cancer cell lines (Figure 4F). Indeed, CCNF knockdown (KD) in THP1 cells promoted RRM2 accumulation, created dNTP imbalance, induced differentiation, and decreased cell growth (Figure 4G-I; supplemental Figure 4G). To determine whether RRM2 was required for CCNF KD effects, we established an RRM2-low THP1 line as described above. After DOX treatment, ishRRM2-THP1 cells exhibited decreased RRM2 levels (supplemental Figure 4D). CCNF KD significantly increased RRM2 and CD11b in ishCtrl-THP1 cells, whereas it only marginally increased RRM2 in ishRRM2-THP1 cells, with no change in CD11b levels (supplemental Figure 4H-I), suggesting that CCNF KD effects were mainly dependent on RRM2. Next, we depleted CCNF in primary AML cells and observed varying increases in RRM2 levels among specimens (n = 6; Figure 4J), hinting additional RRM2 regulatory mechanisms other than CCNF.64,65 We further assessed effects of combining CCNF KD with Ara-C or NEL treatment. CCNF KD decreased the half-maximal inhibitory concentration (IC50) values of both drugs (Figure 4K; supplemental Figure 4J) and enhanced NEL-induced differentiation compared with NEL alone at a fixed dose (20 µM; supplemental Figure 4K).
We asked whether aggravating dNTP imbalance by deleting SAMHD1 could enhance RRM2 hyperactivation mediated inhibitory effects. To do so, we used Mll-AF9/Samhd1 KO mice (Samhd1-KO) generated through crossing Samhd1 KO mice23 to Mll-AF9 transgenic mice. We expressed iRxI/AxA construct or MOCK control in Samhd1-KO or Samhd1-WT BM cells, respectively, resulting in 4 groups: Samhd1-WT/MOCK, Samhd1-KO/MOCK, Samhd1-WT/RRM2 OE, and Samhd1-KO/RRM2 OE. We then used these engineered cells for CFC re-plating. Interestingly, murine AML cells harboring iRxI/AxA showed significantly decreased CFC compared with MOCK cells in primary and serial re-platings; whereas Samhd1 KO alone barely affected CFC, it further compromised CFC in AML cells harboring iRxI/AxA (Figure 4L). To test the hypothesis in vivo, we transplanted engineered cells into CD45.1-expressing congenic recipient mice for leukemia assessment. iRxI/AxA-expressing MA9 leukemic mice exhibited reduced leukemic chimerism in BM and improved survival relative to MOCK controls (Figure 4M-N). Notably, BM cells from iRxI/AxA-expressing MA9 leukemic mice exhibited RRM2 overexpression and dGTP overproduction (supplemental Figure 4L-M). Moreover, Samhd1 KO combined with iRxI/AxA expression further decreased engraftment and extended leukemic mice survival compared with iRxI/AxA expression alone (Figure 4M-N). To test whether genetically elevating RRM2 alone or in combination with Samhd1 KO affected LSC activity, we conducted in vivo limiting dilution assays by establishing murine AML transplants using those engineered cells.52 Similarly, iRxI/AxA expression alone resulted in a remarkable decrease in LSC frequency, and the combination of Samhd1 KO and iRxI/AxA expression effectively inhibited in vivo repopulating capacity of AML cells (Figure 4O).
ERK activation contributes to myeloid differentiation
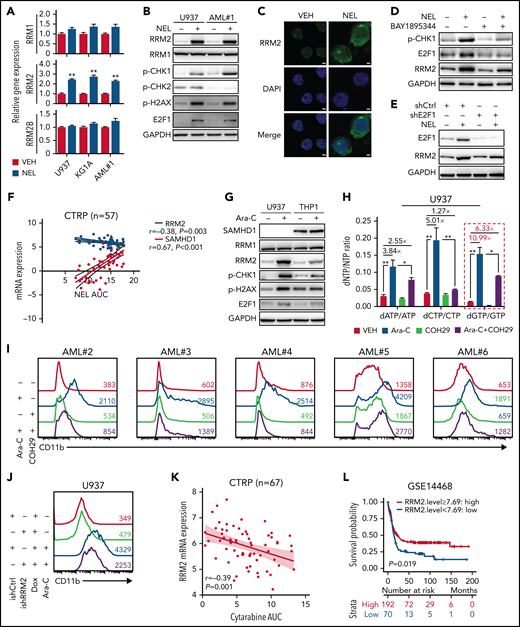
To define downstream pathway that conferred outcomes of dNTP imbalance, we assessed gene expression profiles in NEL or dG-treated AML cell lines (U937 and KG1A) by RNA-seq analyses (supplemental Tables 8-11). Ingenuity pathway analysis revealed Rho family GTPase signaling and ERK/MAPK signaling as top upregulated pathways in both treatments (Figure 5A-B). To validate whether these 2 pathways were effectors of RRM2 hyperactivation, we performed RNA-seq analyses of iRxI/AxA- and MOCK-THP1 cells after DOX treatment (supplemental Table 12). Gene set enrichment analysis revealed significant enrichment of RAS/ERK pathway signatures in iRxI/AxA-THP1 cells (Figure 5C), suggesting the role of ERK signaling as downstream of RRM2 hyperactivation. We further confirmed ERK activation after NEL, dG, or Ara-C treatment in AML cells (Figure 5D,F; supplemental Figure 5A). Of note, either iRxI/AxA OE or CCNF KD resulted in increased phospho-ERK in THP1 or primary AML specimens, respectively (Figure 5E,G; supplemental Figure 5B). To address the biological relevance of ERK activation, we established a U937 line with low basal ERK signaling using ERK2 shRNA. Although ERK2 knockdown slightly decreased cell growth relative to controls, it blocked NEL-induced growth inhibition effects (Figure 5H-I). We further injected U937 cells expressing either ERK2 shRNA or nontargeting control into NSGS mice and treated both groups with NEL. Relative to mice receiving ERK2-intact AML cells, mice receiving ERK2 KD cells showed less therapeutic responses following NEL treatment (Figure 5J-K). Moreover, pretreatment with ERK inhibitors to downregulate its basal signaling partially rescued the effects of NEL or dG treatment (supplemental Figure 5C-F), whereas long-term treatment of an ERK or MEK inhibitor alone eliminated AML CFC (supplemental Figure 5G), likely because of complete abrogation of ERK signaling.66,67
![ERK activation contributes to myeloid differentiation. (A-B) U937 or KG1A cells treated with or without NEL (10 µM, 24 hours) (A), with or without dG (10 µM, 24 hours) (B), were collected for RNA-seq analysis. Upregulated intracellular signaling pathways based on ingenuity pathway analysis (Z score > 0) were shown in both cell lines. ERK/MAPK pathway is highlighted in red. (C) Scattergrams of RAS GTPase-related gene sets (red) and Rho GTPase-related gene sets (black) based on enrichment analyses of differentially expressed genes in MOCK- and iRxl/AxA-THP1 cells after doxycycline induction. The color indicates the false discovery rate q values. NES, normalized enrichment score. (D) Western blot of phospho-ERK and total ERK levels in U937 cells treated with vehicle, NEL (10 µM) or dG (10 µM) for 24 hours. (E) Western blot of phospho-ERK and total ERK levels in MOCK- and iRxl/AxA-THP1 cells after doxycycline induction (i) and THP1 cells transduced with shCtrl or shCCNF lentivirus (ii). (F) Phospho-ERK levels in primary AML CD34+ cells from specimen AML#4 treated with vehicle, NEL (20 µM), Ara-C (0.5 µM), or dG (15 µM) for 24 hours. (G) Phospho-ERK levels in primary AML CD34+ cells from specimen AML#4 transduced with shCtrl or shCCNF lentivirus. (H) Western blot of the indicated proteins in U937 cells transduced with lentiviral vectors expressing shRNA against ERK2 (shERK2#1, shERK2#2 [chosen to be used further, namely shERK2]) or scramble control (shCtrl), followed by treatment with NEL (10 µM) for 24 hours. (I) Relative cell viability of U937 cells transduced with shCtrl, shERK2#1, or shERK2#2 lentivirus followed by treatment with NEL (10 µM) for 96 hours. Results represent mean ± SEM. **P < .01. (J-K) Representative CD11b expression (J) and percentages (K) of human CD45+ cells in BM of recipients (n = 6 per group) transplanted with shCtrl- or shERK2-U937 cells, followed by in vivo administration with vehicle (PBS) or NEL (217 mg/kg, IV, daily) for 7 days. For panel J, data from 1 representative mouse in each group are shown. For panel K, results represent mean ± SEM. *P < .05; **P < .01. (L) Transmission electron microscopy images of mitochondrial cristae in U937 cells treated with vehicle or dG (10 µM) for 24 hours. Scale bar, 1 µm (i) or 0.5 µm (ii). (M) Mitochondrial superoxide levels, phospho-ERK levels, CD11b expression levels, and relative cell viability of primary AML CD34+ cells from specimen AML#4 treated with vehicle, dG (15 µM), NAC (2 mM), or combination. Mitochondrial superoxide and phospho-ERK analyses were performed after treatment for 24 hours. CD11b expression and cell viability analyses were performed after treatment for 96 hours. For cell viability, results represent mean ± SEM. **P < .01. (N) A schematic diagram demonstrating the casual relationships among dNTP imbalance, mitochondrial ROS release, RAS/ERK hyperactivation, and differentiation/LSC maintenance. (O) Mac-1 expression levels in murine MA9+ and MA9/KrasG12D cells treated with vehicle or NEL (20 µM) for 96 hours. Results represent mean ± SEM. **P < .01. (P) Mac-1 expression levels in murine MA9/KrasG12D cells pretreated with SCH772984 (2 µM) for 6 hours, followed by treatment with NEL (20 µM) for 96 hours. Results represent mean ± SEM. **P < .01. (Q) Kaplan-Meier survival analysis of a cohort of patients with AML (GSE14468) carrying RAS mutations after dichotomization for RRM2 mRNA levels below (blue, n = 7) and above (red, n = 20) 7.69 log2-transformed intensity (P = .016). (R) Kaplan-Meier survival analysis of a cohort of patients with AML (GSE14468) carrying WT-RAS after dichotomization for RRM2 mRNA levels below (blue, n = 57) and above (red, n = 162) 7.69 log2-transformed intensity (P = .19).](https://ash.silverchair-cdn.com/ash/content_public/journal/blood/139/26/10.1182_blood.2021015108/3/m_bloodbld2021015108f5.png?Expires=1769267838&Signature=X3iRjattBM1kBNd3sdF5CxGpszKladp~aKJQdDjmvvViM1PHUtB-WziAxAIwyn1TBMbFIWfGgDXnftJ8YptgYJBDSJL8ytQE5sx2jRT6pAag8gNO~rbpe7xU91eURWp8vQ3xUrjgJW7bbHq8oWAl4VSDXuQVCmbk1RIJWlTe26Ek5Y7EH4VynzX5r8rKRhTQ8KAJmFHu3CK93j~G6bhzoFrcIOVKdAGHNSXHHjlfUsIbetuX4tXf7wVA5DClSl3a85~Vz8nreC2G3xNmyAth0us4zDJwym9vhIWJgWsXA-h7j-qBMNHNJNxo6geApEhWBlWGhbbmGOyXTIOVTPKOoQ__&Key-Pair-Id=APKAIE5G5CRDK6RD3PGA)
ERK activation contributes to myeloid differentiation. (A-B) U937 or KG1A cells treated with or without NEL (10 µM, 24 hours) (A), with or without dG (10 µM, 24 hours) (B), were collected for RNA-seq analysis. Upregulated intracellular signaling pathways based on ingenuity pathway analysis (Z score > 0) were shown in both cell lines. ERK/MAPK pathway is highlighted in red. (C) Scattergrams of RAS GTPase-related gene sets (red) and Rho GTPase-related gene sets (black) based on enrichment analyses of differentially expressed genes in MOCK- and iRxl/AxA-THP1 cells after doxycycline induction. The color indicates the false discovery rate q values. NES, normalized enrichment score. (D) Western blot of phospho-ERK and total ERK levels in U937 cells treated with vehicle, NEL (10 µM) or dG (10 µM) for 24 hours. (E) Western blot of phospho-ERK and total ERK levels in MOCK- and iRxl/AxA-THP1 cells after doxycycline induction (i) and THP1 cells transduced with shCtrl or shCCNF lentivirus (ii). (F) Phospho-ERK levels in primary AML CD34+ cells from specimen AML#4 treated with vehicle, NEL (20 µM), Ara-C (0.5 µM), or dG (15 µM) for 24 hours. (G) Phospho-ERK levels in primary AML CD34+ cells from specimen AML#4 transduced with shCtrl or shCCNF lentivirus. (H) Western blot of the indicated proteins in U937 cells transduced with lentiviral vectors expressing shRNA against ERK2 (shERK2#1, shERK2#2 [chosen to be used further, namely shERK2]) or scramble control (shCtrl), followed by treatment with NEL (10 µM) for 24 hours. (I) Relative cell viability of U937 cells transduced with shCtrl, shERK2#1, or shERK2#2 lentivirus followed by treatment with NEL (10 µM) for 96 hours. Results represent mean ± SEM. **P < .01. (J-K) Representative CD11b expression (J) and percentages (K) of human CD45+ cells in BM of recipients (n = 6 per group) transplanted with shCtrl- or shERK2-U937 cells, followed by in vivo administration with vehicle (PBS) or NEL (217 mg/kg, IV, daily) for 7 days. For panel J, data from 1 representative mouse in each group are shown. For panel K, results represent mean ± SEM. *P < .05; **P < .01. (L) Transmission electron microscopy images of mitochondrial cristae in U937 cells treated with vehicle or dG (10 µM) for 24 hours. Scale bar, 1 µm (i) or 0.5 µm (ii). (M) Mitochondrial superoxide levels, phospho-ERK levels, CD11b expression levels, and relative cell viability of primary AML CD34+ cells from specimen AML#4 treated with vehicle, dG (15 µM), NAC (2 mM), or combination. Mitochondrial superoxide and phospho-ERK analyses were performed after treatment for 24 hours. CD11b expression and cell viability analyses were performed after treatment for 96 hours. For cell viability, results represent mean ± SEM. **P < .01. (N) A schematic diagram demonstrating the casual relationships among dNTP imbalance, mitochondrial ROS release, RAS/ERK hyperactivation, and differentiation/LSC maintenance. (O) Mac-1 expression levels in murine MA9+ and MA9/KrasG12D cells treated with vehicle or NEL (20 µM) for 96 hours. Results represent mean ± SEM. **P < .01. (P) Mac-1 expression levels in murine MA9/KrasG12D cells pretreated with SCH772984 (2 µM) for 6 hours, followed by treatment with NEL (20 µM) for 96 hours. Results represent mean ± SEM. **P < .01. (Q) Kaplan-Meier survival analysis of a cohort of patients with AML (GSE14468) carrying RAS mutations after dichotomization for RRM2 mRNA levels below (blue, n = 7) and above (red, n = 20) 7.69 log2-transformed intensity (P = .016). (R) Kaplan-Meier survival analysis of a cohort of patients with AML (GSE14468) carrying WT-RAS after dichotomization for RRM2 mRNA levels below (blue, n = 57) and above (red, n = 162) 7.69 log2-transformed intensity (P = .19).
ERK activation contributes to myeloid differentiation. (A-B) U937 or KG1A cells treated with or without NEL (10 µM, 24 hours) (A), with or without dG (10 µM, 24 hours) (B), were collected for RNA-seq analysis. Upregulated intracellular signaling pathways based on ingenuity pathway analysis (Z score > 0) were shown in both cell lines. ERK/MAPK pathway is highlighted in red. (C) Scattergrams of RAS GTPase-related gene sets (red) and Rho GTPase-related gene sets (black) based on enrichment analyses of differentially expressed genes in MOCK- and iRxl/AxA-THP1 cells after doxycycline induction. The color indicates the false discovery rate q values. NES, normalized enrichment score. (D) Western blot of phospho-ERK and total ERK levels in U937 cells treated with vehicle, NEL (10 µM) or dG (10 µM) for 24 hours. (E) Western blot of phospho-ERK and total ERK levels in MOCK- and iRxl/AxA-THP1 cells after doxycycline induction (i) and THP1 cells transduced with shCtrl or shCCNF lentivirus (ii). (F) Phospho-ERK levels in primary AML CD34+ cells from specimen AML#4 treated with vehicle, NEL (20 µM), Ara-C (0.5 µM), or dG (15 µM) for 24 hours. (G) Phospho-ERK levels in primary AML CD34+ cells from specimen AML#4 transduced with shCtrl or shCCNF lentivirus. (H) Western blot of the indicated proteins in U937 cells transduced with lentiviral vectors expressing shRNA against ERK2 (shERK2#1, shERK2#2 [chosen to be used further, namely shERK2]) or scramble control (shCtrl), followed by treatment with NEL (10 µM) for 24 hours. (I) Relative cell viability of U937 cells transduced with shCtrl, shERK2#1, or shERK2#2 lentivirus followed by treatment with NEL (10 µM) for 96 hours. Results represent mean ± SEM. **P < .01. (J-K) Representative CD11b expression (J) and percentages (K) of human CD45+ cells in BM of recipients (n = 6 per group) transplanted with shCtrl- or shERK2-U937 cells, followed by in vivo administration with vehicle (PBS) or NEL (217 mg/kg, IV, daily) for 7 days. For panel J, data from 1 representative mouse in each group are shown. For panel K, results represent mean ± SEM. *P < .05; **P < .01. (L) Transmission electron microscopy images of mitochondrial cristae in U937 cells treated with vehicle or dG (10 µM) for 24 hours. Scale bar, 1 µm (i) or 0.5 µm (ii). (M) Mitochondrial superoxide levels, phospho-ERK levels, CD11b expression levels, and relative cell viability of primary AML CD34+ cells from specimen AML#4 treated with vehicle, dG (15 µM), NAC (2 mM), or combination. Mitochondrial superoxide and phospho-ERK analyses were performed after treatment for 24 hours. CD11b expression and cell viability analyses were performed after treatment for 96 hours. For cell viability, results represent mean ± SEM. **P < .01. (N) A schematic diagram demonstrating the casual relationships among dNTP imbalance, mitochondrial ROS release, RAS/ERK hyperactivation, and differentiation/LSC maintenance. (O) Mac-1 expression levels in murine MA9+ and MA9/KrasG12D cells treated with vehicle or NEL (20 µM) for 96 hours. Results represent mean ± SEM. **P < .01. (P) Mac-1 expression levels in murine MA9/KrasG12D cells pretreated with SCH772984 (2 µM) for 6 hours, followed by treatment with NEL (20 µM) for 96 hours. Results represent mean ± SEM. **P < .01. (Q) Kaplan-Meier survival analysis of a cohort of patients with AML (GSE14468) carrying RAS mutations after dichotomization for RRM2 mRNA levels below (blue, n = 7) and above (red, n = 20) 7.69 log2-transformed intensity (P = .016). (R) Kaplan-Meier survival analysis of a cohort of patients with AML (GSE14468) carrying WT-RAS after dichotomization for RRM2 mRNA levels below (blue, n = 57) and above (red, n = 162) 7.69 log2-transformed intensity (P = .19).
Severe dNTP imbalance reportedly impairs mitochondrial DNA replication,68,69 resulting in mitochondrial stress and release of reactive oxygen species (ROS), which leads to ERK activation.70 Accordingly, dG or NEL treatment caused disruption of mitochondrial matrix morphology and loss of mitochondrial cristae (Figure 5L; supplemental Figure 5H). Moreover, dG treatment increased mitochondrial superoxide, decreased mitochondrial membrane potential, and induced leakage of mitochondrial DNA into cytoplasm (Figure 5M; supplemental Figure 5I-K). Notably, addition of ROS scavenger N-acetyl cysteine (NAC) reversed mitochondria superoxide increase, dampened ERK activation, and partially rescued cellular outcome by dG treatment in AML cells (Figure 5M; supplemental Figure 5K-L), indicating that mitochondrial ROS release links dNTP imbalance to ERK activation (Figure 5N). Moreover, CD34+CD38− AML cells showed increased differentiation and reduced CFC after dG treatment, whereas these effects were partially rescued by NAC treatment (supplemental Figure 5M-N), suggesting that both differentiation and LSC impairment are downstream of mitochondrial dysfunction (Figure 5N).
Hyperactive RAS reportedly promotes commitment of differentiation through ERK hyperactivation.71-74 To determine whether oncogenic RAS cooperated with NEL-induced ERK activation to induce differentiation and growth inhibition, we used splenocytes from mice bearing conditional oncogenic Kras (KrasLox-Stop-Lox (LSL) G12D/+/Vav-Cre+),75,76 followed by Mll-AF9 transduction. Relative to Vav-Cre+ splenocytes transformed by MA9 alone, MA9/KrasG12D doubly transformed cells were more vulnerable to NEL-induced inhibitory effects (Figure 5O; supplemental Figure 5O). Notably, ERK inhibition partially rescued NEL’s effects on MA9/KrasG12D cells (Figure 5P; supplemental Figure 5P). We next asked whether RRM2 level predicted prognosis in patients carrying oncogenic RAS after Ara-C treatment, which also primed ERK signaling (Figure 5F; supplemental Figure 5A). To do so, we reanalyzed clinical outcomes of RAS mutant or RAS WT cases from the GSE14468 cohort containing sufficient RAS mutant cases.60 Indeed, high RRM2 level predicted longer survival for AML patients carrying RAS mutations, whereas in patients with WT RAS, RRM2 level was less predictive (Figure 5Q-R; supplemental Table 13).
Loss-of-function screen identified synthetic lethal interaction between DUSP6-KO and nelarabine treatment
Drug combination is desired to achieve maximal efficacy. To identify NEL-based combination therapy, we performed a genome-wide clustered regularly interspaced short palindromic repeats (CRISPR) screen in a U937 subline resistant to NEL (U937/R; Figure 6A). This subline (IC50 = 42.3 μM) was generated by gradual adaptation of parental cells (IC50 = 3.8 μM) to 50 µM NEL over months.77 After Cas9+ clonal derivation (supplemental Figure 6A), we transduced cells with GeCKO guide RNA (gRNA) library78 and treated with 20 µM NEL for 7 days to negatively enrich candidate gRNAs associated with drug response.79 Among the top hits, we identified NT5C2 to be significantly depleted in NEL-treated cells (supplemental Table 14), which encodes a nucleotidase reportedly to inactivate the active metabolites of purine analogs.80-83 Herein, given that NEL’s effects associated with ERK activation, and hyperactivation of ERK can be deleterious to cancer cells,84,85 we thus analyzed gRNAs targeting genes encoding those negative feedback regulators of ERK signaling84,85 (Figure 6B), including the dual-specificity phosphatases (DUSPs), the sprouty proteins, and the sprouty-related EVH1 domain-containing proteins.84,86 Among those genes, DUSP1 and DUSP6 were markedly depleted in NEL-treated vs vehicle-treated cells87 (Figure 6B; supplemental Table 14). Four of 6 gRNAs targeting DUSP6 were depleted in NEL-treated cells (supplemental Figure 6B). Given its higher abundancy than DUSP1 (supplemental Figure 6C) and its adaptive upregulation after short exposure to drug treatment (Figure 6C), we prioritized DUSP6 for further investigation.
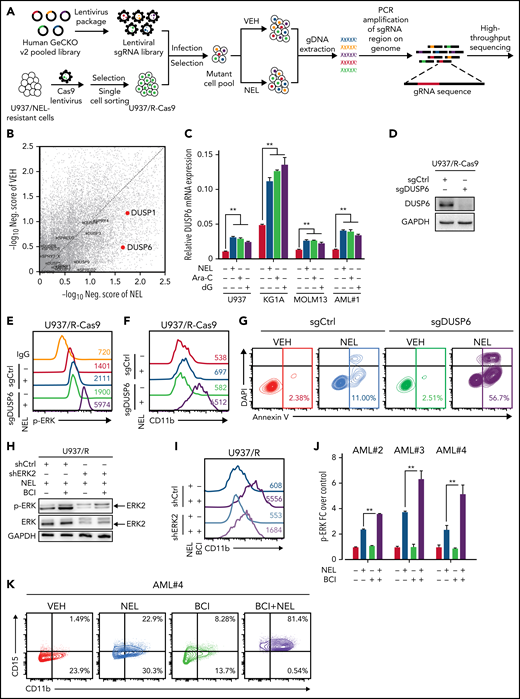
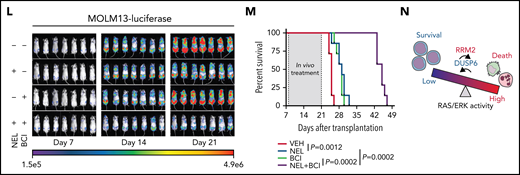
Loss-of-function screen identified synthetic lethal interaction between DUSP6-KO and nelarabine treatment. (A-B) Experimental design of genome-wide CRISPR/Cas9 screen for synthetic lethal partner of NEL treatment in NEL-resistant subline U937/R (A). Briefly, Cas9 expressing-U937/R cells were transduced with GeCKO gRNA library. After culturing for 7 days, cells were divided into 2 groups for treatment with vehicle or NEL (20 µM). After another 7 days of exposure, sgRNA representation was assessed by sequencing. The gene negative scores (B) were calculated using MAGeCK-MLE module. Reported ERK negative feedback regulators were labeled. The red dots represent preferential depletion of DUSP1 and DUSP6 sgRNAs following NEL treatment over vehicle control. (C) Relative DUSP6 expression levels in indicated AML cells treated with vehicle, NEL (10 µM for U937 and KG1A, 20 µM for MOLM13 and AML#1), Ara-C (0.5 µM), or dG (10 µM for U937 and KG1A, 15 µM for MOLM13 and AML#1) for 24 hours. Results represent mean ± SEM. **P < .01. (D) Western blot of DUSP6 proteins in U937/R-Cas9 cells transduced with lentiviral vectors expressing sgRNA against DUSP6 (sgDUSP6) or nontargeting control (sgCtrl). (E) Phospho-ERK levels in sgCtrl- or sgDUSP6-U937/R cells treated with vehicle or NEL (20 µM) for 24 hours. (F-G) CD11b expression levels (F) and apoptosis (G) of sgCtrl- or sgDUSP6-U937/R cells treated with vehicle or NEL (20 µM) for 96 hours. (H) Western blot of the indicated proteins in U937/R cells transduced with lentiviral vectors expressing shRNA against ERK2 (shERK2) or scramble control (shCtrl), followed by treatment with NEL (20 µM) alone or NEL (20 µM) plus BCI (1 µM) for 24 hours. (I) CD11b expression levels in shCtrl- or shERK2-U937/R cells treated with NEL (20 µM) alone or NEL (20 µM) plus BCI (1 µM) for 96 hours. (J) Relative phospho-ERK levels in primary AML CD34+ cells (n = 3) treated with vehicle, NEL (20 µM), BCI (1 µM), or combination for 24 hours. Data were normalized to vehicle-treated controls. Results represent mean ± SEM. **P < .01. (K) CD11b and CD15 expression levels in primary AML CD34+ cells from specimen AML#4 treated with vehicle, NEL (20 µM), BCI (1 µM), or a combination for 96 hours. (L-M) MOLM13-luciferase cells (1 × 10⁶ cells per mouse) were injected into sublethally irradiated NSGS mice. Following engraftment, mice were treated with vehicle (PBS), NEL (217 mg/kg, IV, daily), BCI (10 mg/kg, intraperitoneally, daily), or a combination for 2 weeks (n = 7 per group), assessed for engraftment by in vivo bioluminescence imaging (L) and monitored for survival (M). (N) A schematic model showing that the response to RRM2 hyperactivation-mediated dNTP imbalance depends on reaching a lethal threshold of RAS/ERK activity, and DUSP6 activity may antagonize this lethal effect.
Loss-of-function screen identified synthetic lethal interaction between DUSP6-KO and nelarabine treatment. (A-B) Experimental design of genome-wide CRISPR/Cas9 screen for synthetic lethal partner of NEL treatment in NEL-resistant subline U937/R (A). Briefly, Cas9 expressing-U937/R cells were transduced with GeCKO gRNA library. After culturing for 7 days, cells were divided into 2 groups for treatment with vehicle or NEL (20 µM). After another 7 days of exposure, sgRNA representation was assessed by sequencing. The gene negative scores (B) were calculated using MAGeCK-MLE module. Reported ERK negative feedback regulators were labeled. The red dots represent preferential depletion of DUSP1 and DUSP6 sgRNAs following NEL treatment over vehicle control. (C) Relative DUSP6 expression levels in indicated AML cells treated with vehicle, NEL (10 µM for U937 and KG1A, 20 µM for MOLM13 and AML#1), Ara-C (0.5 µM), or dG (10 µM for U937 and KG1A, 15 µM for MOLM13 and AML#1) for 24 hours. Results represent mean ± SEM. **P < .01. (D) Western blot of DUSP6 proteins in U937/R-Cas9 cells transduced with lentiviral vectors expressing sgRNA against DUSP6 (sgDUSP6) or nontargeting control (sgCtrl). (E) Phospho-ERK levels in sgCtrl- or sgDUSP6-U937/R cells treated with vehicle or NEL (20 µM) for 24 hours. (F-G) CD11b expression levels (F) and apoptosis (G) of sgCtrl- or sgDUSP6-U937/R cells treated with vehicle or NEL (20 µM) for 96 hours. (H) Western blot of the indicated proteins in U937/R cells transduced with lentiviral vectors expressing shRNA against ERK2 (shERK2) or scramble control (shCtrl), followed by treatment with NEL (20 µM) alone or NEL (20 µM) plus BCI (1 µM) for 24 hours. (I) CD11b expression levels in shCtrl- or shERK2-U937/R cells treated with NEL (20 µM) alone or NEL (20 µM) plus BCI (1 µM) for 96 hours. (J) Relative phospho-ERK levels in primary AML CD34+ cells (n = 3) treated with vehicle, NEL (20 µM), BCI (1 µM), or combination for 24 hours. Data were normalized to vehicle-treated controls. Results represent mean ± SEM. **P < .01. (K) CD11b and CD15 expression levels in primary AML CD34+ cells from specimen AML#4 treated with vehicle, NEL (20 µM), BCI (1 µM), or a combination for 96 hours. (L-M) MOLM13-luciferase cells (1 × 10⁶ cells per mouse) were injected into sublethally irradiated NSGS mice. Following engraftment, mice were treated with vehicle (PBS), NEL (217 mg/kg, IV, daily), BCI (10 mg/kg, intraperitoneally, daily), or a combination for 2 weeks (n = 7 per group), assessed for engraftment by in vivo bioluminescence imaging (L) and monitored for survival (M). (N) A schematic model showing that the response to RRM2 hyperactivation-mediated dNTP imbalance depends on reaching a lethal threshold of RAS/ERK activity, and DUSP6 activity may antagonize this lethal effect.
In U937/R cells, DUSP6 depletion potentiated NEL-induced ERK activation, differentiation, and apoptosis than did comparably treated DUSP6 WT cells (Figure 6D-G). To determine whether targeting DUSP6 would enhance NEL’s effects, we tested a small molecule inhibitor of DUSP6, 2-benzylidene-3-(cyclohexylamino)-1-Indanone hydrochloride (BCI).88 Analogously, the addition of BCI re-sensitized U937/R cells to NEL-induced ERK activation, differentiation, and apoptosis (supplemental Figure 6D-F), whereas those effects were partially blocked by ERK2 knockdown (Figure 6H-I; supplemental Figure 6G). Enhanced leukemia targeting effects by combination were also seen in primary AML cells (Figure 6J-K; supplemental Figure 6H). To assess outcomes in vivo, we used NSGS models xenografted with MOLM13 cells, because its sensitivity to NEL was comparable to those of most primary AML specimens (supplemental Figure 6I). Although NEL treatment alone had modest effects, the combination significantly alleviated leukemia burden (Figure 6L-M; supplemental Figure 6I), with a comparable survival benefit to that of standard chemotherapy (supplemental Figure 6K), suggesting the response to NEL depends on reaching a lethal threshold of ERK activity, and DUSP6 may antagonize that effect (Figure 6N).
Discussion
Our results highlight the importance of dNTP homeostasis in myeloid differentiation. We show that dNTP imbalance caused by RRM2 hyperactivation through either drug treatment or genetic manipulation overcomes the differentiation blockade. Specifically, dGTP level is most vulnerable to be perturbated. Accordingly, dG is most potent in inducing differentiation and LSC ablation among all dNs. We also note that SAMHD1 may underlie varying responses to dG treatment in AML cells; SAMHD1 KO in AML cells remarkably enhances dG or RRM2 OE-induced differentiation and self-renewal ablation (Figures 2M-N and 4L-O). Therefore, SAMHD1 may counteract dNTP pool changes initiated by drug treatment or RRM2 upregulation, lessening the cellular outcome.
Our study reveals a novel role of RRM2 in promoting AML differentiation. Specifically, treatment of NEL, Ara-C, or CPT induces RRM2 hyperactivation, in agreement with previous reports of increases in RNR subunit levels after replication stress.55 In particular, this drug-induced RNR activation leads to imbalanced dNTPs, in contrast with dNTP changes after allosteric RNR activation during cell cycling.42 One explanation for this discrepancy in dNTP outcomes could be the duration of RRM2 upregulation, which may determine the extent of RNR activation. Moreover, SAMHD1 determines the extent to which RNR is activated, given its restriction on Ara-CTP or Ara-GTP accumulation.89 Nevertheless, in SAMHD1-proficient AML cells, overexpression of a stable RRM2 mutant promotes tumor regression and impairs LSC self-renewal (Figure 4).
We identify augmented R-loop formation underlies differentiation induction by NEL treatment. R-loops specifically activate ATR signaling as previously reported.15,16 Consistently, both Ara-C62 and CPT90 reportedly trigger R-loop formation,91 whereas HU does not.16 These results highlight the role of R-loop–initiated DNA damage in promoting differentiation, whereas we do not exclude the possibility that other actions of these genotoxins (NEL, Ara-C) also serve as mechanisms of lethality (eg, incorporation into nascent DNA).
ERK is an important player in controlling hematopoietic cell activity.92 Complete repression of ERK signaling by MEK or ERK inhibitors causes lethality,66,67 whereas excessive ERK activation also compromises viability of cancer cells.84,85,93 Accordingly, our data extend the emerging concept that hyperactivation of ERK can be deleterious in the context of AML. Notably, RAS mutations predict a better therapeutic response in patients with AML treated with high-dose cytarabine74,94 but show resistance to a venetoclax-based regimen.72 Moreover, we provide a therapeutic strategy to further enhance ERK signaling in AML cells primed by NEL treatment through cotargeting DUSP6, thereby surpassing an ERK hyperactivation-related lethal threshold (Figure 6). The combination of BCI and NEL not only suppresses leukemogenesis in an AML xenograft model but exhibits better tolerability than standard chemotherapy (supplemental Figure 6J-L).
In conclusion, we show that disrupting dNTP pool homeostasis overcomes differentiation blockade of AML cells and impairs LSC self-renewal. Our study prompts a reappraisal of therapeutic response in patients with RAS-mutated AML with considerations of factors controlling dNTP homeostasis, such as RRM2 and SAMHD1. Finally, we provide a rationale for further evaluation of the combination of nelarabine with a DUSP6 inhibitor against AML.
Acknowledgments
The authors thank COH Comprehensive Cancer Center, as well as patients, donors, and their physicians for providing primary specimens for this study, Jianjun Chen for providing Cas9-expressing THP1 cells, Jan Rehwinkel at University of Oxford for constitutive Samhd1 KO mice, Dong-er Zhang at University of California, San Diego, for RNASEH1 vectors, Johanna Ten Hoeve at UCLA metabolomics center for assistance with metabolites measurements, and Stemcyte Inc. for the cord blood (CB) sample. The authors also thank Elise Lamar and Marjorie Robbin for help in manuscript editing and proofreading.
This work was supported in part by National Institutes of Health (NIH) grant R01 CA152108 and Department of Defense impact award CA190124 to J.Z., NIH grant R01 CA2062101 and Cancer Prevention & Research Institute of Texas grant DP150061 to S.T., and Gehr Family Center for Leukemia Research support to L.L. The authors acknowledge the support of the Animal Resources Center, Analytical Cytometry Core, Bioinformatics, Light Microscopy, Electron Microscopy, Integrative Genomics Core, Mass Spectrometry & Proteomic Core at COH Comprehensive Cancer Center, supported by the NIH, National Cancer Institute under award P30CA33572.
The content is solely the responsibility of the authors and does not necessarily represent official views of the NIH.
Authorship
Contribution: H.W. designed and performed experiments, interpreted results, and wrote the manuscript; X.H. designed and performed experiments including bioinformatic data mining, primer extension assay for dNTP measurements, immunofluorescence, and CRISPR-Cas9 screen, and reviewed the manuscript; Lei Zhang performed Western blot analyses and reviewed the manuscript; H.D. assisted with animal experiments and reviewed the manuscript; F.H. performed the CFC assay, Mll-AF9 retrovirus packaging and transduction, and animal experiments; J.X. performed flow cytometry analysis; M.L. performed statistical analyses; W.C. performed transcriptomic analyses; X.L. and K.V.P. performed quantitative MS analyses; W.H. assisted with flow cytometry analyses and animal experiments; Z.L. and Lianjun Zhang assisted with experiments; L.X.T.N. performed transmission electron microscopy experiments; L.Y. interpreted CRISPR screen results; L.F. reviewed RNA-seq results; D.J.G. provided ishRRM2/iRRM2-T33A constructs; J.Z. provided murine KrasG12D/+ splenocytes; A.S. provided AML samples; D.H. provided compound COH29; D.B.S. provided ER-HoxA9 cells; P.P., C.-W.C., Y.-H.K., G.M., S.T., H.J., and X.W. reviewed and edited the manuscript; and L.L. designed the study, interpreted data, and prepared the manuscript with input from others.
Conflict-of-interest disclosure: D.B.S. is a cofounder and holds equity in Clear Creek Bio, is a consultant and holds equity in SAFI Biosolutions, and is a consultant for Keros Therapeutics. The remaining authors declare no competing financial interests.
Correspondence: Ling Li, Department of Hematological Malignancies Translational Science, Gehr Family Center for Leukemia Research, Hematologic Malignancies and Stem Cell Transplantation Institute, Beckman Research Institute of City of Hope, Monrovia Research Center 2005, 1500 E. Duarte Rd, Duarte, CA 91010; e-mail: lingli@coh.org; Hongchuan Jin, Laboratory of Cancer Biology, Provincial Key Laboratory of Biotherapy in Zhejiang, Sir Run Run Shaw Hospital, Zhejiang University, 3 East Qingchun Rd, Hangzhou 310016, China; e-mail: jinhc@zju.edu.cn; and Xian Wang, Department of Medical Oncology, Sir Run Run Shaw Hospital, Zhejiang University, 3 East Qingchun Rd, Hangzhou 310016, China; e-mail: wangx118@zju.edu.cn.
RNA-Seq data are available at GEO under accession numbers GSE193832, GSE193721, and GSE193769.
The online version of this article contains a data supplement.
The publication costs of this article were defrayed in part by page charge payment. Therefore, and solely to indicate this fact, this article is hereby marked “advertisement” in accordance with 18 USC section 1734.

This feature is available to Subscribers Only
Sign In or Create an Account Close Modal