

Key Points
PI3Kδ/γ inhibitor added to CART cell cultures enriches yields of T-stem cell memory CD8+ CART cells.
Ex vivo PI3Kδ/γ inhibitor alters epigenetic pathways that endow CD28 and 41BB CART with greater in vivo expansion and antitumor activity.

Abstract
Current limitations in using chimeric antigen receptor T(CART) cells to treat patients with hematological cancers include limited expansion and persistence in vivo that contribute to cancer relapse. Patients with chronic lymphocytic leukemia (CLL) have terminally differentiated T cells with an exhausted phenotype and experience low complete response rates after autologous CART therapy. Because PI3K inhibitor therapy is associated with the development of T-cell–mediated autoimmunity, we studied the effects of inhibiting the PI3Kδ and PI3Kγ isoforms during the manufacture of CART cells prepared from patients with CLL. Dual PI3Kδ/γ inhibition normalized CD4/CD8 ratios and maximized the number of CD8+ T-stem cell memory, naive, and central memory T-cells with dose-dependent decreases in expression of the TIM-3 exhaustion marker. CART cells manufactured with duvelisib (Duv-CART cells) showed significantly increased in vitro cytotoxicity against CD19+ CLL targets caused by increased frequencies of CD8+ CART cells. Duv-CART cells had increased expression of the mitochondrial fusion protein MFN2, with an associated increase in the relative content of mitochondria. Duv-CART cells exhibited increased SIRT1 and TCF1/7 expression, which correlated with epigenetic reprograming of Duv-CART cells toward stem-like properties. After transfer to NOG mice engrafted with a human CLL cell line, Duv-CART cells expressing either a CD28 or 41BB costimulatory domain demonstrated significantly increased in vivo expansion of CD8+ CART cells, faster elimination of CLL, and longer persistence. Duv-CART cells significantly enhanced survival of CLL-bearing mice compared with conventionally manufactured CART cells. In summary, exposure of CART to a PI3Kδ/γ inhibitor during manufacturing enriched the CART product for CD8+ CART cells with stem-like qualities and enhanced efficacy in eliminating CLL in vivo.
Introduction
Chronic lymphocytic leukemia (CLL) is the most common leukemia in adults.1,2 Patients with CLL treated with Bruton’s tyrosine kinase inhibitors achieve progression-free survival (PFS) of 89% at ∼3 years with a complete response (CR) rate of 17%.3 Alternatively, the bcl-2 inhibitor venetoclax, in combination with anti-CD20 obinutuzumab, achieve a similar ∼3-year PFS of 88% with a CR rate of 50%.4 Low-risk patients treated with fludarabine, cyclophosphamide, and rituximab can achieve a CR of 44%.5,6 In summary, many patients with CLL progress through or are unable to tolerate the available options. Chimeric antigen receptor T (CART) cells generated from patients with CLL may lead to durable remissions for patients with relapsed/refractory CLL, but efficacy is limited because of T-cell senescence.7,8 A meta-analysis of 42 trials of anti-CD19 CART cells in hematologic malignancies showed a CR rate of 25% in patients with relapsed/refractory CLL, compared with a 54% CR rate in relapsed/refractory non-Hodgkin lymphoma and a 77% CR rate in relapsed/refractory acute lymphoblastic leukemia.9 Suppression of T-cell responses in CLL occurs through induction of antigen-driven T-cell exhaustion10,11 secondary to chronic exposure to viral12 or cancer-associated antigens,13 leading to an exhausted phenotype with increased expression of PD1,10 reduced expression of costimulatory molecules, and impaired formation of cytotoxic synapses.10,14,15 The basis for the altered effector T-cell function the changes in T-cell metabolism,8 as antigen-stimulated CD8+ T cells from patients with CLL become anergic/senescent16 with lower expression of PPAR-γ coactivator 1α (PGC1α), a regulator of mitochondrial biogenesis.8 The clinical efficacy of CART cell therapy increases with the infusion of more memory CD27+ CART cells7 containing more mitochondria.8
The current process for CART cell manufacturing promotes antigen-driven terminal differentiation17-20 yielding high frequencies of exhausted CART cells with reduced mitochondrial mass.14 In CLL, reduced in vivo efficacy of CLL donor-generated CART cells7 contributes to lower CR rates than are obtained with CART cells in other blood cancers.9,21 Multiple strategies for improving T-cell function in CLL are under investigation, including lenalidomide to enhance formation of T-cell immunologic cytotoxic synapses,22 pretreatment with ibrutinib,23 and allogeneic CLL-specific cytotoxic T lymphocytes generated from umbilical cord blood.24 Clinical use of PI3Kδ or dual-PI3Kδ/γ inhibitors (PI3Ki) in CLL can lead to T-cell–mediated autoimmunity including hepatotoxicity, pneumonitis, diarrhea/colitis, and rash.18,25 We have previously shown that idelalisib blocks terminal differentiation in T cells from patients with diffuse large B-cell lymphoma.26 We therefore hypothesized that PI3Ki may augment the function of CART cells in patients with CLL. We demonstrate herein that adding the dual-PI3Kδ/γ inhibitor duvelisib during manufacture of CART cells yields cells with an enhanced number of T-stem cell memory (TSCM), naive, and memory cells, normalized CD4/CD8 ratios, increased mitochondrial mass, and epigenetic modifications that correlate with enhanced antileukemia efficacy in vivo.
Methods
PBMC isolation and leukapheresis
This study involving humans was conducted in accordance with the Declaration of Helsinki. Peripheral blood mononuclear cells (PBMCs) were isolated from patients with CLL and healthy donors (IRB00057236 and IRB00046063) by Ficoll-Hypaque density-gradient centrifugation26 and cryopreserved in Cryostore CS10 buffer (Stemcell Technologies, Vancouver, Canada). Leukapheresis was performed on consenting healthy volunteers (IRB00010018) as described in supplemental Methods (available on the Blood Web site). CLL donors had a mean age of 66 years and male predominance (supplemental Table 1).
T-cell activation and expansion
All T-cell or CART cell cultures were initiated from cells cryopreserved in liquid nitrogen. Frozen cells were thawed and rested at 37°C in medium in a 5% CO2 humidified incubator for 6 hours in complete RPMI medium.26 The T cells were enriched by using a CD3− selection kit (Miltenyi, Bergisch Gladbach, Germany) before ethidium bromide/acridine orange staining (Sigma, St Louis, MO) and counting on a hemocytometer. Anti-CD3/CD28 bead stimulation was performed (ThermoFisher-Dynabeads, Waltham, MA) at a 1:1 bead/cell ratio. Recombinant human interleukin-1 (IL-2; 30 U/mL; R&D Systems, Minneapolis, MN) and duvelisib (MedChem Partners, Lexington, MA), idelalisib (Selleck Chemicals, Houston, TX), or dimethyl sulfoxide (DMSO; VWR, Radnor, PA) was added every 3 days, as described.26 Cells were cultured in 24-well G-Rex plates with a 2 cm2 gas-permeable area (Wilson Wolf, St Paul, MN) and restimulated with a 1:1 cell/bead ratio on day 9 with anti-CD3/CD28 beads. The final DMSO concentration was ≤0.1%.
Transduction with anti-CD19 CAR
Anti-CD19 CAR lentivirus containing intracellular domains of CD28 and CD3 was generated as described,27,28 and anti-CD19 4-1BB lentivirus was purchased (Creative Biolabs, Shirley, NY) and stored at 1 × 108,9 transducing units per milliliter at −80°C. Peripheral blood mononuclear cells from patients with CLL and healthy donors were sorted for CD3+ cells and activated using anti-CD3/CD28 beads in control or PI3Ki-containing medium. Twenty-four hours later, the cells were transduced with anti-CD19 CAR lentiviral vector in the presence of 6 μg/μL polybrene and a multiplicity of infection of 30 to 50 in 250 μL. Transduction efficiency was determined by flow cytometry through detection of GFP or CD19 recombinant protein (Miltenyi). The cells were expanded for 3 to 15 days before analysis.
Phenotypic characterization of expanded CART cells
Flow cytometry, mass cytometry, western blots, transmission electron microscopic analysis, and NanoString analysis of cultured T cells were performed according to the descriptions in supplemental Methods.
Seahorse analysis
T-cells were harvested on day 9 of culture, 90 minutes after restimulation per the methods used for western blot analysis. Live T cells (4 × 10⁵ per replicate or sample) were suspended in Agilent Seahorse XF Base Medium supplemented with 1 mM pyruvate, 2 mM glutamine, and 10 mM glucose (pH 7.4). The cells were plated in Seahorse cell culture plates precoated with Cell-Tak (Corning, Corning, NY). Reagents and products for the Seahorse assay were purchased from Agilent (Santa Clara, CA). OCR was measured by using the Mito Stress test protocol after injections of oligomycin (2.5 μM), carbonyl cyanide p-trifluoromethoxyphenyl hydrazone (0.5 μM), antimycin, and rotenone (2 μM each) on an Agilent Seahorse XF24 bioenergetics analyzer.29 Results were analyzed with Seahorse Wave Controller Software. OCR data were normalized by live cell counts in each sample at the time of plating.
Flow cytometry and in vitro cytotoxicity
Day 9-to-15–cryopreserved CART cells were rested as described. OSU-CLL (Ohio State University-CLL) cells were labeled with VPD450 dye (BD, Franklin Lakes, NJ). CART cells and Duv-CART cells were stained separately or mixed with OSU-CLL cells for 14 hours at 2:1, 1:1, and 1:2 effector (CART)-to-target (OSU-CLL) ratios, with or without added duvelisib or 0.1% DMSO, respectively. Fluorescence-labeled CART and target cells were analyzed on a FACSymphony or AriaII cytometer (BD), as described in supplemental Methods. The percentage of specific lysis was calculated per Martinez et al.30
In vivo models
The in vivo experiments were approved by Emory University’s Institutional Animal Care and Use Committee (201700471). NOD.Cg-Prkdcscid IL2rγtm1Sug/JicTac (NOG) mice (Taconic Biosciences, Albany, NY) were engrafted with OSU-CLL after tail-vein injection. The mice were randomly assigned to groups with equivalent mean tumor burdens before administration of CART cells by tail-vein injection 7 to 15 days after CLL injection. End points for euthanasia included development of paresis or severe eczema. Frequencies of CART cells, T cells, and OSU-CLL cells in the blood were measured by flow cytometry. Spleen and bone marrow analyses were performed by the Emory Cancer Tissue and Pathology Core.
Results
T-cells from untreated, early-stage patients with CLL have a senescent phenotype
We previously reported that T cells lacking expression of CD27/CD28 are senescent and do not proliferate after T-cell receptor (TCR)–mediated stimulation.26 Because CD27+CD8+ CART-cell subsets positively correlate with remissions in CLL,7,14 we characterized the differentiation status and expression of costimulatory molecules on T cells in treatment-naive patients with Rai stage 0 or 1 CLL.31 CD8+ T cells comprised a mean of 28% of the total CD3+ population (supplemental Table 1) with significant reductions in frequencies of naive CD8+ (P = 9.3 × 10⁻⁵) and naive CD4+ (P = 1.3 × 10⁻⁵) T cells in patients with CLL, relative to healthy donors. Notably, patients with CLL have fewer CD27+CD28+CD8+ and CD27+CD28+CD4+ T cells (Figure 1A), with 51% of CD8+ T cells lacking either CD27 or CD28 (Figure 1A). Previous work7 retrospectively demonstrated that a threshold frequency of ≥29% of the peripheral CD8+ T cells with the phenotype CD27+CD45RO− before manufacture of CART cells predicted CR. T cells from 100% of healthy volunteers exceeded the ≥29% threshold of (CD27+CD45RO−) T cells expressing CD8+, whereas only 45% of patients with CLL of Rai stages 0 and 1 exceeded this threshold (P = .0016; Figure 1B).7 Thus, efficacy of CART therapy in CLL is limited by T-cell senescence.
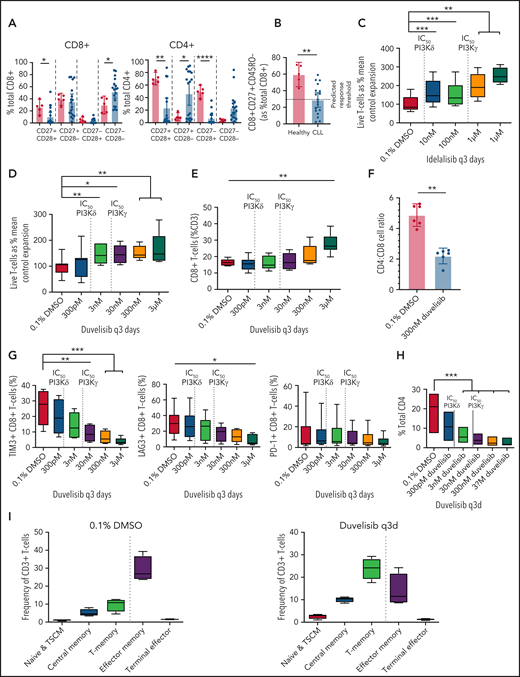
Culture with PI3Kis increased the frequencies of CD8+ naive and memory T cells and decreased the frequencies of senescent CD8+ T cells from untreated patients with CLL. Mononuclear cells collected from CLL donors were analyzed by flow cytometry. Cryopreserved cells were thawed, and T cells were isolated and expanded for 9 days with duvelisib or idelalisib added to the culture medium every 3 days (q3d). (A) T cells from healthy donors (n = 5) and patients with CLL (n = 18) assessed by flow cytometry for expression of costimulatory molecules (CD27 and CD28) on the CD8+ and CD4+ subsets. (B) The frequencies of CD8+CD27+CD45RO− T cells in patients with CLL compared with healthy controls. The dashed line indicates the threshold frequency of CD8+ naive T-cells previously associated with complete remission in patients with CLL treated with CD19-targeted CART cells.7 In vitro expansion of T cells from patients with CLL (n = 8) cultured with idelalisib (C) and duvelisib (D), with the 50% inhibitory concentration (IC50) for PI3Kδ and PI3Kγ shown as vertical dashed lines. Flow cytometric analysis of the frequency of CD8+ T cells (E) and CD4/CD8 T-cell ratios (F) in duvelisib-containing and control T-cell cultures. (G) Expression of the immune checkpoint molecules TIM3, LAG3, and PD1 on the CD8+ T cells. (H) Frequency of TIM3 on the CD4+ T-cell subset. LAG3 and PD1 yielded no significant changes and are not shown on the CD4+ subset. (I) Distribution of T cells according to naive and memory phenotypes in control and duvelisib-containing cultures. T-cell populations were defined as follows: naive and TSCM (CD45RA+CD45RO−CCR7+), central memory (CD45RA−CD45RO+CCR7+), T-memory and effector memory (CD45RA−CD45RO+CCR7−), and terminal effector cells (CD45RA+CD45RO−CCR7−). *P < .05; **P ≤ .01; ***P ≤ .001; ****P ≤ .0001.
Culture with PI3Kis increased the frequencies of CD8+ naive and memory T cells and decreased the frequencies of senescent CD8+ T cells from untreated patients with CLL. Mononuclear cells collected from CLL donors were analyzed by flow cytometry. Cryopreserved cells were thawed, and T cells were isolated and expanded for 9 days with duvelisib or idelalisib added to the culture medium every 3 days (q3d). (A) T cells from healthy donors (n = 5) and patients with CLL (n = 18) assessed by flow cytometry for expression of costimulatory molecules (CD27 and CD28) on the CD8+ and CD4+ subsets. (B) The frequencies of CD8+CD27+CD45RO− T cells in patients with CLL compared with healthy controls. The dashed line indicates the threshold frequency of CD8+ naive T-cells previously associated with complete remission in patients with CLL treated with CD19-targeted CART cells.7 In vitro expansion of T cells from patients with CLL (n = 8) cultured with idelalisib (C) and duvelisib (D), with the 50% inhibitory concentration (IC50) for PI3Kδ and PI3Kγ shown as vertical dashed lines. Flow cytometric analysis of the frequency of CD8+ T cells (E) and CD4/CD8 T-cell ratios (F) in duvelisib-containing and control T-cell cultures. (G) Expression of the immune checkpoint molecules TIM3, LAG3, and PD1 on the CD8+ T cells. (H) Frequency of TIM3 on the CD4+ T-cell subset. LAG3 and PD1 yielded no significant changes and are not shown on the CD4+ subset. (I) Distribution of T cells according to naive and memory phenotypes in control and duvelisib-containing cultures. T-cell populations were defined as follows: naive and TSCM (CD45RA+CD45RO−CCR7+), central memory (CD45RA−CD45RO+CCR7+), T-memory and effector memory (CD45RA−CD45RO+CCR7−), and terminal effector cells (CD45RA+CD45RO−CCR7−). *P < .05; **P ≤ .01; ***P ≤ .001; ****P ≤ .0001.
PI3Kδ/γ inhibition increased yields of T cells from healthy donors
We next tested the effects of PI3Kδ-selective and dual-PI3Kδ/γ inhibition on T cells from healthy donors by adding graded amounts of idelalisib (PI3Kδ selective) or duvelisib (PI3Kδ,γ dual inhibitor) during culturing. Dose-dependent fourfold increases in the mean number of viable T cells were observed for idelalisib (supplemental Figure 1D) and duvelisib (supplemental Figure 1F). The maximal stimulatory effect of either PI3Ki was seen at doses predicted to inhibit both PI3Kδ and PI3Kγ.32 Addition of PI3Ki led to a dose-dependent increase in the expression of Fas and Fas-L (supplemental Figure D), leading us to hypothesize that PI3Ki prevents PI3K-mediated apoptosis through Fas signaling.33 In contrast, adding ibrutinib, a Bruton’s tyrosine kinase– and IL-2–inducible kinase inhibitor, did not increase the number of T cells (supplemental Figure 1A) and significantly decreased CD8+ T-cell frequencies (mean decrease, 7.9% vs 26% control; data not shown). Combining duvelisib and ibrutinib in T-cell cultures from patients with CLL led to a decreased number of total and CD8+ T cells (supplemental Figure 1G).
PI3K inhibitors promote dose-dependent decreases in exhaustion markers for T cells of patients
T cells from untreated CLL donors in our study expanded less than those of healthy donors. T cells from patients with CLL have been reported to exhibit decreased signaling of AKT, a downstream target of PI3Kδ and PI3Kγ, suggesting decreased TCR and costimulatory signaling in CLL T cells.16 Accordingly, western blots of healthy and CLL donor T-cells confirmed that CLL T cells had reduced phosphorylation of AKT after anti-CD3/CD28 bead activation (supplemental Figure 2A). Addition of duvelisib or idelalisib to ex vivo CLL T-cell cultures led to a mean 150% increase in the number of T cells (Figure 1C-D). The addition of duvelisib and idelalisib at concentrations sufficient for dual-PI3Kδ/γ antagonism led to a dose-dependent increased frequency of CD8+ T cells (Figures 1E; supplemental Figure 2B), decreasing the CD4/CD8 ratio from 4.96 to 2.37 (P = .0001; Figure 1F). A dose-dependent decrease in TIM-3 (P = .00) and LAG-3 (P = .01) was seen in the CD8+ subset (Figure 1G) and for TIM3 in the CD4+ subset (P = .0005; Figure 1H). Standard culture led to effector T-cell preponderance, whereas addition of duvelisib preserved naive and memory cells (Figure I). Based on the dose-response data, 300 nM duvelisib was selected for further study because it is a dual-PI3Kδ/γ inhibitor at in vitro and clinically attainable doses,32 whereas idelalisib is PI3Kδ selective at clinically tolerable doses.34
PI3K inhibition enriches CD8+ TSCM cells and promotes Th1 polarization
T cells of patients with CLL were purified from blood by negative selection, activated, transduced with an anti-CD19 CAR encoding lentiviral vector with a CD28 costimulatory domain, (supplemental Figure 3A), and cultured with or without 300 nM duvelisib, to yield either control CART cells or duvelisib-cultured CART cells (Duv-CART cells) that were analyzed by mass cytometry. Addition of duvelisib to cultures of CLL T cells increased the frequency of CD8+ cells and, intriguingly, despite its known inhibition of T-regulatory cells (supplemental Figure 4), increased the frequency of FOXP3+ cells (Figure 2A), of which some lacked CD25 expression and others were CD8+. Conventional flow cytometry of 11 CART cell samples showed that duvelisib decreased frequencies of conventionally defined T-regulatory cells defined as CD4+CD25+FOXP3+ (supplemental Figure 4A). Further, duvelisib decreased interferon-γ in the CD8+ subset and decreased granzyme B and perforin in the CD4+ subset (supplemental Figure 4D). Reductions in TIM3 and LAG3 expression were observed in duvelisib-treated T cells from 3 donors (Figure 2A), and duvelisib enriched expression of CD95, predominantly in the CD8+ subset (Figure 2A) consistent with increased TSCM.
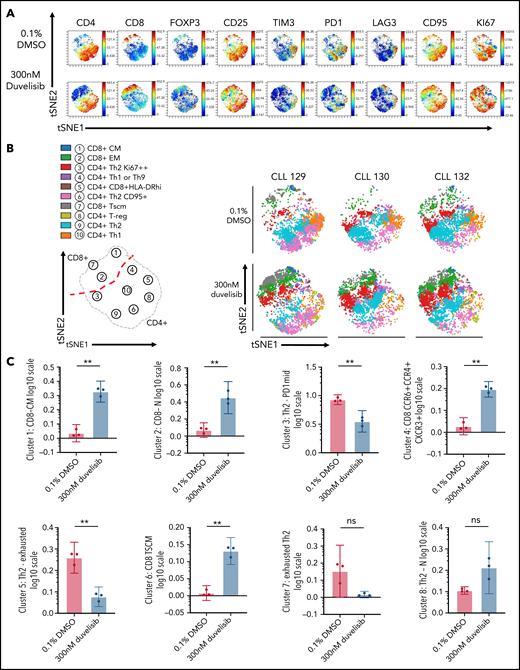
Duvelisib added during CART cell culture enriched CD8+ TSCM, naive, and central memory CD8+ CART cells and modulated CD4+ T helper cell polarization. Isolated CD3+T-cells from 3 patients with CLL were transduced with anti-CD19 CAR using a multiplicity of infection of 30 and cultured for 14 days, with or without 300 nM duvelisib, to yield control CART cells and Duv-CART cells. Mass cytometry by time of flight analysis was performed, and tSNE was used to reduce all phenotypic data into 2 dimensions, tSNE1 and tSNE2. (A) A representative viSNE plot from 1 of the 3 CLL samples analyzed. (B) Unsupervised FlowSOM showing 10 qualitative clusters. Changes in the size of a given cluster denote differences between control CART cells (0.1% DMSO) and Duv-CART cells. Th1 was defined as CD4+CXCR3+ and Th2 as GATA3+CXCR4+. (Confirmatory cytokine expression studies were not performed.) (C) Differences in levels of CART cell phenotypes assessed by CITRUS analysis. **P ≤ .01; ns, not significant. tSNE, t-distributed stochastic neighbor embedding; viSNE, visualization SNE.
Duvelisib added during CART cell culture enriched CD8+ TSCM, naive, and central memory CD8+ CART cells and modulated CD4+ T helper cell polarization. Isolated CD3+T-cells from 3 patients with CLL were transduced with anti-CD19 CAR using a multiplicity of infection of 30 and cultured for 14 days, with or without 300 nM duvelisib, to yield control CART cells and Duv-CART cells. Mass cytometry by time of flight analysis was performed, and tSNE was used to reduce all phenotypic data into 2 dimensions, tSNE1 and tSNE2. (A) A representative viSNE plot from 1 of the 3 CLL samples analyzed. (B) Unsupervised FlowSOM showing 10 qualitative clusters. Changes in the size of a given cluster denote differences between control CART cells (0.1% DMSO) and Duv-CART cells. Th1 was defined as CD4+CXCR3+ and Th2 as GATA3+CXCR4+. (Confirmatory cytokine expression studies were not performed.) (C) Differences in levels of CART cell phenotypes assessed by CITRUS analysis. **P ≤ .01; ns, not significant. tSNE, t-distributed stochastic neighbor embedding; viSNE, visualization SNE.
Unsupervised analysis using FlowSOM (self-organizing mapping) metaclustering revealed a qualitative increase in CD8+ TSCM (CD45RAintCD45ROintCD27+CD28+CD95+) T cells and effector memory CD8+ T cells in duvelisib-treated cultures of T cells from patients with CLL (Figure 2B), with similar results observed for healthy donors (supplemental Figure 5). Duvelisib increased the frequencies of effector memory CD8+ cells (green), proliferating Th2 cells, and naive Th1/Th9 cells, and decreased exhausted Th1 cells in CART cells from patients with CLL (Figure 2B) and healthy donors (supplemental Figure 5A).
The results from FlowSOM metaclustering were confirmed using the cluster identification, characterization, and regression (CITRUS) algorithm. Duvelisib led to significant changes in frequencies of 6 distinct populations in CLL CART (Figure 2C), and changes in 4 populations of healthy volunteer CART cells (supplemental Figure 3C). Striking increases in CD8+CD27+CD45RO− T cells that are associated with achieving complete remissions using CART cell therapy in patients with CLL7,35 were seen in duvelisib-treated cultures (Figure 2C; supplemental Figure 5C).
Duv-CART cells show enhanced in vitro cytotoxicity despite a memory phenotype
The addition of duvelisib during the manufacture of CART cells had minimal effects on the number of CART cells (Figure 3A) or transduction efficiency (Figure 3B), but significantly increased the frequencies of CD8+ CART cells, normalizing the CD4/CD8 CART-cell ratio (Figure 3C). Duvelisib-cultured CART cells (n = 8) had a significantly higher frequency and absolute number of naive CD8+CD27+CD45RO− T cells (Figure 3D) and central memory CD4+ T cells (Figure 3E) relative to control cultures. Duv-CART cells had significantly reduced TIM3 expression on the CD4+ and CD8+ T-cell subsets without significant changes in expression of PD1 compared with control CART cells (Figure 3F). LAG3+CD8+ Duv-CART cells significantly increased compared with control CART cells during expansion with duvelisib (Figure 3F). Duv-CART cells had enhanced cytotoxicity against human OSU-CLL cells across all tested effector/target ratios compared with control CART cells (Figure 3G). We tested whether the apparent increases in cytotoxicity were due to an increased number of CD8+ T cells or to an increase in per-cell cytotoxicity. Data from Figure 3G were reanalyzed according to the number of CD8+ T cells in the mixtures of effectors and CLL cells (Figure 3H), and sorted CD8+ CART cells were added to target cells at defined ratios (Figure 3I). The data showed equivalent per-cell cytotoxicity in duvelisib compared with conventional CART cells and that the enhanced cytotoxicity of Duv-CART cells correlated with increasing CD8+ CART cell content.

Duv-CART cells had lower expression of immune checkpoint molecules and enhanced antileukemia activity against OSU-CLL cells. Control CART cells and Duv-CART cells from 8 patients with CLL were cultured as described in Figure 2. Number of CART cells (A) and transduction efficiency (B). (C) yields of CD8+CART cells and CD4/CD8 CART-cell ratios in duvelisib vs control cultures. (D) Absolute number of naive CD27+CD45RO−CD8+ CART cells. (E) Frequencies of CD8+ naive and CD4+ central memory CART-cell phenotypes. (F) Expression of TIM3, LAG3, and PD1 on CD4+ and CD8+ subsets of CART cells. (G) Cytotoxicity of control and Duv-CART cells (effectors) from 4 of the patient CLL samples against OSU-CLL cells (targets) at effector-to-target ratios of 0.5:1, 1:1, and 2:1. Duv-CART dells were tested before (with duvelisib) and after (washed) washing to remove residual duvelisib from the reaction mixture. (H) Data from panel G were analyzed to show CD8 effector-to-target ratios and percentage of specific cell lysis. (I) CD8+ control CART and Duv-CART cells were sorted (n = 4 donors) and added to target cells at defined ratios. *P < .05; **P ≤ .01; ***P ≤ .001; ****P ≤ .0001.
Duv-CART cells had lower expression of immune checkpoint molecules and enhanced antileukemia activity against OSU-CLL cells. Control CART cells and Duv-CART cells from 8 patients with CLL were cultured as described in Figure 2. Number of CART cells (A) and transduction efficiency (B). (C) yields of CD8+CART cells and CD4/CD8 CART-cell ratios in duvelisib vs control cultures. (D) Absolute number of naive CD27+CD45RO−CD8+ CART cells. (E) Frequencies of CD8+ naive and CD4+ central memory CART-cell phenotypes. (F) Expression of TIM3, LAG3, and PD1 on CD4+ and CD8+ subsets of CART cells. (G) Cytotoxicity of control and Duv-CART cells (effectors) from 4 of the patient CLL samples against OSU-CLL cells (targets) at effector-to-target ratios of 0.5:1, 1:1, and 2:1. Duv-CART dells were tested before (with duvelisib) and after (washed) washing to remove residual duvelisib from the reaction mixture. (H) Data from panel G were analyzed to show CD8 effector-to-target ratios and percentage of specific cell lysis. (I) CD8+ control CART and Duv-CART cells were sorted (n = 4 donors) and added to target cells at defined ratios. *P < .05; **P ≤ .01; ***P ≤ .001; ****P ≤ .0001.
Duvelisib modulates CART cell mitochondrial fusion and epigenetic regulation
NanoString gene expression analysis of metabolic pathways modulated by the addition of duvelisib during CART manufacturing identified 102 gene transcripts exceeding Benjamini-Hochberg false-discovery thresholds. Analysis of 10 genes with the largest changes in messenger RNA (Figure 4A) showed that duvelisib upregulated TCR and costimulatory molecule signaling pathways (Figure 4B), driven primarily by increases in CD8, LAT, and CD28, with a compensatory decrease in CD40L (Figure 4A). Duvelisib-cultured T cells had increased signaling through the MAPK (higher MAPK8 and MAP3K12 and lower ATF4) and NF-κΒ (higher LAT and LTB and lower CD40L) pathways and increased cytokines relevant to T-cell proliferation and cytotoxicity (Figure 4B). As expected, duvelisib blocked phosphorylation of AKT and decreased phosphorylation of S6 but increased phosphorylation of MEK1/2 and extracellular signal-regulated kinase 1/2 (ERK1/2) (Figure 4C), suggesting compensatory pathways for proliferation signals.
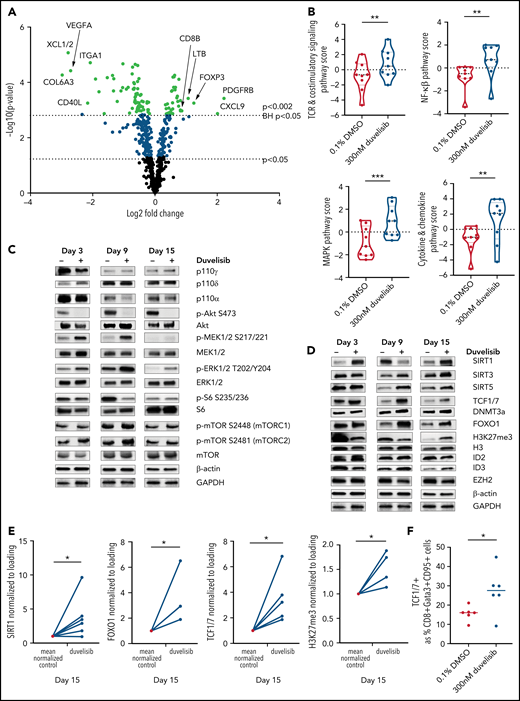
PI3K inhibition during T-cell culture–enhanced TCR and MEK/ERK signaling with alterations in epigenetic regulators that promote T-cell stemness. T cells from patients with CLL (n = 9) were cultured with or without 300 nM duvelisib administered to cultures every 3 days and were harvested after 3, 9, or 15 days of culture. Cells were stimulated with anti-CD3/CD28 beads on days 1 and 9 of culture, with day-9 samples harvested 90 minutes after restimulation with anti-CD3/CD28 beads and addition of duvelisib. Hypothesis-generating NanoString analysis was first performed and followed-up by confirmatory western blot experiments. (A) Differential expression of metabolically relevant genes in duvelisib-cultured cells compared with control cells at day 9 of culture. Changes in messenger RNA levels for 102 genes met Benjamini-Hochberg (BH) false-discovery thresholds (red). The 5 genes with the greatest fold increase or decrease are labeled. (B) Pathway scores based on gene expression levels for TCR, costimulatory, MAPK and mTOR signaling pathways. Western blot of cell lysates probing proteins related to proliferative pathways (C) and epigenetic regulatory pathways (D). Quantifications of select western blots (SIRT1, FOXO1, and TCF1/7) normalized to control (E) with ancillary flow cytometric analysis of frequencies of TCF1/7 expressing cells (F) at day 15 of culture. Results reproduced across 3 patients with CLL with quantitative results shown in the supplemental Data (supplemental Figure 5). *P < .05; **P ≤ .01; ***P ≤ .001.
PI3K inhibition during T-cell culture–enhanced TCR and MEK/ERK signaling with alterations in epigenetic regulators that promote T-cell stemness. T cells from patients with CLL (n = 9) were cultured with or without 300 nM duvelisib administered to cultures every 3 days and were harvested after 3, 9, or 15 days of culture. Cells were stimulated with anti-CD3/CD28 beads on days 1 and 9 of culture, with day-9 samples harvested 90 minutes after restimulation with anti-CD3/CD28 beads and addition of duvelisib. Hypothesis-generating NanoString analysis was first performed and followed-up by confirmatory western blot experiments. (A) Differential expression of metabolically relevant genes in duvelisib-cultured cells compared with control cells at day 9 of culture. Changes in messenger RNA levels for 102 genes met Benjamini-Hochberg (BH) false-discovery thresholds (red). The 5 genes with the greatest fold increase or decrease are labeled. (B) Pathway scores based on gene expression levels for TCR, costimulatory, MAPK and mTOR signaling pathways. Western blot of cell lysates probing proteins related to proliferative pathways (C) and epigenetic regulatory pathways (D). Quantifications of select western blots (SIRT1, FOXO1, and TCF1/7) normalized to control (E) with ancillary flow cytometric analysis of frequencies of TCF1/7 expressing cells (F) at day 15 of culture. Results reproduced across 3 patients with CLL with quantitative results shown in the supplemental Data (supplemental Figure 5). *P < .05; **P ≤ .01; ***P ≤ .001.
Duvelisib also changed the levels of epigenetic regulators, with increases in ATXN7 and KMT2A (data not shown), which led us to a broader investigation of epigenetics. At culture day 15, duvelisib increased levels of SIRT1 (Figure 4D-E), increased FOXO1 (Figure 4D-E), and increased TCF1/7 expression (Figure 4D-E). Increases in TCF1/7 were confirmed by flow cytometry of additional donor T cells (Figure 4F). Increased methylation of H3K27 in CART was observed on day 15 of culture (Figure 4E). Collectively, these results show that duvelisib exposure induced epigenetic changes consistent with a more stemlike phenotype that has been associated with enhanced proliferative capacity.36-38
Duvelisib increases CART-cell mitochondrial fusion
Previous work reported an association of increased mitochondria with increased T-cell fitness.39 We measured mitochondrial content by staining with nonyl-acridine orange (NAO), which binds cardiolipin in mitochondrial membranes.40 The addition of either idelalisib or duvelisib to T-cell cultures doubled the median fluorescence intensity of NAO emission on CD4+ and CD8+ T-cell subsets at culture day 9 (Figure 5A). To directly visualize mitochondrial content, transmission electron microscopic images of nontransduced, control CART, and Duv-CART cells generated from patients with CLL were obtained after 3, 9, and 14 to 15 days of culture (Figure 5B). Duvelisib treatment led to decreased T-cell size at all time points (Figure 5C) with significant decreases in total T-cell cross-sectional area (Figure 5D) by day 14. A 1.45-fold increase in mitochondrial cross-sectional area relative to total T-cell cross-sectional area was observed in Duv-CART cells, which imputes a 175% increase in mitochondrial volume for Duv-CART cells relative to control CART cells (P = .0013; Figure 5E), but no difference in the number of mitochondria. Protein levels of mitochondrial fusion proteins MFN1 and MFN2 were increased, while activation of mitochondrial fission, p-DRP1, was decreased (Figure 5F). However, despite increased mitochondrial content, Seahorse Metabolic Flux analysis at normoxic conditions showed no significant differences in oxygen consumption rate (OCR; Figure 5G) in duvelisib-exposed nontransduced T cells vs the control.
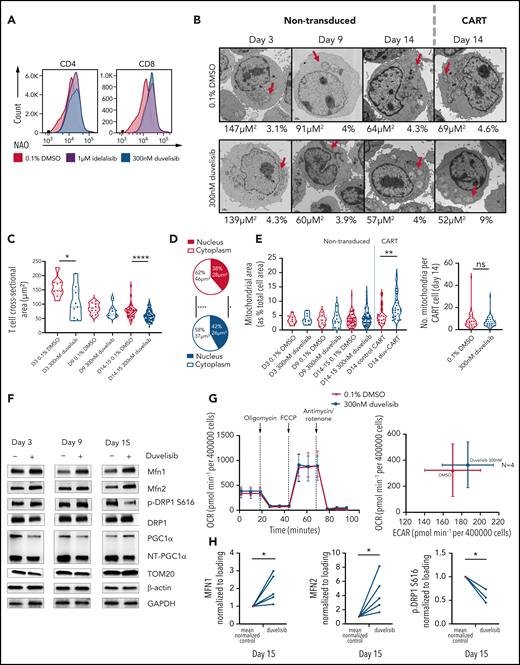
Duvelisib added during CART cell culture increased mitochondrial fusion with increased mitochondrial fusion proteins but did not change the OCRs. (A) T cells cultured with or without PI3K inhibitors were stained with NAO and assessed by flow cytometry, with representative NAO fluorescence shown on the CD4+ and CD8+ T-cell subsets. (B) Transmission electron microscopic images of nontransduced and CAR transduced T cells at day 14 of culture, with cell cross-sectional areas and mitochondrial cross-sectional area as a percentage of total cell area shown below each image. Images with cell size and mitochondrial area representative of the mean for each group are shown. FIJI software measured T-cell sizes across >10 replicate images for each patient and condition. Representative images from >420 acquired images are shown. Red arrows, mitochondria. (C) T-cell size, shown as cross-sectional area, over time in culture without or with duvelisib. (D) Differences in cross-sectional area of cytoplasm and nucleus at day 14 of culture in control and duvelisib T cell cultures. (E) Violin plots showing mitochondrial area as a percentage of T cell cross-sectional area for nontransduced and CART transduced cells. (F) Representative western blot analysis of mitochondrial fusion proteins MFN1 and MFN2. (G) Evaluation of oxygen consumption rates using a Seahorse bioenergetics bioanalyzer of OCR and extracellular acidification rate (ECAR) for CLL T-cell cultures. Cells were plated at 4 × 10⁵ per well for both control CART and Duv-CART. Results from 4 representative CLL samples from 12 replicates are shown. (H) Quantified western blots (MFN1, MFN2, and p.DRP1) from 3 to 5 CLL donors for select proteins. *P < .05; **P ≤ .01; ****P ≤ .0001; ns, not significant.
Duvelisib added during CART cell culture increased mitochondrial fusion with increased mitochondrial fusion proteins but did not change the OCRs. (A) T cells cultured with or without PI3K inhibitors were stained with NAO and assessed by flow cytometry, with representative NAO fluorescence shown on the CD4+ and CD8+ T-cell subsets. (B) Transmission electron microscopic images of nontransduced and CAR transduced T cells at day 14 of culture, with cell cross-sectional areas and mitochondrial cross-sectional area as a percentage of total cell area shown below each image. Images with cell size and mitochondrial area representative of the mean for each group are shown. FIJI software measured T-cell sizes across >10 replicate images for each patient and condition. Representative images from >420 acquired images are shown. Red arrows, mitochondria. (C) T-cell size, shown as cross-sectional area, over time in culture without or with duvelisib. (D) Differences in cross-sectional area of cytoplasm and nucleus at day 14 of culture in control and duvelisib T cell cultures. (E) Violin plots showing mitochondrial area as a percentage of T cell cross-sectional area for nontransduced and CART transduced cells. (F) Representative western blot analysis of mitochondrial fusion proteins MFN1 and MFN2. (G) Evaluation of oxygen consumption rates using a Seahorse bioenergetics bioanalyzer of OCR and extracellular acidification rate (ECAR) for CLL T-cell cultures. Cells were plated at 4 × 10⁵ per well for both control CART and Duv-CART. Results from 4 representative CLL samples from 12 replicates are shown. (H) Quantified western blots (MFN1, MFN2, and p.DRP1) from 3 to 5 CLL donors for select proteins. *P < .05; **P ≤ .01; ****P ≤ .0001; ns, not significant.
CD8+ Duv-CART cells have increased in vivo expansion and persistence
To investigate whether in vitro findings of increased stem-like qualities and increased mitochondria translates to enhanced expansion or persistence in vivo,7,14 1 × 10⁶ control- and Duv-CART cells containing the CD28 costimulatory domain (left panels) or the 4-1BB costimulatory domain (right panels) were injected into NOG mice previously engrafted with OSU-CLL cells. CLL cells represented a mean of 1.2% of blood leukocytes at the time of CART injection. Treatment with either CD28 or 41BB Duv-CART cells led to significantly prolonged survival relative to control CART cells (Figure 6A,F). Recipients of Duv-CART cells cleared circulating OSU-CLL cells faster than control CART cells (Figure 6B,G) and had greater peak expansion and persistence of total CART cells and CD8+ CART cells (Figure 6C-E,H-J). Consistent with improved survival, CD28 Duv-CART cells show reduced expression of LAG3 and TIM3 in the CD4+ (Figure 6K) and CD8+ CART subsets (Figure 6L), whereas recipients of 41BB Duv-CART cells had lower levels of LAG3, TIM-3, and PD1 on both CD4+ and CD8+ subsets (Figure 6M-N). Mice euthanized on day 28 after OSU-CLL engraftment because of hindlimb paresis had greater infiltration of Duv-CART vs control CART cells into the CD20+ paraspinal tumors (supplemental Figure 6). Treatment of NOG mice with a higher tumor burden of OSU-CLL cells confirmed increased in vivo CART expansion and superior survival for recipients of Duv-CART cells vs control CART cells (supplemental Figure 7). CART cells injected into mice lacking OSU-CLL cells were barely detectable in the blood, indicating a requirement for in vivo antigen stimulation for CART cell expansion (supplemental Figure 8D, green). NOG mice engrafted with a very low tumor burden showed superior Duv-CART cell expansion in vivo, but no significant difference in survival compared with recipients of control CART (supplemental Figure 8). In this experiment, loss of the CD19 antigen was observed in tumor samples recovered at necropsy from mice in both CD28/CD19 CART-cell treatment groups (supplemental Figure 9A-B). In conclusion, CD28 and 41BB Duv-CART cells consistently demonstrate greater in vivo expansion and persistence, with greater frequency of CD8+ CART cells that collectively confers a survival advantage compared with control CART cells.
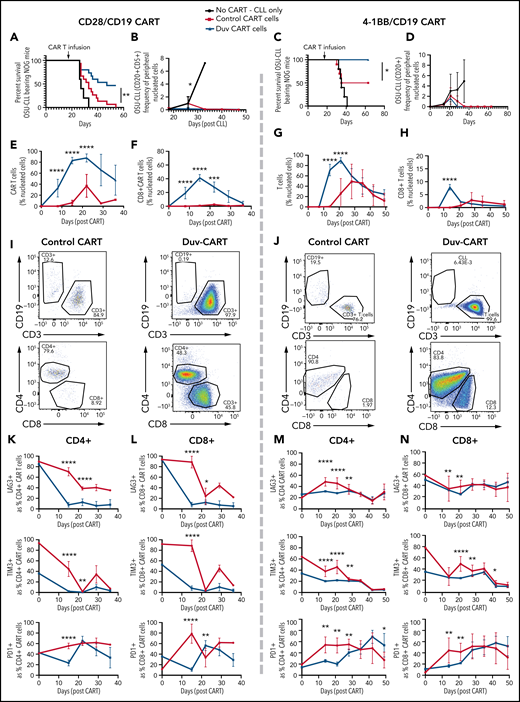
Duv-CART cells conferred a survival advantage in mice bearing intermediate disease burden OSU-CLL. OSU-CLL was engrafted in NOG mice and upon OSU-CLL (herein called CLL) reaching a mean of 1.2% (CD28/CD19) or 0.15% (41BB/CD19) of nucleated cell content, mice were treated with 1.0 × 10⁶ control CART or Duv-CART cells on days 15 to 18. Data from anti-CD19 CART with a CD28 costimulatory domain (CD28/CD19 CART) are in the left panels, and data from anti-CD19 CART with a 41BB costimulatory domain (41BB/CD19 CART) are shown in the right panels. (A) Kaplan-Meier survival analysis of CD28/CD19 control- and Duv-CART-cell–treated mice. (B) Frequency of CLL cells in peripheral blood, defined by flow cytometry as CD20+CD5+ over time after CLL engraftment. The in vivo expansion of total CART cells (C) and CD8+ CART cells (D) over time since infusion of CART. (CART cells were gated based on expression of GFP.) (E) Representative flow cytometry plots from peak expansion (day 18 after CART infusion). (F) Kaplan-Meier survival analysis of 41BB/CD19 control- and Duv-CART–treated mice. (G) Frequency of CLL in peripheral blood, defined by flow cytometry as CD20+CD5+ over time after CLL engraftment. The in vivo expansion of total human T cells (H) and CD8+ T cells (I) over time since infusion of CART. (The secondary antibody against the 41BB CAR failed to detect the CAR, and human CD3 was therefore used as a proxy for CAR-expressing cells.) (J) Representative flow cytometry plots from peak expansion (day 21 after CART infusion). In vivo immune checkpoint expression over time for CD28/CD19 CART within the CD4+ T- cell subset (K) and CD8+ T-cell subset (L). In vivo immune checkpoint expression over time for 41BB/CD19 CART within the CD4+ T-cell subset (M) and CD8+ T-cell subset (N). *P < .05; **P ≤ .01; ***P ≤ .001; ****P ≤ .0001.
Duv-CART cells conferred a survival advantage in mice bearing intermediate disease burden OSU-CLL. OSU-CLL was engrafted in NOG mice and upon OSU-CLL (herein called CLL) reaching a mean of 1.2% (CD28/CD19) or 0.15% (41BB/CD19) of nucleated cell content, mice were treated with 1.0 × 10⁶ control CART or Duv-CART cells on days 15 to 18. Data from anti-CD19 CART with a CD28 costimulatory domain (CD28/CD19 CART) are in the left panels, and data from anti-CD19 CART with a 41BB costimulatory domain (41BB/CD19 CART) are shown in the right panels. (A) Kaplan-Meier survival analysis of CD28/CD19 control- and Duv-CART-cell–treated mice. (B) Frequency of CLL cells in peripheral blood, defined by flow cytometry as CD20+CD5+ over time after CLL engraftment. The in vivo expansion of total CART cells (C) and CD8+ CART cells (D) over time since infusion of CART. (CART cells were gated based on expression of GFP.) (E) Representative flow cytometry plots from peak expansion (day 18 after CART infusion). (F) Kaplan-Meier survival analysis of 41BB/CD19 control- and Duv-CART–treated mice. (G) Frequency of CLL in peripheral blood, defined by flow cytometry as CD20+CD5+ over time after CLL engraftment. The in vivo expansion of total human T cells (H) and CD8+ T cells (I) over time since infusion of CART. (The secondary antibody against the 41BB CAR failed to detect the CAR, and human CD3 was therefore used as a proxy for CAR-expressing cells.) (J) Representative flow cytometry plots from peak expansion (day 21 after CART infusion). In vivo immune checkpoint expression over time for CD28/CD19 CART within the CD4+ T- cell subset (K) and CD8+ T-cell subset (L). In vivo immune checkpoint expression over time for 41BB/CD19 CART within the CD4+ T-cell subset (M) and CD8+ T-cell subset (N). *P < .05; **P ≤ .01; ***P ≤ .001; ****P ≤ .0001.
Duvelisib treatment led to cell-intrinsic enhancement of CART cell expansion and antitumor activity in vivo
To address whether the enhanced expansion of Duv-CART cells was due to the greater number of naive and central memory subsets of Duv-CART cells compared with control CART cells, we sorted and injected a limited number of TCM (0.4 × 10E6) from Duv-CART and control CART cultures into NOG mice with established OSU-CLL cells. As seen in experiments using bulk CART cells, TCM Duv-CART cells had greater expansion and persistence than TCM control CART, which translated into superior long-term survival (supplemental Figure 10) (Figure 7).
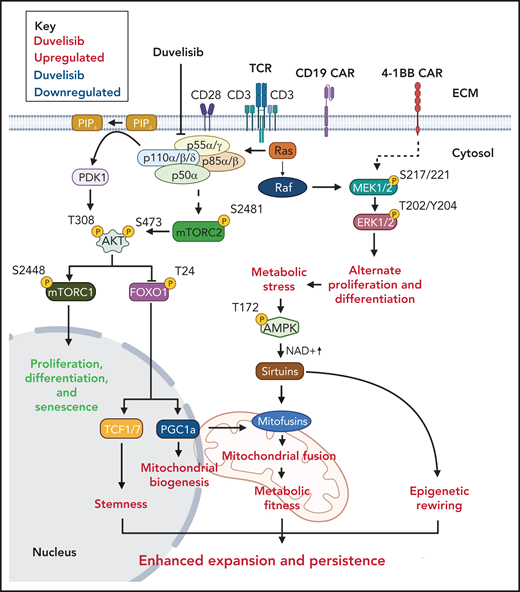
A proposed mechanism for the increased antileukemia activity of Duv-CART cells. T-cell receptor signaling activates PI3K phosphorylation through phosphorylation of protein lipase C (not shown). Duvelisib inhibits the active sites of PI3Kδ and PI3Kγ at the p110δ and p110γ subunits. Processes that duvelisib upregulates are shown in green, and processes that duvelisib downregulates are shown in red.
A proposed mechanism for the increased antileukemia activity of Duv-CART cells. T-cell receptor signaling activates PI3K phosphorylation through phosphorylation of protein lipase C (not shown). Duvelisib inhibits the active sites of PI3Kδ and PI3Kγ at the p110δ and p110γ subunits. Processes that duvelisib upregulates are shown in green, and processes that duvelisib downregulates are shown in red.
Discussion
Results from the current study reinforce clinical experience that manufacture of CD19-targeted CART cells in patients with CLL requires a different approach than that used in acute lymphoblastic leukemia or patients with diffuse large B-cell lymphoma.41-44 Strong ex vivo stimuli, such as anti-CD3/CD28 beads, promote PI3K/AKT signaling45 (supplemental Figure 2) and generate terminally differentiated effector T cells.7 Indeed, during TCR-driven expansion of both CD4+ and CD8+ T cells, PI3K/mTOR signaling is differentially regulated during mitosis.46,47 Daughter T cells with more PI3K/mTOR signaling differentiate into effector cells, whereas daughter T cells with less PI3K/mTOR signaling retain a self-renewal capacity.46,47 Our data show PI3Kδ/γ inhibition during ex vivo culture decreased PI3K/mTOR signaling and enhanced yields of TSCM, naive, and TCM CD8+ CART cells, while retaining proliferative ERK/MEK signaling (Figure 4). These data are consistent with those in a recent report that AKT activity in T cells is limited by levels of adenosine triphosphate as a substrate, and that higher levels of AKT activity are associated with a predominance of glycolysis and terminal differentiation into effector T cells.48 Several previous studies described potential strategies to improve CART production using kinase inhibitors,49-52 including the use of PI3Ki-cultured BCMA CART in myeloma.53
A second finding with translational implications from this study is that inhibition of PI3K signaling during CART manufacturing normalized the CD4/CD8 ratio and decreased the expression of exhaustion markers in the CART cell product. CART-cell manufacturing typically leads to preferential expansion of CD4+ CART cells,54 upregulation of coinhibitory molecules,55 and exhaustion in CD8+ CART after concomitant stimulation through TCRs and CAR.54 Separate manufacturing of CD4+ and CD8+ CART cells was reported in one study to yield products with fewer manufacturing failures and increased efficacy,56 whereas researchers in another study did not find that the CD4/CD8 ratio of infused CART cells correlated with in vivo efficacy.57 We show that addition of PI3Kis to cultures increased frequencies of CD8+ CART cells during both ex vivo and in vivo expansion (Figures 3C and 6D,I) and decreased frequencies of cells expressing the TIM-3 and LAG-3 exhaustion markers (Figure 1G).
The finding of increased mitochondrial fusion in Duv-CART cells is consistent with previous reports that greater mitochondrial mass in CD8+ CART cells has been associated with improved clinical outcomes.8 Increased expression of the mitochondrial fusion protein MFN2 and the decreased fission protein p-DRP1 are consistent with the observed increase in mitochondrial fusion39 in Duv-CART cells and their enhanced expansion in vivo.58 We predicted Duv-expanded T cells would have increased oxygen consumption compared with control T cells expanded without a PI3Ki. However, bioenergetics analyses showed no significant change in OCR (Figure 5G), suggesting that mitochondrial fusion alters metabolism to maintain oxidative phosphorylation despite decreased cell size.59 Indeed, increased mitochondrial content at the end of in vitro manufacturing with duvelisib cannot by itself explain enhanced in vivo expansion in the absence of duvelisib, as multiple rounds of in vivo cell division would dilute any initial differences in mitochondrial content between Duv-CART cells and control CART cells. Nevertheless, prolonged in vivo persistence of Duv-CART cells vs control CART cells suggests the epigenetic changes in T-cell physiology persist for weeks after in vitro exposure to duvelisib (Figure 6). Indeed, infusion of the same number of TCM cells into CLL-bearing NOG mice reveal marked differences in cell-intrinsic expansion and persistence conferred by in vitro exposure to duvelisib (supplemental Figure 10). Our findings are also consistent with reports that inhibition of AKT in CART cells promotes activation and intranuclear localization of FOXO1, a transcription factor regulating T-cell stemness (Figure 4D-E).60 Although direct measurements of gene transcription were outside the scope of this study, we observed a consistent increase in levels of the transcription factor TCF1/7, which is associated with stem-cell–like T cells61 (Figure 4D-F).
This study has limitations. First, we noted significant variability in the patient sample response to duvelisib or idelalisib, with samples from some patients showing marked increases in T-cell yields and phenotypic changes, whereas a minority of patients showed minimal effects. The number of patients with CLL studied (n = 17) is insufficient to draw definite conclusions regarding differences in baseline characteristics of the patients that may influence in vitro cell expansion. Furthermore, only treatment-naive patients with CLL were studied, limiting the applicability of the results. In addition, CART cells from some patients with CLL expanded with duvelisib but could not be expanded in its absence, precluding the use of these samples for paired in vivo comparisons of PI3Ki-expanded CART cells vs control CART cells. Thus, results of in vivo experiments may be biased in favor of less senescent CLL samples. Finally, some NOG mice developed severe eczema (particularly the longer-surviving Duv-CART cell recipients) which caused them to meet International Animal Care and Use Committee criteria for euthanasia, which may have confounded survival results.
These results may be broadly applicable to T-cell therapies that involve ex vivo expansion, such that pretreatment of patients with duvelisib before leukapheresis may enhance outcomes. Allogeneic CART or CAR-NK cells are an alternative to autologous CART cells that could overcome the limited fitness of CLL-derived CART cell.62,63 It is of interest to explore whether addition of duvelisib to allo-CART manufacturing enhances efficacy. In summary, PI3Kδ/γ inhibition during CART-cell manufacturing offers a translatable method of reversing T-cell immune paralysis and improving response rates to CART-cell therapy in patients with CLL.
Acknowledgments
The authors thank the patients and healthy volunteers for their blood donations; Emory’s Clinical Lymphoma Research Team for requesting patient consent and aiding in sample collection; J. C. Byrd for providing critical edits to the manuscript, and Yuan Liu for providing guidance for the biostatistical analysis. C.R.F. thanks Lauren Fleischer for teaching lentivirus transduction. E. Hertlein and J. C. Byrd generously provided the OSU-CLL cell line through a material transfer agreement. Biorender software was used to create Figure 7.
Christopher Ronald Funk was supported by a Howard Hughes Medical Institute Medical Research Fellowship. Mass cytometry by time of flight (CyTOF) was funded by a Winship Cancer Institute Immunology Symposium Award (Christopher Ronald Funk and E.K.W.). This study was supported in part by National Institutes of Health, National Cancer Institute (NIH/NCI) grant R01CA208328 (M.S.); by Leukemia and Lymphoma Society TRP Award 6573-19 (M.S.); by Verastem Oncology, through a sponsored research agreement; by the Immune Monitoring Shared Resource of Winship Cancer Institute of Emory University; in part by the Emory Integrated Genomics Core Shared Resource of Winship Cancer Institute of Emory University and NIH/NCI grant P30CA138292; by the Robert P. Apkarian Integrated Electron Microscopy Core (IEMC) at Emory University, which is subsidized by the School of Medicine and Emory College of Arts and Sciences; and by the Georgia Clinical and Translational Science Alliance of the NIH, National Center for Advancing Translational Sciences grant UL1TR000454. The content is solely the responsibility of the authors and does not necessarily represent the official views of the National Institutes of Health.
Authorship
Contribution: Christopher Ronald Funk helped conceive the study, designed and performed all experiments (including assisting in experiments with collaborators), wrote the manuscript, and obtained funding; S.W. assisted in execution of the in vitro experiments, optimized and performed the flow cytometry and cell sorting, designed and executed most of the in vivo experiments, and edited the manuscript; K.Z.C. conceived, designed, and performed all experiments related to the metabolic and epigenetic pathways, including all western blot experiments and most of the extracellular flux experiments and microscopy experiments, generated Figure 7, and edited the manuscript; C.L.E. and A.S. designed and performed the western blot and Seahorse flux analyses and edited the manuscript; A.W. performed T-cell expansions and flow cytometry and assisted with the Seahorse flux analysis; S. Chandrakasan aided in the T-cell phenotype analysis; V.A.G. performed some of the western blot analyses related to apoptotic signaling; J.T.Z., A.F., and H.T.S. assisted in plasmid preparation, and lentivirus culture; S.S.R. designed the CAR construct and edited the manuscript; J.T.Z. assisted with the in vitro cytotoxicity assay; Christopher R. Flowers and J.L.K. arranged the collection of the CLL blood samples and edited the manuscript; S. Coma and J.A.P. provided assistance with project design and in vivo study design; S.R. assisted extensively in designing the experiments and edited the manuscript; M.S. designed the experiments and edited the manuscript; and E.K.W. helped conceive the study, provided extensive mentorship and experimental guidance, secured funding, and edited the manuscript.
Conflict-of-interest disclosure: Christopher Ronald Funk, S.W., Sruthi Ravindranathan and E.K.W. received research support from Verastem Oncology. S. Coma and J.A.P. are employees of Verastem Oncology, and E.K.W. is a consultant. Invention disclosures related to this work were filed in 2016 and 2019. Intellectual property related to the use of PI3Kis and peptide antagonists to vasoactive intestinal polypeptides to enhance the activation of T cells for immunotherapy is the subject of US patent applications filed with Sruthi Ravindranathan and E.K.W. listed as inventors. These patents have been licensed to Cambium Oncology, LLC. E.K.W. and S. Chandrakasan are cofounders of and have equity in Cambium Oncology. A conflict-of-interest management plan has been reviewed and approved by Emory University.
Correspondence: Edmund K. Waller, Winship Cancer Institute, 1365 Clifton Rd, Atlanta, GA 30322; e-mail: ewaller@emory.edu.
Requests for data sharing may be submitted to Edmund K. Waller (ewaller@emory.edu).
There is a Blood Commentary on this article in this issue.
The online version of this article contains a data supplement.
The publication costs of this article were defrayed in part by page charge payment. Therefore, and solely to indicate this fact, this article is hereby marked “advertisement” in accordance with 18 USC section 1734.

This feature is available to Subscribers Only
Sign In or Create an Account Close Modal