

Errors were introduced into Figures 4 and 6 during the publication process.
Page 529: In Figure 4B and F, the black plots should be red. The corrected Figure 4 is shown below.
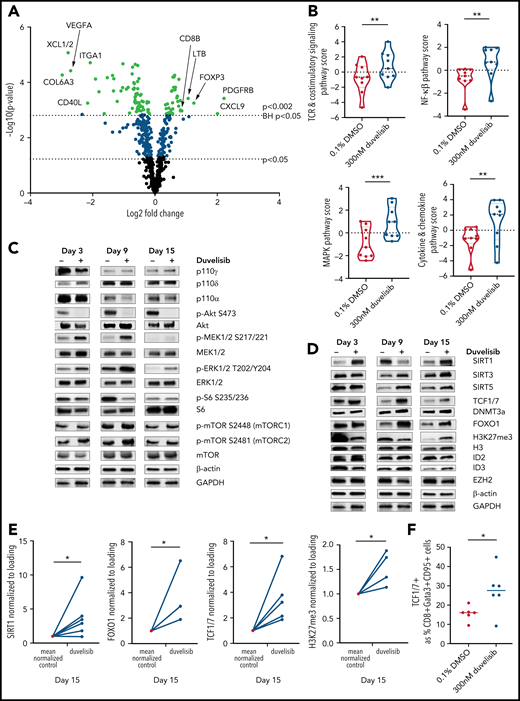
PI3K inhibition during T-cell culture–enhanced TCR and MEK/ERK signaling with alterations in epigenetic regulators that promote T-cell stemness. T cells from patients with CLL (n = 9) were cultured with or without 300 nM duvelisib administered to cultures every 3 days and were harvested after 3, 9, or 15 days of culture. Cells were stimulated with anti-CD3/CD28 beads on days 1 and 9 of culture, with day-9 samples harvested 90 minutes after restimulation with anti-CD3/CD28 beads and addition of duvelisib. Hypothesis-generating NanoString analysis was first performed and followed-up by confirmatory western blot experiments. (A) Differential expression of metabolically relevant genes in duvelisib-cultured cells compared with control cells at day 9 of culture. Changes in messenger RNA levels for 102 genes met Benjamini-Hochberg (BH) false-discovery thresholds (red). The 5 genes with the greatest fold increase or decrease are labeled. (B) Pathway scores based on gene expression levels for TCR, costimulatory, MAPK, and mTOR signaling pathways. Western blot of cell lysates probing proteins related to proliferative pathways (C) and epigenetic regulatory pathways (D). Quantifications of select western blots (SIRT1, FOXO1, and TCF1/7) normalized to control (E) with ancillary flow cytometric analysis of frequencies of TCF1/7 expressing cells (F) at day 15 of culture. Results reproduced across 3 patients with CLL with quantitative results shown in the supplemental data (supplemental Figure 5). *P < .05; **P ≤ .01; ***P ≤ .001.
PI3K inhibition during T-cell culture–enhanced TCR and MEK/ERK signaling with alterations in epigenetic regulators that promote T-cell stemness. T cells from patients with CLL (n = 9) were cultured with or without 300 nM duvelisib administered to cultures every 3 days and were harvested after 3, 9, or 15 days of culture. Cells were stimulated with anti-CD3/CD28 beads on days 1 and 9 of culture, with day-9 samples harvested 90 minutes after restimulation with anti-CD3/CD28 beads and addition of duvelisib. Hypothesis-generating NanoString analysis was first performed and followed-up by confirmatory western blot experiments. (A) Differential expression of metabolically relevant genes in duvelisib-cultured cells compared with control cells at day 9 of culture. Changes in messenger RNA levels for 102 genes met Benjamini-Hochberg (BH) false-discovery thresholds (red). The 5 genes with the greatest fold increase or decrease are labeled. (B) Pathway scores based on gene expression levels for TCR, costimulatory, MAPK, and mTOR signaling pathways. Western blot of cell lysates probing proteins related to proliferative pathways (C) and epigenetic regulatory pathways (D). Quantifications of select western blots (SIRT1, FOXO1, and TCF1/7) normalized to control (E) with ancillary flow cytometric analysis of frequencies of TCF1/7 expressing cells (F) at day 15 of culture. Results reproduced across 3 patients with CLL with quantitative results shown in the supplemental data (supplemental Figure 5). *P < .05; **P ≤ .01; ***P ≤ .001.
Page 533: In Figure 6A-D, the colors in the graphs do not match the color key at the top of the figure. The corrected Figure 6 is shown below.
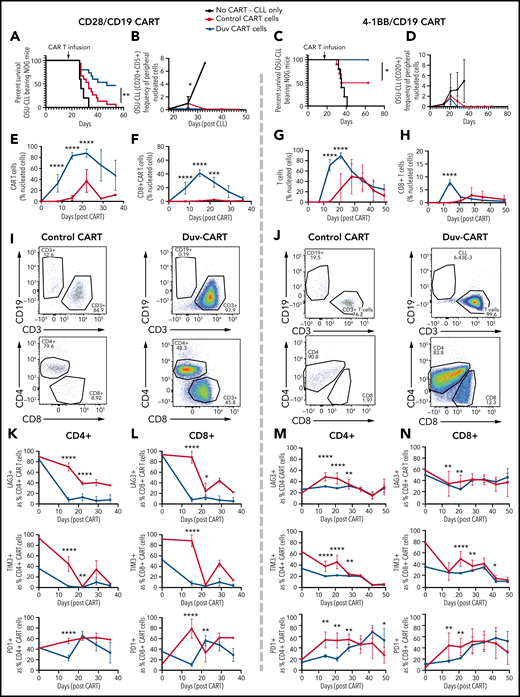
Duv-CART cells conferred a survival advantage in mice bearing intermediate disease burden OSU-CLL. OSU-CLL was engrafted in NOG mice, and upon OSU-CLL (herein called CLL) reaching a mean of 1.2% (CD28/CD19) or 0.15% (41BB/CD19) of nucleated cell content, mice were treated with 1.0 × 10⁶ control CART or Duv-CART cells on days 15 to 18. Data from anti-CD19 CART with a CD28 costimulatory domain (CD28/CD19 CART) are in the left panels, and data from anti-CD19 CART with a 41BB costimulatory domain (41BB/CD19 CART) are shown in the right panels. (A) Kaplan-Meier survival analysis of CD28/CD19 control- and Duv-CART-cell–treated mice. (B) Frequency of CLL cells in peripheral blood, defined by flow cytometry as CD20+CD5+ over time after CLL engraftment. The in vivo expansion of total CART cells (C) and CD8+ CART cells (D) over time since infusion of CART. (CART cells were gated based on expression of GFP.) (E) Representative flow cytometry plots from peak expansion (day 18 after CART infusion). (F) Kaplan-Meier survival analysis of 41BB/CD19 control- and Duv-CART–treated mice. (G) Frequency of CLL in peripheral blood, defined by flow cytometry as CD20+CD5+ over time after CLL engraftment. The in vivo expansion of total human T cells (H) and CD8+ T cells (I) over time since infusion of CART. (The secondary antibody against the 41BB CAR failed to detect the CAR, and human CD3 was therefore used as a proxy for CAR-expressing cells.) (J) Representative flow cytometry plots from peak expansion (day 21 after CART infusion). In vivo immune checkpoint expression over time for CD28/CD19 CART within the CD4+ T-cell subset (K) and CD8+ T-cell subset (L). In vivo immune checkpoint expression over time for 41BB/CD19 CART within the CD4+ T-cell subset (M) and CD8+ T-cell subset (N). *P < .05; **P ≤ .01; ***P ≤ .001; ****P ≤ .0001.
Duv-CART cells conferred a survival advantage in mice bearing intermediate disease burden OSU-CLL. OSU-CLL was engrafted in NOG mice, and upon OSU-CLL (herein called CLL) reaching a mean of 1.2% (CD28/CD19) or 0.15% (41BB/CD19) of nucleated cell content, mice were treated with 1.0 × 10⁶ control CART or Duv-CART cells on days 15 to 18. Data from anti-CD19 CART with a CD28 costimulatory domain (CD28/CD19 CART) are in the left panels, and data from anti-CD19 CART with a 41BB costimulatory domain (41BB/CD19 CART) are shown in the right panels. (A) Kaplan-Meier survival analysis of CD28/CD19 control- and Duv-CART-cell–treated mice. (B) Frequency of CLL cells in peripheral blood, defined by flow cytometry as CD20+CD5+ over time after CLL engraftment. The in vivo expansion of total CART cells (C) and CD8+ CART cells (D) over time since infusion of CART. (CART cells were gated based on expression of GFP.) (E) Representative flow cytometry plots from peak expansion (day 18 after CART infusion). (F) Kaplan-Meier survival analysis of 41BB/CD19 control- and Duv-CART–treated mice. (G) Frequency of CLL in peripheral blood, defined by flow cytometry as CD20+CD5+ over time after CLL engraftment. The in vivo expansion of total human T cells (H) and CD8+ T cells (I) over time since infusion of CART. (The secondary antibody against the 41BB CAR failed to detect the CAR, and human CD3 was therefore used as a proxy for CAR-expressing cells.) (J) Representative flow cytometry plots from peak expansion (day 21 after CART infusion). In vivo immune checkpoint expression over time for CD28/CD19 CART within the CD4+ T-cell subset (K) and CD8+ T-cell subset (L). In vivo immune checkpoint expression over time for 41BB/CD19 CART within the CD4+ T-cell subset (M) and CD8+ T-cell subset (N). *P < .05; **P ≤ .01; ***P ≤ .001; ****P ≤ .0001.
These figures have been corrected in the online version of the article.
In addition, in the supplemental file that was included in the original online version of the article, some text that should have been black was blue and some figures were superimposed on others. A corrected supplemental file has been inserted in the online version of the article.
The publisher apologizes for the errors.

This feature is available to Subscribers Only
Sign In or Create an Account Close Modal