

Key Points
UBA1 mutations are primarily responsible for myeloid clonal expansion and both the inflammatory and hematologic phenotype in VEXAS.
Patients with VEXAS have an enrichment of typical CH mutations, particularly in DNMT3A and TET2.

Abstract
Vacuoles, E1 enzyme, X-linked, autoinflammatory, somatic (VEXAS) syndrome is caused by somatic mutations in UBA1 (UBA1mut) and characterized by heterogenous systemic autoinflammation and progressive hematologic manifestations, meeting criteria for myelodysplastic syndrome (MDS) and plasma cell dyscrasias. The landscape of myeloid-related gene mutations leading to typical clonal hematopoiesis (CH) in these patients is unknown. Retrospectively, we screened 80 patients with VEXAS for CH in their peripheral blood (PB) and correlated the findings with clinical outcomes in 77 of them. UBA1mut were most common at hot spot p.M41 (median variant allele frequency [VAF] = 75%). Typical CH mutations cooccurred with UBA1mut in 60% of patients, mostly in DNMT3A and TET2, and were not associated with inflammatory or hematologic manifestations. In prospective single-cell proteogenomic sequencing (scDNA), UBA1mut was the dominant clone, present mostly in branched clonal trajectories. Based on integrated bulk and scDNA analyses, clonality in VEXAS followed 2 major patterns: with either typical CH preceding UBA1mut selection in a clone (pattern 1) or occurring as an UBA1mut subclone or in independent clones (pattern 2). VAF in the PB differed markedly between DNMT3A and TET2 clones (median VAF of 25% vs 1%). DNMT3A and TET2 clones associated with hierarchies representing patterns 1 and 2, respectively. Overall survival for all patients was 60% at 10 years. Transfusion-dependent anemia, moderate thrombocytopenia, and typical CH mutations, each correlated with poor outcome. In VEXAS, UBA1mut cells are the primary cause of systemic inflammation and marrow failure, being a new molecularly defined somatic entity associated with MDS. VEXAS-associated MDS is distinct from classical MDS in its presentation and clinical course.
Medscape Continuing Medical Education online

In support of improving patient care, this activity has been planned and implemented by Medscape, LLC and the American Society of Hematology. Medscape, LLC is jointly accredited with commendation by the Accreditation Council for Continuing Medical Education (ACCME), the Accreditation Council for Pharmacy Education (ACPE), and the American Nurses Credentialing Center (ANCC), to provide continuing education for the healthcare team.
Medscape, LLC designates this Journal-based CME activity for a maximum of 1.0 AMA PRA Category 1 Credit(s)™. Physicians should claim only the credit commensurate with the extent of their participation in the activity.
Successful completion of this CME activity, which includes participation in the evaluation component, enables the participant to earn up to 1.0 MOC points in the American Board of Internal Medicine's (ABIM) Maintenance of Certification (MOC) program. Participants will earn MOC points equivalent to the amount of CME credits claimed for the activity. It is the CME activity provider's responsibility to submit participant completion information to ACCME for the purpose of granting ABIM MOC credit.
All other clinicians completing this activity will be issued a certificate of participation. To participate in this journal CME activity: (1) review the learning objectives; (2) study the education content; (3) take the post-test with a 75% minimum passing score and complete the evaluation at https://www.medscape.org/journal/blood; and (4) view/print certificate. For CME questions, see page 306.
Disclosures
CME questions author Laurie Barclay, MD, freelance writer and reviewer, Medscape, LLC, declares no competing financial interests.
Learning Objectives
Upon completion of this activity, participants will:
Describe the landscape of myeloid-related gene mutations leading to typical clonal hematopoiesis (CH) in a large cohort of 80 patients with vacuoles, E1 enzyme, X-linked, autoinflammatory, somatic (VEXAS) syndrome, according to a retrospective study using error-corrected and single-cell DNA (scDNA) sequencing
Identify the impact of CH in a large cohort of 80 patients with VEXAS syndrome and correlations of CH patterns with clinical outcomes, according to a retrospective study
Learn about the role of CH in inflammation and how it impacts outcomes, particularly survival, in patients with VEXAS syndrome
Release date: July 20, 2023; Expiration date: July 20, 2024
Introduction
Vacuoles, E1 enzyme, X-linked, autoinflammatory, somatic (VEXAS) syndrome is a systemic autoinflammatory disease seen primarily in older men secondary to acquired somatic mutations in UBA1 (UBA1mut), an X-linked gene that encodes the major E1-activating enzyme required for ubiquitylation.1UBA1mut occur at the hematopoietic stem and progenitor cell level but are restricted to the myeloid lineage in the blood, triggering the activation of inflammatory pathways in these cells.1,2
Patients with VEXAS present with adult-onset treatment-refractory inflammatory symptoms (eg, ear chondritis and neutrophilic dermatitis) and have a predisposition for myelodysplastic syndrome (MDS) and plasma cell dyscrasias.1,3,4 MDS is reported at a high frequency in VEXAS (25%-55%), but progression to acute myeloid leukemia (AML) has only been reported in a single case.1,2,5,6 Most MDS cases are stratified as being low risk based on the revised international prognostic scoring system (IPSS-R) and normal karyotypes. Atypia, in addition to the characteristic vacuolated myeloid and erythroid progenitor cells, is a common but nonspecific bone marrow (BM) morphologic finding in VEXAS.3
Clonal hematopoiesis (CH) in known myeloid-related genes (referred to in this article as “typical CH”) occurs at higher frequencies in many autoimmune/inflammatory diseases.7-9 A few studies have reported concomitant somatic mutations in typical CH genes with UBA1mut.4,10-13 However, the true prevalence and clinical impact of coexisting CH mutations with UBA1mut in VEXAS remain to be defined; a higher frequency is expected because of advanced age, severe and chronic inflammation, and predisposition to hematologic malignancies (MDS and plasma cell dyscrasia). We performed the current study to define the CH landscape and its impact in a large cohort of patients with VEXAS using error-corrected and single-cell DNA sequencing and correlated these findings with clinical outcomes.
Methods
Patients
Eighty patients with VEXAS were included for CH screening: 16 from Mayo Clinic and 64 from the National Institutes of Health (NIH), including 13 who were prospectively evaluated. Clinical data were retrospectively obtained by reviewing the available electronic medical records. Data including age, onset of inflammatory symptoms, date of sample for sequencing, presence of anemia and/or thrombocytopenia, diagnosis of MDS, cytogenetic abnormalities, presence of plasma cell dyscrasia, thrombosis, last follow-up date, and status at last follow-up were collected for all patients except for 3 without sufficient records; 77 were included for the outcome analyses (Table 1).
Clinical characteristics of 77 patients with VEXAS stratified based on UBA1 genotype and typical CH mutations
| Characteristic | Total | UBA1 genotype | Typical CH | Typical CH subgroup | Typical CH VAF | ||||||||||||
|---|---|---|---|---|---|---|---|---|---|---|---|---|---|---|---|---|---|
| M41T | M41V | M41L | c.118-1 G>C | P value | Yes | No | P value | D/T | D&T | Others with or without D/T | No typical CH | P value | VAF <10% | VAF ≥10% | P value | ||
| Number (n) | 77 | 49 | 16 | 9 | 3 | 46 | 31 | 19 | 7 | 20 | 31 | 54 | 23 | ||||
| Median UBA1 VAF, % (range) | 74.3 (8.7, 97.3) | 75.3 (24.0, 97.3) | 71.6 (8.7, 93.3) | 80.5 (47.5, 86.4) | 64.7 (59.3, 65.7) | .3 | 7.2 (8.7, 97.3) | 75.1 (24.0, 89.3) | 1 | 81.9 (35.0, 97.3) | 57.3 (28.4, 94.7) | 74.0 (8.7, 93.3) | 75.1 (24.0, 89.3) | .2 | 74.2 (8.7, 93.3) | 76.1 (28.4, 97.3) | .4 |
| Median age, years (range)∗ | 69.3 (48.4, 88.7) | 71.0 (48.4, 88.7) | 62.8 (55.9, 78.0) | 69.0 (62.5, 75.7) | 62.8 (61.0, 71.3) | .06 | 70.0 (55.0, 83.0) | 68.0 (48.0, 89.0) | .2 | 70.8 (57.6, 82.7) | 71.0 (58.0, 80.4) | 69.4 (55.4, 78.7) | 68.0 (48.4, 88.7) | .6 | 69.1 (48.4, 88.7) | 70·8 (55.4, 82.7) | .4 |
| Median follow-up from symptom onset, years (range) | 3.7 (0.1, 20.6) | 3.2 (0.2, 20.6) | 3.3 (0.1, 11.2) | 5.5 (1.8, 6.8) | 3.7 (3.0, 4.6) | .5 | 3.2 (0.1, 20.6) | 4.4 (0.2, 9.0) | .6 | 2.8 (0.5, 15.5) | 3.2 (0.9, 6.4) | 4.4 (0.1, 20.6) | 4.4 (0.2, 9.0) | .5 | 4.0 (0.1, 13.8) | 2.9 (0.5, 20.6) | .6 |
| Median time to follow-up from sequencing, years (range) | 0.8 (0.05, 6.3) | 0.8 (0.05, 2.9) | 0.8 (0.1, 6.3) | 1.2 (0.1, 2.0) | 0.9. (0.5, 0.9) | .5 | 0.9 (0.05, 6.3) | 0.8 (0.07, 2.8) | .7 | 0.8 (0.05, 6.3) | 0.9 (0.2, 2.9) | 0.8 (0.1, 2.3) | 0.8 (0.1, 2.8) | .8 | 0·8 (0.05, 6.3) | 0.8 (0.2, 2.3) | .9 |
| Hematologic manifestations and diagnoses | |||||||||||||||||
| Cytopenias, no (%) | |||||||||||||||||
| Tranfusion-dependent anemia | 18 (23) | 10 (20) | 4 (25) | 4 (44) | 0 (0) | .5 | 9 (20) | 9 (29) | .5 | 4 (21) | 3 (43) | 2 (10) | 9 (29) | .3 | 13 (24) | 5 (22) | 1 |
| Thrombocytopenia (<100 × 103/μL) | 19 (25) | 11 (22) | 5 (31) | 2 (22) | 0 (0) | .9 | 11 (24) | 7 (23) | 1 | 5 (26) | 1 (14) | 5 (25) | 7 (23) | .9 | 12 (22) | 6 (26) | 1 |
| Presumed MDS, n (%)† | 14 (18) | 7 (14) | 3 (19) | 4 (44) | 0 (0) | .2 | 8 (17) | 6 (19) | 1 | 4 (21) | 2 (29) | 2 (10) | 6 (19) | .5 | 9 (17) | 5 (22) | .7 |
| Plasma cell disorder, n (%) | |||||||||||||||||
| MGUS | 15 (19) | 10 (20) | 4 (25) | 0 (0) | 1 (33) | .4 | 11 (24) | 4 (13) | .4 | 3 (16) | 3 (43) | 5 (25) | 4 (13) | .3 | 8 (15) | 7 (30) | .2 |
| Multiple myeloma | 2 (3) | 1 (2) | 0 (0) | 1 (11) | 0 (0) | .3 | 1 (2) | 1 (3) | 1 | 0 (0) | 0 (0) | 1 (5) | 1 (3) | 1 | 2 (4) | 0 (0) | 1 |
| Venous thromboembolism, n (%) | 44 (57) | 28 (57) | 10 (63) | 6 (67) | 0 (0) | .3 | 28 (61) | 16 (52) | .7 | 11 (58) | 4 (57) | 13 (65) | 16 (52) | .9 | 30 (56) | 14 (61) | .9 |
| Inflammatory manifestations and diagnosis | |||||||||||||||||
| Relapsing polychondritis n (%) | 46 (59) | 31 (63) | 6 (38) | 6 (67) | 3 (100) | .1 | 25 (54) | 21 (68) | .3 | 10 (53) | 5 (71) | 10 (50) | 21 (68) | .5 | 34 (63) | 12 (52) | .4 |
| Sweet syndrome, n (%) | 16 (21) | 8 (16) | 3 (19) | 3 (33) | 2 (67) | .1 | 8 (17) | 8 (26) | .5 | 3 (16) | 1 (14) | 4 (20) | 8 (26) | .9 | 12 (22) | 4 (17) | .8 |
| Symptom based | |||||||||||||||||
| Systemic symptoms‡ | 71 (92) | 45 (92) | 15 (94) | 8 (89) | 3 (100) | 1 | 42 (91) | 29 (94) | 1 | 18 (95) | 6 (86) | 18 (90) | 29 (94) | .7 | 51 (94) | 20 (87) | .4 |
| Skin involvement | 62 (81) | 38 (78) | 14 (88) | 7 (78) | 3 (100) | .8 | 37 (80) | 25 (81) | 1 | 16 (84) | 3 (43) | 18 (90) | 25 (81) | .1 | 46 (85) | 16 (73) | .1 |
| Periorbital edema | 25 (32) | 13 (27) | 11 (24) | 0 (0) | 1 (33) | <.01 | 21 (46) | 4 (13) | <.01 | 8 (42) | 3 (43) | 10 (50) | 4 (13) | .02 | 16 (30) | 9 (39) | .4 |
| Inflammatory eye disease | 8 (10) | 1 (2) | 4 (25) | 3 (33) | 0 (0) | .7 | 14 (30) | 10 (32) | 1 | 9 (47) | 1 (14) | 4 (20) | 10 (32) | .3 | 19 (35) | 5 (22) | .3 |
| Inner ear involvement§ | 39 (51) | 23 (47) | 9 (56) | 5 (55) | 2 (67) | .8 | 22 (48) | 17 (55) | .7 | 8 (42) | 5 (71) | 9 (45) | 17 (55) | .6 | 29 (54) | 10 (43) | .5 |
| Chondritis (ear/nose) | 42 (55) | 29 (59) | 5 (31) | 5 (55) | 3 (100) | .1 | 25 (54) | 17 (55) | 1 | 10 (53) | 5 (71) | 10 (50) | 17 (55) | .8 | 29 (54) | 13 (57) | 1 |
| Cardiac manifestations | 9 (12) | 5 (10) | 2 (13) | 2 (22) | 0 (0) | .7 | 4 (9) | 5 (16) | .5 | 2 (10) | 0 (0) | 2 (10) | 5 (16) | .8 | 6 (11) | 3 (13) | 1 |
| Pulmonary/pleural issues | 43 (56) | 29 (59) | 9 (56) | 5 (55) | 0 (0) | .3 | 26 (57) | 17 (55) | 1 | 11 (58) | 6 (86) | 9 (55) | 17 (55) | .3 | 27 (50) | 16 (70) | .1 |
| Musculoskeletal‖ | 56 (73) | 35 (71) | 12 (75) | 7 (78) | 2 (67) | 1 | 35 (76) | 21 (68) | .6 | 15 (79) | 6 (86) | 14 (70) | 21 (68) | .8 | 36 (67) | 20 (87) | .1 |
P values obtained using Wilcoxon rank sum test or Kruskal-Wallis test for continuous variables, and χ2 test or Fisher exact test for discrete variables. P values <.05 are shown in bold.
D/T, DNMT3A or TET2 mutations; D&T, DNMT3A and TET2 mutations; MPN, myeloproliferative neoplasm; MGUS, monoclonal gammopathy of unknown significance.
A reported age is at the time of sequencing for CH.
Patients without a BM evaluation is clinically justified because preserved blood counts were counted as not having MDS (n = 10).
Systemic symptoms included at least having one of the following: fatigue, fever, or unintentional weight loss.
Inner ear involvement includes at least having one of the following: vestibular symptoms, hearing loss, tinnitus, or vertigo.
Musculoskeletal includes at least having one of the following: joint pain, arthritis, or tenosynovitis.
Dysplasia is a common finding in VEXAS BM,3 and cytopenia, especially anemia, occurs for several reasons, including inflammation and drug toxicities. To identify cases with ineffective hematopoiesis as a component of the MDS diagnosis, we stratified patients based on significant and persistent cytopenia. Transfusion-dependent anemia was defined as a persistent red blood cell transfusion requirement for ≥8 weeks, and thrombocytopenia was defined as a platelet count <100 × 103/μL. BM biopsy and aspirates performed at the NIH or Mayo Clinic were reviewed by 2 independent pathologists; pathology reports from other facilities were reviewed by 2 independent hematologists. The 2016 World Health Organization diagnostic criteria were used for MDS diagnosis and classification.14 Twenty-four cases met MDS criteria based on the presence of dysplasia, but 10 had no defined cytopenia(s). Therefore, for this study, 14 patients were categorized as having presumed MDS: all with persistent cytopenia(s) and overt dysplasia, with none meeting the MDS diagnosis based solely on increased blasts or genomic alterations (cytogenetic or molecular; supplemental Table 1, available on the Blood website). NIH-02 had only abnormal cytogenetics (46,XY, del[5][q22q33] and del[13][q12q14][16]/46XY[4]) initially and borderline dysplasia, but multiple subsequent bone marrow biopsies also showed persistent dysplasia. Healthy individuals (n = 84; age from 0 to 88 years) were also included in the study as controls. This study was approved by the NIH and Mayo Clinic institutional review boards. All participants provided informed consent. Samples were collected in accordance with the Declaration of Helsinki.
DNA sequencing
Patients and controls were screened for somatic mutations in the peripheral blood (PB) via error-corrected DNA sequencing (ECS) using a customized panel with typical CH genes and UBA1 (VariantPlex ArcherDx; supplemental Table 2). Most samples were collected before any VEXAS treatment; NIH-10 had undergone an autologous stem cell transplant, and 4 patients received MDS-directed therapy before screening (Figure 1A and supplemental Table 1). Libraries were sequenced on the NovaSeq6000 (average coverage of 600× deduplicated reads), and variants with a deduplication ratio >3:1 and variant allele frequency (VAF) >0.5% were included in the analysis. We prospectively assessed VEXAS clonal architecture via single-cell proteogenomic sequencing (DNA and immunophenotyping; scDNA) in fresh samples collected from 7 patients: 3 were included in our retrospective clinical analysis (NIH-16, NIH-48, and NIH-58), and 4 were not (V-001, V-002, V-003, and V-004; supplemental Table 3). Three patients had a paired BM mononuclear cell (BMMNC) sample. scDNA was performed using the Mission Bio Tapestry platform per the manufacturer’s protocols, with minor modifications. Proteogenomic profiles were created with 20 759 BMMNCs and 24 901 PB cells. Representative data derived from healthy controls (female and male, 64 and 58 years old, respectively) and available Mission Bio datasets were used as reference for analysis to characterize cell clusters based on 45 differentially expressed protein surface markers (supplemental Figures 1-2). Details are described in the supplemental Appendix.
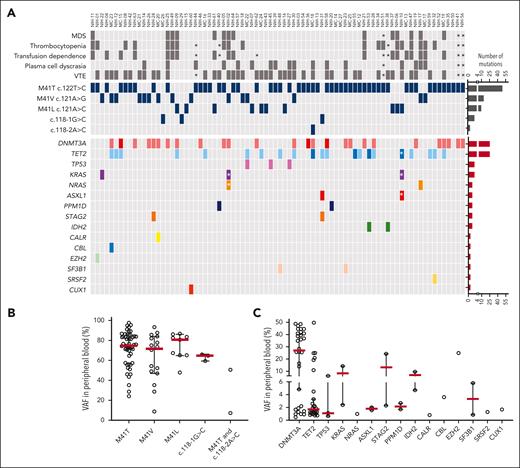
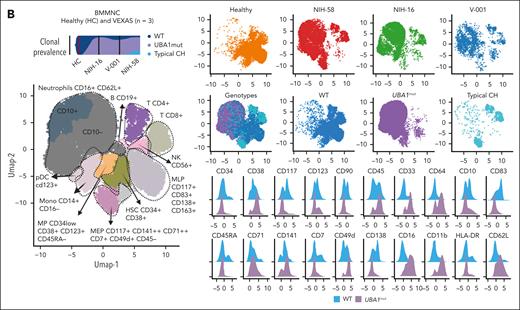
Clonal landscape of VEXAS. (A) Oncoprint of 80 patients screened via ECS based on their ages (ascending order). The clinical characteristics, UBA1 genotype, and the presence of mutations in typical CH genes from each patient are shown. Few patients were found with multiple DNMT3A or TET2 variants, depicted in darker red or blue in the figure, respectively. The number of UBA1 and typical CH mutations are also shown in the panel. Black asterisks represent missing data in retrospective chart reviews. White asterisks represent mutations that were not identified in total blood but in granulocytes of 2 patients (NIH-02 and NIH-10) because these were the only available sample. In NIH-02, the KRAS and NRAS variants were found below the limit of detection of the assay in PB (0.15% and 0.21%, respectively) after being first identified in patient’s granulocytes at VAF around 0.7%. NIH-10 was screened after he had undergone an autologous stem cell transplant; he had a detectable UBA1 mutation at VAF of 11% and variants in ASXL1 p.L823X (VAF = 2%), KRAS p.I24N (VAF = 14%), and 3 TET2 mutations. (B) Median VAF of UBA1 mutations in the PB. Each circle represents a VAF of an UBA1 mutation. Two UBA1 mutations, the p.M41T at and c.118-2A>C, were found in a single patient. Red lines depict a median of values. (C) Median VAF of mutations in typical myeloid cancer genes other than UBA1 (typical CH genes). Each circle represents a VAF of variants identified by ECS. Red lines depict a median of values. (D) Number of mutations in typical CH genes per patient. (E) Frequency of typical CH mutations in VEXAS and healthy controls according to an age range. Number of patients and controls screened with ECS sequencing in each age range is shown in the graph. Typical CH frequency in VEXAS was significantly higher than in age-matched healthy controls. (F) Linear representation of DNMT3A and TET2 with mutations identified in our VEXAS cohort. DNMT3A and TET2 were the most mutated genes in our patients. Each variant is represented by a circle, red if the variant is missense or blue if it is truncated (splicings, stop gains, and frameshifts). Variants at VAF >10% are shown above the gene representation, whereas the ones at VAF <10% are shown below.
DNA methylation and EpiAgeAccel
Normalized methylation data (Illumina 850 Epic Array) from 38 patients with VEXAS and 9 age-matched controls were used to generate a methylation age estimate using 3 different epigenetic clocks: DNAmAge,15 DNAmHannum,16 and DNAmPhenoAge.17 Epigenetic age acceleration (EpiAgeAccel) was calculated as the difference between each patient’s methylation age and their chronological ages, as estimated at the time of sample acquisition. DunedinPACE was used as a DNA methylation biomarker to calculate a pace of aging in VEXAS and controls; a pace of 1 is a reference to an average rate of 1 year of biological aging per year of chronological aging. Participants with faster DunedinPACE have been shown to be at increased risk for mortality.18
Statistics
Patient characteristics were reported as medians and ranges for continuous variables and counts and proportions for categorical variables. Univariate logistic regression was used to quantify the association between baseline and sequencing variables and binary clinical outcomes. P < .05 was considered statistically significant. Kaplan-Meier curves and the Cox proportional hazards models were used to estimate overall survival (OS). Because transfusion-dependent anemia, thrombocytopenia, and CH mutations change over time, the univariate and multivariate time-varying Cox regression models19,20 were used to access the relationships between the risk factors and OS. The study includes 3 dates for each patient: the onset of inflammatory symptoms, the ECS sample date, and the time-to-event date for censoring or death. The data were analyzed using R version 4.0.2.
Results
Patient cohort
The median age of patients (n = 80) at the time of CH screening was 69 years, with a trend toward younger ages in patients with p.M41V and c.118-1G>C genotypes (P = .06; Table 1). The median disease duration was 3.7 years (range, 0.1-20.6 years), and the median length of follow-up after ECS was 0.8 years. Systemic symptoms (fever, fatigue, or unintentional weight loss) followed by skin involvement were the most common inflammatory manifestations. Venous thromboembolism (VTE) was the most common hematologic finding, followed by cytopenia (Table 1).
Clonal landscape of VEXAS syndrome
The UBA1mut p.M41T c.122T>C (n = 52; 65%) was the most frequent, followed by p.M41V c.121A>G (n = 15; 18%), p.M41L c.121A>C (n = 10; 12%), and c.118-1G>C and c.118-2A>C splice site mutations (n = 3; 4%) (Figure 1A-B). One patient had 2 UBA1mut in independent clones: p.M41T and c.118-2A>C, at VAF of 50% and 7%, respectively (Figure 1A-B; supplemental Figure 3). A median UBA1mut VAF in PB was 74% (range, 9%-98%) regardless of the UBA1 genotype, with only 6 patients having UBA1mut at VAF <40% (Figure 1B).
Forty-eight patients (60%) had one (n = 28; 35%) or ≥2 typical CH mutations (n = 20; 25%) concomitant with UBA1mut (Figure 1A,C-D; supplemental Table 4), a frequency much higher than in our healthy age-matched controls (>50% in patients with VEXAS vs 18% in controls older than 40 years; Fisher exact P value <.05; Figure 1E). Clone sizes were also significantly higher in patients with VEXAS than in controls (mean VAF of 14% and 1.6%, respectively). Typical CH mutations largely involved DNMT3A and TET2 (n = 39; 49%): 21 with single or multiple mutations in either DNMT3A (n = 14) or TET2 (n = 7) and 7 with mutations in both genes (Figure 1A). A small subset of patients had somatic mutations in TP53 (n = 3), KRAS (n = 3), NRAS (n = 2), and IDH2 (n = 2), with (n = 11) or without (n = 9) DNMT3A/TET2 mutations.
In total PB, the median VAF of DNMT3A and TET2 mutations was 27% (range, 0.5%-47%) and 1.5% (range, 0.5%-49%; Figure 1C), respectively. Other genes were usually mutated at median VAF <10% (Figure 1C). DNMT3A mutations predominantly occurred in the methyltransferase domain (Figure 1F) and included the recurrent p.R882 hot spot mutations (n = 7; median, VAF = 40%; range, 5%-47%). TET2 mutations were mostly truncating (80%) and were located across the entire coding region (Figure 1F).
Single-cell proteogenomic (scDNA) assessment of VEXAS clonal architecture
We performed scDNA analysis in 7 patients with different clonal profiles, including 3 with paired BMMNC samples and 5 with coexisting UBA1mut and typical CH mutations. The UBA1mut was a sole mutation in 2 patients and branched trajectories were present in 4 of 5 patients with typical CH; in all, the dominant clone was UBA1mut, but the order of consecutive clonal events was variable (Figure 2A). Except in NIH-48 and V-004, a typical CH mutation preceded and cooccurred with UBA1mut in affected cells. Based on the ECS data, typical CH present before UBA1mut selection in a cell had a higher VAF in comparison to typical CH found in UBA1mut subclones or in independent clones (median VAF of 42% vs 1%, respectively; P = .008). Here, clonal expansion bearing typical CH mutations was dependent on their cooccurrence with UBA1mut in single cells and the order of clonal events.
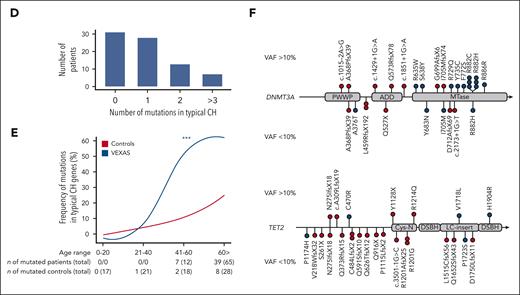
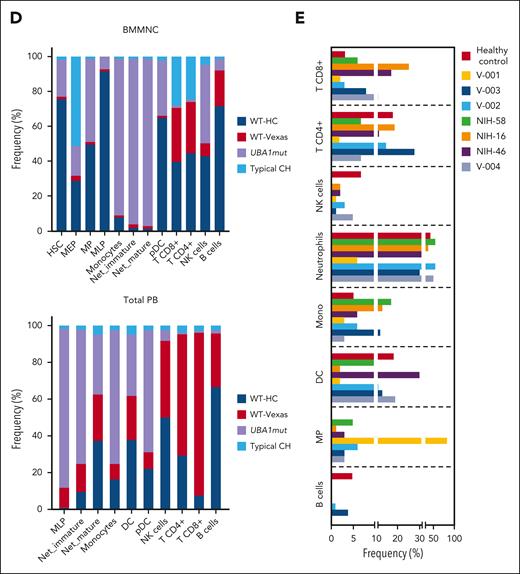
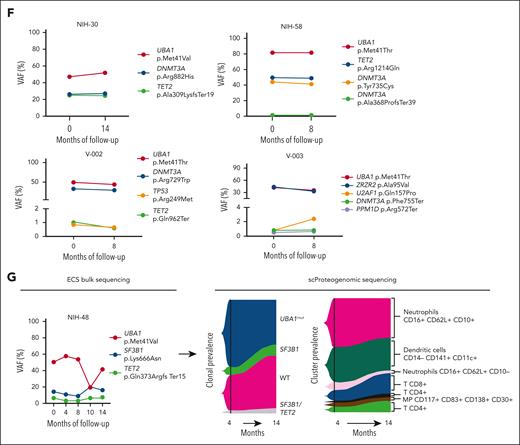
Single-cell proteogenomic analysis of patients with VEXAS. (A) Clonal hierarches in 7 patients with VEXAS. Clones’ genotypes and absolute counts are shown for each patient. Clones with somatic mutations identified via ECS bulk sequencing but not targeted in the single-cell panel are indicated by white asterisks. Although the order of these clonal events is unknown, cooccurrence of mutations in single clones were inferred by their VAF in bulk sequencing and clonal dynamics in serial samples. (B) Multiomics profiles of BMMNC collected from 3 patients with VEXAS. (C) Multiomics profiles of total PB from 7 patients with VEXAS. Panels show the protein uniform manifold approximation and projection (UMAP) with sample types and genotypes, cell clusters with their main protein surface markers used for their characterization, and histograms with expression of different protein surface markers. Representative data from BMNNC and PB cells derived from a healthy control were used as a reference for analysis. (D) Frequency of different clones according to cell clusters in BMMNC and PB samples. Single cells were labeled according to their genotypes as WT, either from the healthy control (WT-HC) or patients with VEXAS (WT-VEXAS), as having an UBA1mut, regardless of cooccurrence with other typical CH, and as having a typical CH independently from UBA1mut. Cells clusters were characterized according to their differentially expressed protein surface markers (normalized reads) when stained with the cocktail of 45 antibodies targeting common blood protein surface markers (TotalSeq-D Heme Oncology Cocktail antibody-oligo conjugate) and processed with the Tapestry protocol (Mission Bio; supplemental Figures 1 and 2). Cell populations in both BMMNC and PB were characterized based on a reference data from healthy samples and available Mission Bio data sets as: HSC (CD34+CD38+CD117+), likely megakaryocyte-erythroid progenitor cells (MEPs; CD38lowCD117+CD141highCD71highCD7+CD45–lineage–), likely myeloid and lymphoid progenitors (MLPs; CD34lowCD38+CD117+CD83+CD138+CD30+CD13+), myeloid progenitors (MPs; CD34low CD38+CD117+CD123+CD45RA–CD141+CD71+CD7+CD33+CD64+), immature neutrophils (Net_immature: Lin–CD16+CD62L+CD10– or CD33high), mature neutrophils (Net_mature: Lin–CD16+CD62L+CD10+), monocytes (mono; CD14+CD16+/−), plasmacytoid dendritic cells (pDCs; CD14–CD123+FcεRIa+), conventional DCs (DCs; CD14–CD141+CD11c+CD11b+), T lymphocytes (CD3+CD8+ or CD4+), B lymphocytes (CD19+), and natural killer cells (NKs; CD3–CD56+CD7+). (E) Frequency of different blood subpopulations identified by scDNA in PB. Frequency of cells assigned as total neutrophils, MPs, T lymphocytes CD4+ or CD8+, NKs, total mono, DCs, and B cells are shown. (F) Clonal dynamics of UBA1mut and typical CH in 4 patients during follow-up. (G) Clonal dynamics of UBA1mut and typical CH in NIH-48 via ECS and single-cell proteogenomic sequencing. Somatic mutations in UBA1, SF3B1, and TET2 were first identified in bulk sequencing. Clonal trajectories elucidated by scDNA showed the presence of 4 independent clones in this patient: a WT, UBA1-mutated (UBA1mut), a SF3B1 p.K666N-mutated (SF3B1) and a SF3B1 clone that subsequently acquired a TET2 p.Q373Rfs mutation (SF3B1/TET2). Frequency of each clone (clone prevalence) and cell clusters based on expression of protein surface markers (cluster prevalence) in samples collected at 4 and 14 months of follow-up are shown.
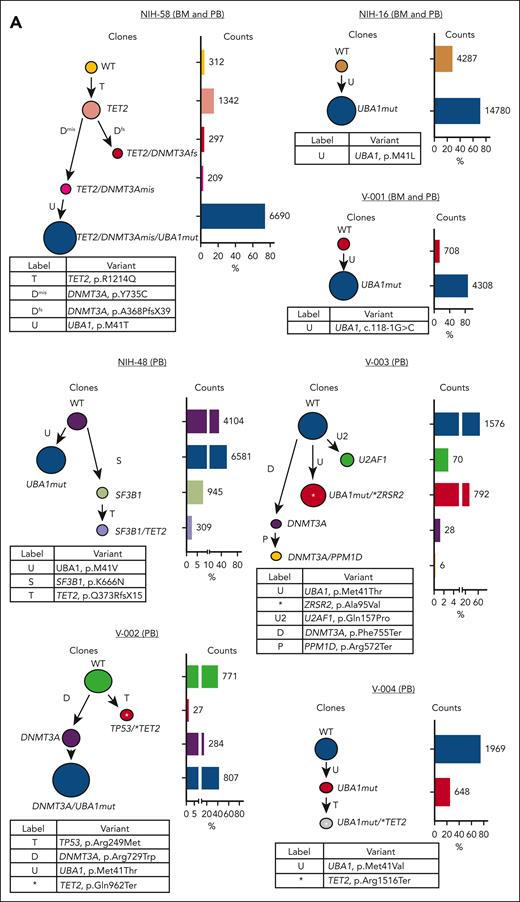
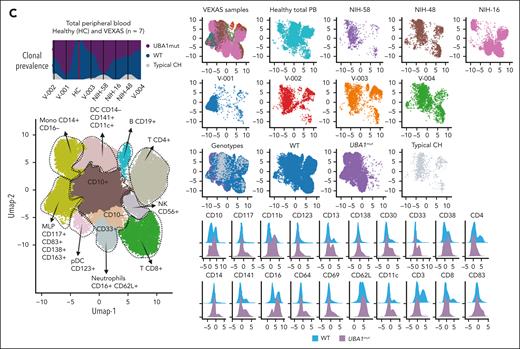
Regardless of cooccurrence with typical CH, there was a striking myeloid bias in UBA1mut cells from both BMMNC and PB profiles (Figure 2B-C). In the BMMNC profile, patients had a decreased pool of hematopoietic stem cells (HSCs; CD34+) and megakaryocyte-erythroid progenitor cells (based on high CD71 and low CD45 expression; supplemental Figure 1). Within the HSC CD34+ compartment, 95% of cells were UBA1mut and these had higher expression of CD38, CD33, and CD64 in comparison with VEXAS CD34+ wild-type (WT) cells (supplemental Figure 4). In addition, patients demonstrated variable counts of myeloid progenitors, monocytes, and dendritic cells, which were >95% UBA1mut. Notably, BMMNC samples had a higher frequency of CD16+CD62L+ neutrophils due to the presence of these vacuolized cells in the Ficoll layer. Similar myeloid bias of UBA1mut cells and immunophenotypic heterogeneity was observed in the PB (Figure 2C-E). Myeloid differentiation was left-shifted with increased early progenitors (CD117+CD83+CD30+CD163+; supplemental Figure 1) and immature neutrophils (CD10– or CD33high) in the PB (Figure 2D).
In both the BM and PB, B-cell and natural killer cell numbers were severely decreased, and a fraction of these cells in the marrow but not in PB were UBA1mut. T cells were >90% WT in both BM and PB, suggesting negative selection of UBA1mut lymphoid progenitors during differentiation and that lymphopoiesis is likely supported by the remaining small WT HSC pool.1 Among patients in whom the UBA1 VAF in the PB was <50% (V-002, V-003, and V-004), there was a higher frequency of WT myeloid cells in both the BM and PB. In 5 patients for whom serial samples were available, both UBA1mut and typical CH dynamics were consistent over 8-14 months of follow-up (Figure 2F). In a single patient serially assessed by scDNA (NIH-48), higher lymphocyte counts were associated with decreased UBA1mut but not typical CH burden, which was unchanged during follow-up (Figure 2G).
Integrated ECS bulk and single-cell proteogenomic sequencing analysis of VEXAS clonal dynamics
Our single-cell data suggest that UBA1mut is the fittest clone in VEXAS, and that increased cell fitness driven by UBA1 loss-of-function may affect the expansion of preexisting typical CH clones. Indeed, there was a large difference in clone sizes for the prevalent DNMT3A and TET2 variants via ECS (Figure 1C). Integrating ECS and single-cell data, clonality in VEXAS followed 2 major patterns, likely dependent on the time of typical CH mutation acquisition in relation to the UBA1mut (Figure 3). Because UBA1 is located on chromosome X and the most affected patients are male, the expected VAF of heterozygous typical CH mutations that precede UBA1mut selection and likely cooccur in single cells is at a ratio of 1:2 or higher, denoted pattern 1. In contrast, when typical CH is detected at a VAFs lower than half of a UBA1mut clone, it may be in a UBA1mut subclone or in an independent clone, and its VAF would depend on its impact on cell fitness. In these cases, a linear correlation between typical CH and UBA1mut VAF would not be expected, denoted pattern 2 (Figure 3A-B). Clonal patterns 1 and 2 were observed in an equal number of patients (n = 24) and correlated with the clonal trajectories from single-cell analysis. DNMT3A mutations were associated with pattern 1, whereas TET2 and other mutations followed clonal pattern 2, suggesting that these are likely second hits preferentially selected in a highly inflammatory environment created by UBA1mut cells or that they are proliferation autonomous. (Figures 1C and 3B).

Characterization of clonal dynamics in VEXAS via integrated ECS bulk sequencing and single-cell proteogenomic analysis. (A) Patterns of clonal trajectories. In VEXAS, increased cell fitness is primarily driven by UBA1 loss-of-function. Considering that UBA1 gene is located on chromosome X and all patients are male, cooccurrence with heterozygous typical CH mutations follow 2 major patterns that can be inferred by their VAF at PB: (1) pattern 1 is seen when typical CH precedes UBA1mut in a cell. Upon emergence of an UBA1 mutation, cells carrying both typical CH and UBA1 expand rapidly. Typical CH and UBA1 likely coexist in the same cell when their VAF follow a linear ratio of 1:2, or higher (Pattern 1). In contrast, pattern 2 is observed when UBA1mut precedes the acquisition of typical CH in the same cell or independently coexist with typical CH clones. In this case, the VAF of typical CH mutations and UBA1mut, which is commonly the dominant clone, follow no linear correlation at PB. (B) Clonal patterns of DNMT3A, TET2, and other typical CH mutations estimated based on their VAFs in the PB. Most DNMT3A mutations follow pattern 1, including the ones in the p.R882 hot spot. In contrast, TET2 and other typical CH mutations follow pattern 2.
Characterization of clonal dynamics in VEXAS via integrated ECS bulk sequencing and single-cell proteogenomic analysis. (A) Patterns of clonal trajectories. In VEXAS, increased cell fitness is primarily driven by UBA1 loss-of-function. Considering that UBA1 gene is located on chromosome X and all patients are male, cooccurrence with heterozygous typical CH mutations follow 2 major patterns that can be inferred by their VAF at PB: (1) pattern 1 is seen when typical CH precedes UBA1mut in a cell. Upon emergence of an UBA1 mutation, cells carrying both typical CH and UBA1 expand rapidly. Typical CH and UBA1 likely coexist in the same cell when their VAF follow a linear ratio of 1:2, or higher (Pattern 1). In contrast, pattern 2 is observed when UBA1mut precedes the acquisition of typical CH in the same cell or independently coexist with typical CH clones. In this case, the VAF of typical CH mutations and UBA1mut, which is commonly the dominant clone, follow no linear correlation at PB. (B) Clonal patterns of DNMT3A, TET2, and other typical CH mutations estimated based on their VAFs in the PB. Most DNMT3A mutations follow pattern 1, including the ones in the p.R882 hot spot. In contrast, TET2 and other typical CH mutations follow pattern 2.

Clinical outcomes in VEXAS. (A) Criteria used for presumed MDS diagnosis in VEXAS. (B) Predictors of survival using a univariate time-varying Cox model from the onset of symptoms. Variables that were significantly associated with an increased HR for mortality are highlighted by their P value (<.05). (C) Univariate logistic regression for MDS. Variables that were significantly associated with MDS are highlighted by their P value (<.05). (D) Epigenetic age and age acceleration of patients with VEXAS. Global DNA methylation was used to calculate patients’ epigenetic ages according to Horvath's clock. Patients were grouped based on their typical CH status: no typical CH, D/T (DNMT3A or TET2) mutations, D&T (DNMT3A and TET2) mutations, and mutations in other myeloid cancer genes regardless of having DNMT3A/TET2 mutations.
Clinical outcomes in VEXAS. (A) Criteria used for presumed MDS diagnosis in VEXAS. (B) Predictors of survival using a univariate time-varying Cox model from the onset of symptoms. Variables that were significantly associated with an increased HR for mortality are highlighted by their P value (<.05). (C) Univariate logistic regression for MDS. Variables that were significantly associated with MDS are highlighted by their P value (<.05). (D) Epigenetic age and age acceleration of patients with VEXAS. Global DNA methylation was used to calculate patients’ epigenetic ages according to Horvath's clock. Patients were grouped based on their typical CH status: no typical CH, D/T (DNMT3A or TET2) mutations, D&T (DNMT3A and TET2) mutations, and mutations in other myeloid cancer genes regardless of having DNMT3A/TET2 mutations.
CH and OS
The OS at 10 years was 60% (supplemental Figure 5). The most frequent causes of death were infections and uncontrolled inflammation (supplemental Table 5). Transfusion-dependent anemia, thrombocytopenia (<100 × 103/μL), and associated MDS diagnosis (Figure 4A) conferred an adverse prognosis (Figure 4B; supplemental Table 6). The presence of typical CH mutations also showed an increased risk of mortality (hazard ratio [HR] = 7.2; 95% confidence interval [CI], 2-21; P < .001). To further assess this association, we divided the patients into 4 subgroups: with DNMT3A or TET2 mutations alone (n = 19), concomitant DNMT3A and TET2 mutations (n = 7), somatic mutations in other typical CH genes regardless of DNMT3A/TET2 mutations (others; n = 20), and no typical CH mutations (n = 31). We found that the presence of either DNMT3A or TET2 mutations nearly doubled the risk of death (HR = 13; 95% CI: 4-43; P < .001). In contrast, the presence of both DNMT3A and TET2 mutations (HR = 4.6; 95% CI, 0.5-37; P = .161) and other mutations (HR = 1.8; 95% CI, 0.1-19; P = .64) was associated with a modest increase in mortality but was not statistically significant (Figure 4B; supplemental Table 6). Mortality risk was also higher when typical CH mutations were present at VAF >2% (HR = 11.5; 95% CI, 3-42; P < .001) and in both comutation patterns, particularly pattern 1 (HR = 11; 95% CI, 3-45; P < .001). Conversely, the UBA1 VAF or genotype did not predict mortality (Figure 4B). Among all DNMT3A/TET2 mutations, DNMT3A p.R882 conferred the highest risk of death (HR = 14; 95% CI, 2.7-75; P = .002) but was not associated with MDS diagnosis (supplemental Tables 6 and 9). In multivariate analysis, the patients’ age at screening and the presence of either DNMT3A or TET2 mutations predicted a higher risk of mortality (supplemental Table 7).
Genotype-phenotype associations of typical CH and UBA1 mutations
There was no difference in inflammatory phenotypes among UBA1 genotypes, except for periorbital edema, which was absent in those with the p.M41L variant. Typical CH mutations also associated with periorbital edema (46% vs 13%; P < .01). Hematologic manifestations did not differ between patients with or without typical CH mutations or with mutational VAF (Table 1).
Clinically significant cytopenia(s), defined as transfusion-dependent anemia (n = 18 of 77) and thrombocytopenia <100 × 103/μL /μL (n = 19 of 77) were present in 23% and 25% of patients after a median of 4 and 3.4 years from initial inflammatory symptoms, respectively, with 11 cases having both (Figure 4A). Presumptive MDS was diagnosed in 14 patients (18%) at a median age of 4.9 years (range, 1.6-10.2 years) after initial symptoms of VEXAS. Transfusion-dependent anemia and thrombocytopenia were strongly associated with a diagnosis of MDS (Figure 4C). The p.M41L UBA1 genotype was associated with MDS, with no increase of typical CH mutations in this genotype (Figure 4C). No patients with MDS had excess blasts (≥5%); all were categorized as very low-to-intermediate risk by IPSS-R, most had normal karyotypes, and about half had typical CH mutations, mostly in DNMT3A/TET2 (supplemental Table 1). Plasma cell dyscrasias were diagnosed in 22% of the patients (multiple myeloma [3%] and monoclonal gammopathy of unknown significance [19%]) and VTE occurred in 57% of the patients, in 18% recurrently. Abnormal karyotype, UBA1mut VAF or genotype, typical CH mutations, and comutation patterns did not correlate with MDS, plasma cell dyscrasia diagnosis, cytopenia, or VTE (supplemental Tables 8-11).
EpiAgeAccel in VEXAS
Because VEXAS is an age-related disease frequently presenting with typical CH involving epigenetic regulator genes, we assessed global DNA methylation changes to estimate biological age and EpiAgeAccel based on 3 different clocks, with concordant results (supplemental Table 12). By using the Horvath methylation clock, nearly all studied samples (90%, 34 of 38) showed EpiAgeAccel, with a median of 11 years (range, 7-23), regardless of clone sizes. The estimated pace of aging based on DunedinPACE was also faster in VEXAS than that in controls (1.38 vs 0.96; P < .001; supplemental Figure 6).
There was no correlation between EpiAgeAccel and the UBA1 genotype (P = .97). Patients with either DNMT3A or TET2 mutations had significantly higher median epigenetic/biological age (95 ± 11 years) and EpiAgeAccel (22 ± 9 years) compared with patients without typical CH, DNMT3A/TET2 comutations, or other typical CH mutations (Figure 4D). In this study, perhaps limited by a small sample size, EpiAgeAccel did not predict for mortality (Figure 4B). EpiAgeAccel was estimated for 4 of 14 patients with MDS (NIH-11, NIH-17, NIH-21, and NIH-25), and results were comparable with patients with either DNMT3A or TET2 mutations (average of EpiAgeAccel of 21 years); two of those patients had DNMT3A mutations with VAF >40% (supplemental Table 1).
Discussion
Patients with VEXAS have a high frequency (60%) of typical CH mutations, far greater than in older, healthy controls in our study, and from previous reports (after accounting for the difference in the limit of detections).21-23DNMT3A and TET2 were the most commonly mutated typical CH genes in VEXAS, as in healthy individuals and in other benign diseases.23,24 Therefore, the clonal landscape of VEXAS is more representative of an inflammatory disease (typically enriched in DNMT3A/TET2 mutations) as opposed to myeloid neoplasms, in which somatic mutations in prognostically adverse genes are common; as demonstrated in our study, these mutations were less frequent in patients with VEXAS even with profound cytopenia(s) and BM dysplasia (supplemental Figure 7).7,8,24-26
Preferential selection of DNMT3A mutant clones has been described in other immunologic diseases,7,8,25,27,28 and the presence of TET2 mutations has been linked to low-grade inflammation.29 Although causal directionality remains uncertain, these studies imply that the clonal dominance of DNMT3A/TET2 is due to cell-intrinsic survival in an inflammatory environment; these clones may further contribute to and propagate inflammation. Our clinical and molecular data suggest that typical CH in VEXAS is either shaped by cell-intrinsic UBA1-driven growth advantage or positive selection in such a highly inflammatory environment. Cooccurrence of preexisting typical CH with UBA1mut, primarily DNMT3A and TET2 mutations in pattern 1, is in concordance with the high VAF of these mutations in PB in the absence of a hematologic phenotype.26,30 In a longitudinal study of CH, DNMT3A or TET2 mutations had slower growth rates in comparison to clones bearing other CH mutations, suggesting a restricted impact on cell fitness (including DNMT3A p.R882).24,31 Low VAF TET2 clones, mostly in clonal pattern 2 and largely detected because of the use of highly sensitive ECS methodology, may be biomarkers of chronic inflammation. Typical CH in classical MDS-associated genes, such as U2AF1, TP53, and SF3B1, was only detected in a few patients; it was not associated with hematologic manifestations in our cohort of patients with VEXAS.
Despite typical CH and different clonal patterns did not explain disease heterogeneity or severity, we cannot rule out that these can still contribute toward overall clonal growth by propagating inflammation and by modulating the secondary activation of immune cells, as recently shown in DNMT3A-R882H single cells.32 Clonal pattern 1 increased the risk for mortality 14× when compared to pattern 2, in which the mortality increased 5 times (Figure 4B). We observed a higher mortality risk and increased EpiAgeAccel among patients with DNMT3A or TET2 mutations alone but not in those with both mutations. Although limited by the small sample size, this finding may reflect the contrasting epigenetic functions of these mutations in shaping hematopoiesis, as described recently.33 In healthy individuals with DNMT3A/TET2 mutations (age-related CH), epigenetic age acceleration has been observed with lower median differences between chronological age and biological age (6 years in age-related CH vs up to 23 years in our VEXAS cohort).34,35
Clinically, typical CH, transfusion-dependent anemia, thrombocytopenia, and MDS diagnosis correlated with a risk of death, whereas only thrombocytopenia, transfusion-dependent anemia, and UBA1 p.M41L associated with MDS diagnosis (Figure 4D). VEXAS was discovered using a genotype-first strategy,1 and now this multifaceted disease is diagnosed in a variety of rheumatologic and related inflammatory syndromes. A difficulty in VEXAS is classifying the frequent cytopenias, whether because of primary BM failure or secondary to ongoing inflammation.36 Clearly, a subset of patients with VEXAS have ineffective hematopoiesis, and many have dysplasia in marrow evaluation in one or more lineages, meeting the most basic criteria for MDS (marrow failure, dysplasia, and peripheral cytopenia) per the World Health Organization, 2016. However, given the absence of a classical somatic mutational profile and the relative lack of progression to higher grade MDS/AML commonly observed in classical MDS, we provide evidence that UBA1mut MDS represents a distinct clinical and molecular entity. When ineffective hematopoiesis is used as a component of MDS diagnosis, the MDS prevalence rate was 18% in our study, lower than that previously reported at 25% to 50%.1,2,5 MDS associated with VEXAS occurs late in the disease course (median, 4 years) and is lower-risk on IPSS-R scoring, a heterogenous category in which survival is determined by cytopenic complications as well as leukemic transformation rates. Specific to VEXAS, severe systemic inflammation and immunosuppressive drug-related complications are competing risks for early mortality.
Our data have implications for future CH studies, particularly in the setting of age-related disorders and chronic inflammation. Cooccurrence of mutations in clones may affect intrinsic cell fitness and the expansion of mutations that may have otherwise remained stable. CH may also guide therapeutic interventions in VEXAS, as we found an increased risk for mortality in patients with typical CH; targeting the UBA1mut clone with allogenic BM transplantation or novel rationally derived therapies could be considered earlier in the disease course.37 The biological aging in VEXAS might be an important biomarker for understanding allogenic transplant eligibility and predicting transplant-related outcomes.
A limitation of our work due to the fragility of blood cells from patients with VEXAS, was the restricted use of frozen cells for retrospective single-cell analyses. In addition, the sample size, the short time to follow-up after sequencing, and the retrospective design due to the recent description of this disease less than 2 years ago, limited our clinical outcomes analysis. Our study findings should be prospectively confirmed in larger data sets and studies. In contrast to a prior study from our group,38 we did not find any association between UBA1 genotype and survival (supplemental Figure 5). Although the cohorts from each study partially overlapped, the differences are likely explained by differences in study designs: our current cohort had a shorter follow-up time from symptom onset, and there was a differential number of deaths in nonoverlapping patients.38
In summary, we define the spectrum of typical CH and their clonal trajectories at the single-cell level in patients with UBA1mut and demonstrate their impact on relevant clinical outcomes. Typical CH was observed in 60% of patients, with DNMT3A and TET2 mutations dominating the clonal landscape at discrepant VAF in PB. Integrated analysis of the bulk sequencing in PB and the scDNA sequencing allowed us to identify different clonal patterns likely caused by the order of clonal events in relation to UBA1mut, which was reflected in the typical CH expansion in PB as a measure of VAF. Clinically, although typical CH mutations do not affect phenotypic heterogeneity or disease severity, their presence as well as cytopenia(s) may identify patients with VEXAS with an increased mortality risk. Our study supports UBA1mut as causal for myeloid clonal expansion and as responsible for both the inflammatory and hematologic phenotypes in VEXAS.
Acknowledgments
The authors thank all patients and their families, the DNA Sequencing and Genomics Core from the National Heart, Lung, and Blood Institute, Alan Hoofring from the National Institutes of Health Medical Arts Design Section, and the Mission Bio team for their assistance. Some figures were created using BioRender.com.
This research was funded by the Intramural Research Program of the National Heart, Lung, and Blood Institute, the National Institute of Arthritis and Musculoskeletal and Skin Diseases, and the National Human Genome Research Institute. The authors acknowledge the Mayo Clinic Center for Individualized Medicine for funding the EpiAgeAccel estimates. This work was also supported in part by the São Paulo Research Foundation (FAPESP) grant numbers 13/08135-2 and 16/12799-1 (RTC).
Authorship
Contribution: F.G.-R., Y.K., N.S.Y., D.B.B., B.A.P., and M.M.P. conceptualized and designed the study, and interpreted the results, wrote, and edited the manuscript; J.F. performed and interpreted the DNA methylation experiments; F.G.-R., D.H., L.A., and S.K. performed and analyzed ECS experiments; F.G.-R. and T.L. interpreted the scDNA results; R.S., X.M., H.A., P.C.G., and C.O.W. performed statistical analysis for clinical outcomes; C.F., M.J.K., K.J.W., A.M., K.B., Z.X., A.K.O., D.V., M.F., R.G., L.W., T.K., K.R., H.O., S.R., I.D., E.M.G., R.T.C., D.L.K., P.C.G., N.S.Y., D.B.B., B.A.P., and M.M.P. provided clinical care; and K.R.C. provided histopathological evaluation for patients seen in the hematology clinic.
Conflict-of-interest disclosure: The authors declare no competing interests.
Correspondence: Bhavisha A. Patel, 10 Center Dr, Building 10-CRC, Room 3E-5140, Bethesda, MD 20892; e-mail: bhavisha.patel@nih.gov.

This feature is available to Subscribers Only
Sign In or Create an Account Close Modal