

Key Points
Mutations in 7 genes independently predict OS in distinct cytogenetic groups of patients with AML aged ≥60 years and treated intensively.
We report and validate a simple genetic model to identify older patients with AML with very good, intermediate, or poor outcome with 7 + 3.

Abstract
To design a simple and reproducible classifier predicting the overall survival (OS) of patients with acute myeloid leukemia (AML) ≥60 years of age treated with 7 + 3, we sequenced 37 genes in 471 patients from the ALFA1200 (Acute Leukemia French Association) study (median age, 68 years). Mutation patterns and OS differed between the 84 patients with poor-risk cytogenetics and the 387 patients with good (n = 13), intermediate (n = 339), or unmeasured (n = 35) cytogenetic risk. TP53 (hazards ratio [HR], 2.49; P = .0003) and KRAS (HR, 3.60; P = .001) mutations independently worsened the OS of patients with poor-risk cytogenetics. In those without poor-risk cytogenetics, NPM1 (HR, 0.57; P = .0004), FLT3 internal tandem duplications with low (HR, 1.85; P = .0005) or high (HR, 3.51; P < 10−4) allelic ratio, DNMT3A (HR, 1.86; P < 10−4), NRAS (HR, 1.54; P = .019), and ASXL1 (HR, 1.89; P = .0003) mutations independently predicted OS. Combining cytogenetic risk and mutations in these 7 genes, 39.1% of patients could be assigned to a “go-go” tier with a 2-year OS of 66.1%, 7.6% to the “no-go” group (2-year OS 2.8%), and 3.3% of to the “slow-go” group (2-year OS of 39.1%; P < 10−5). Across 3 independent validation cohorts, 31.2% to 37.7% and 11.2% to 13.5% of patients were assigned to the go-go and the no-go tiers, respectively, with significant differences in OS between tiers in all 3 trial cohorts (HDF [Hauts-de-France], n = 141, P = .003; and SAL [Study Alliance Leukemia], n = 46; AMLSG [AML Study Group], n = 223, both P < 10−5). The ALFA decision tool is a simple, robust, and discriminant prognostic model for AML patients ≥60 years of age treated with intensive chemotherapy. This model can instruct the design of trials comparing the 7 + 3 standard of care with less intensive regimens.
Medscape Continuing Medical Education online
In support of improving patient care, this activity has been planned and implemented by Medscape, LLC and the American Society of Hematology. Medscape, LLC is jointly accredited by the Accreditation Council for Continuing Medical Education (ACCME), the Accreditation Council for Pharmacy Education (ACPE), and the American Nurses Credentialing Center (ANCC), to provide continuing education for the healthcare team.
Medscape, LLC designates this Journal-based CME activity for a maximum of 1.00 AMA PRA Category 1 Credit(s)™. Physicians should claim only the credit commensurate with the extent of their participation in the activity.
Successful completion of this CME activity, which includes participation in the evaluation component, enables the participant to earn up to 1.0 MOC points in the American Board of Internal Medicine’s (ABIM) Maintenance of Certification (MOC) program. Participants will earn MOC points equivalent to the amount of CME credits claimed for the activity. It is the CME activity provider’s responsibility to submit participant completion information to ACCME for the purpose of granting ABIM MOC credit.
All other clinicians completing this activity will be issued a certificate of participation. To participate in this journal CME activity: (1) review the learning objectives and author disclosures; (2) study the education content; (3) take the post-test with a 75% minimum passing score and complete the evaluation at http://www.medscape.org/journal/blood; and (4) view/print certificate. For CME questions, see page 585.
Disclosures
Associate Editor Andrew Roberts, CME questions author Laurie Barclay, freelance writer and reviewer, Medscape, LLC, and the authors declare no competing financial interests.
Learning objectives
Upon completion of this activity, participants will be able to:
- 1.
Assess the oncogenetic predictors of short-term (remission) and long-term (overall survival; OS) benefit of intensive chemotherapy in patients aged at least 60 years who have acute myeloid leukemia, based on the ALFA1200 cytogenetic and gene sequencing study
- 2.
Evaluate the development and validation of a simple decision model accounting for cytogenetics and mutations that reproducibly identified patients aged at least 60 years who have acute myeloid leukemia and who had significant OS differences across multiple cohorts, based on the ALFA1200 cytogenetic and gene sequencing study
- 3.
Determine the clinical implications of a classification predicting OS of patients aged at least 60 years with acute myeloid leukemia treated with standard intensive 7+3 chemotherapy, based on the ALFA1200 cytogenetic and gene sequencing study
Release date: August 19, 2021; Expiration date: August 19, 2022
Introduction
Acute myeloid leukemia (AML) is mostly diagnosed in patients ≥60 years of age.1 Recent improvements in survival have been confined to younger adults with AML.2 Intensive chemotherapy, with or without allogeneic stem cell transplantation (HSCT), remains the standard of care of AML for all adults, including older, fit patients.3,4
Recurrent cytogenetic and genetic lesions are key prognostic factors in patients with AML treated intensively, but the prognostic value of oncogenetic lesions has mostly been studied in younger adults.5-8 Yet, major interactions occur between age, oncogenetics, and treatment outcome.9-12 The genomic landscape of AML in older patients also differs from that in younger adults.9,13-16 After earlier studies focusing on the prognostic value of NPM1 orFLT3 mutations in older patients with AML,17-21 several studies, including those conducted by our group, have interrogated the prognostic value of a broader spectrum of recurrent genetic lesions in this population.22-24 However, none of these studies reproducibly identified subsets with patients with outcomes contrasting enough to guide upfront decisions between intensive chemotherapies and alternative investigational approaches.
In recent years, 7 + 3-based induction chemotherapy has been increasingly challenged by less intensive options, notably the combination of hypomethylating agents and venetoclax.16 To design future randomized studies of intensive and less intensive therapies in fit older patients with AML, specific decision tools must be developed to identity the minority of patients in whom 7 + 3 is unequivocally beneficial (“go-go”) or futile (“no-go”) among most older, fit patients with AML (“slow-go” group).
In this study, we leveraged the results of a 37-gene panel in 471 patients with AML aged ≥60 years and treated with intensive chemotherapy in the prospective, multicenter, ALFA1200 study (registered at www.clincialtrials.gov as #NCT01966497)24 to design a very simple 3-tier decision tool, which we validated in 3 independent cohorts.
Patients and methods
Patients
Patients aged ≥60 years with newly diagnosed AML (excluding acute promyelocytic leukemia and Philadelphia chromosome–positive AML), AML secondary to myelodysplastic syndromes (but not myeloproliferative neoplasms) or therapy-related AML (with ≥2 years remission) and an ECOG performance status ≤3, eligible for intensive chemotherapy, from 30 ALFA (Acute Leukemia French Association) centers were prospectively enrolled from September 2012 through June 2016 after providing informed consent. The study was conducted according to current ethics regulations, after approval of the study design by the French Ministry of Health Ethic Committee (“Comité Consultatif sur le Traitement de l'Information en Matière de Recherche dans le Domaine de la Santé”) and of data management by the National Commission for Information Technology and Liberties (“Commission Nationale de l'Informatique et des Libertés”).
We report the extended analysis of a 37-gene panel of the 471 ALFA1200 patients whose samples were sent at their enrollment to the ALFA Central Laboratory (Lille University Hospital, C.P.) for gene sequencing. Detailed information on the global cohort and CONSORT diagram and the full list of investigators have been published.24
Treatment
Patients received a 7 + 3-based induction course including idarubicin (12 mg/m2 per day, days 1-3) and cytarabine as continuous infusions (200 mg/m2 per day, days 1-7). Patients who did not achieve complete remission (CR) or CR with incomplete platelet recovery (CRp)25 could receive a salvage course consisting of intermediate-dose cytarabine boluses (1.5 mg/m2 every 12 hours on days 1, 3, and 5, with dose reduction to 1 mg/m2 per 12 hours in patients aged ≥70, and further dose adaptation based on serum creatinine levels). Patients in CR/CRp received 2 such cytarabine bolus courses as consolidation. Details on HSCT eligibility have been published.24
AML genetics
Cytogenetics including standard metaphase karyotyping and fluorescent in situ hybridization was performed locally and centrally reviewed by the ALFA cytogenetics reference laboratory (Versailles University Hospital; author C.T.) for the present study. Cytogenetic risk was stratified per current European LeukemiaNet (ELN) guidelines (supplemental Table 1, available on the Blood Web site). Molecular genetics was performed by targeted sequencing of a 37-gene panel (supplemental Table 2) on bone marrow or peripheral blood samples collected at inclusion. Technical details are provided in the supplemental Methods.
Genotyping of FLT3 internal tandem duplications (FLT3-ITDs) was performed by fragment analysis, as previously published,26 and expressed as the ratio of ITD to wild-type. Because of technical limitations of our sequencing technology, the ASXL1 (NM_015338) c.1934dup mutational hotspot was investigated for all patients by fragment technique and confirmed by Sanger sequencing.27 CEBPA gene mutations were also sought with Sanger sequencing.28
Knowledge bank predictions
Of the 100 variables required for the estimation of prognosis based on the multistage model proposed by Gerstung et al,29 28 were not available in our cohort, including 4 clinical (hemoglobin peripheral blasts and lactate dehydrogenase baseline values, and presence of splenomegaly) and 24 genetic variables (ATRX, BRAF, CBLB, CDKN2A, CREBBP, CUX1, EP300, FBXW7, GNAS, IKZF1, KDM5A, KDM6A, MLL2, MLL3, MLL5, MYC, NF1, PRPF40B, PTEN, RB1, SF1, SF3A1, SH2B3, and U2AF2). After imputation of missing data using the 1540-patient AMLSG (AML Study Group) knowledge bank (KB), 5-year prediction of overall survival was performed as previously described.30
Validation cohorts
Information on the 3 validation cohorts is provided in the supplemental Methods, and their baseline characteristics are reported in supplemental Table 3.
Statistical analyses
Continuous and categorical variables are summarized with medians and ranges or numbers and percentages. For graphical displays of proportions, 95% confidence intervals (CIs) derived from binary logistic regressions are shown. Group comparisons of dichotomic variables and continuous variables are made with Fisher’s exact and Mann-Whitney tests, respectively. Overall (OS) and relapse-free (RFS) survivals are estimated with the Kaplan-Meier method from the data of trial inclusion until death or last contact (OS) or death, relapse, or last contact (RFS). Group differences for censored outcomes are calculated with log-rank tests.
Given the number of genes tested, variable selection for multivariate Cox models was based on Lasso (least absolute shrinkage and selection operator)-penalized regression, using the 1 standard error rule, with the R package glmnet.31 In datasets with a large number of variables, this method is more robust than conventional sequential methods (eg, backward selection) for selecting the variables leading to the model with optimal interpretability (ie, lower number of variables) and prediction accuracy.32 The final Cox model was inspected for interactions and for collinearity with variance inflation factors, retaining the conventional variance inflation factor threshold of 4 as indicative of unacceptable collinearity.33 Collinearity (ie, a strong correlation between predictors in a model) does not affect the overall predictive power of the model, but may lead to spurious estimations of an individual predictor’s contribution to the model. The proportional hazards assumption was verified by graphic inspection and testing of scaled Schoenfeld residuals.34 Harrell’s concordance indexes from Cox models were computed and tested with the R package survcomp.35 The C-index metric allows for global assessment of a Cox model prognostic performance, accounting for both occurrence and timing of events, where values of 0.5 and 1 indicate random and perfect predictions, respectively.36,37 Agreement between classifications was estimated with Cohen’s κ.38 All analyses were performed with R version 3.5.3 (www.R-project.org).
Results
Baseline characteristics of the study population
From September 2012 through June 2016, 509 patients were enrolled in the ALFA1200 study. The 471 (92%) patients whose samples were sent at enrollment for centralized genotyping constituted the study population. Median age was 68 years and 390 (82.8%) had clinically defined de novo AML. Median white blood cell (WBC) count was 5.3 × 10⁹/L (range, 0.3 × 10⁹/L to 546.6 × 10⁹/L). Bone marrow blasts were ≥30% in 380 (80.7%) patients. Three hundred forty-one (72.4%) achieved CR/CRp after 1 or 2 courses (Table 1). Of 279 patients deemed eligible for transplant, 131 patients were transplant recipients, including 87 in first CR. With a median follow-up of 44.8 months, there were 207 relapses and 318 deaths, leading to a median RFS and OS of 14.8 and 21.2 months, respectively.
Characteristics of the study cohort
| Variable | n or median | % or range |
|---|---|---|
| Sex | ||
| Female | 204 | 43.3 |
| Male | 267 | 56.7 |
| Age, y | 68 | 60-85 |
| ECOG performance status | ||
| 0 | 205 | 43.5 |
| 1 | 200 | 42.5 |
| 2 | 52 | 11 |
| 3 | 9 | 1.9 |
| NA | 5 | 1.1 |
| HCT comorbidity index | ||
| 0 | 354 | 75.2 |
| 1 | 108 | 22.9 |
| NA | 9 | 1.9 |
| Type of AML | ||
| De novo | 390 | 82.8 |
| Post–MDS | 68 | 14.4 |
| Treatment related | 13 | 2.8 |
| WBC, ×109/L | 5.3 | 0.3-546.6 |
| Cytogenetic risk* | ||
| Good | 13 | 2.8 |
| Intermediate | 339 | 72 |
| Poor | 84 | 17.8 |
| NA | 35 | 7.4 |
| ELN2017 | ||
| Favorable | 133 | 28.2 |
| Intermediate | 129 | 27.4 |
| Adverse | 195 | 41.4 |
| NA | 14 | 3 |
| Follow-up, months (IQR) | 44.8 | 43.0-49.9 |
| CR/CRp | ||
| After 1 course | 311 | 66 |
| After 2 courses | 30 | 6.4 |
| No | 130 | 27.6 |
IQR, interquartile range; MDS, myelodysplastic syndrome; NA, not available.
Defined in supplemental Table 1, with details in supplemental Table 4.
Oncogenetic landscape
Cytogenetic risk was good, intermediate, poor, and not available in 13 (2.8%), 339 (72.0%), 84 (17.8%), and 35 (7.4%) patients, respectively. Details on cytogenetic groups are shown in supplemental Table 4. Among the 37 sequenced genes, 19 lesions in 17 genes were found in at least 5% of cases (supplemental Figure 1A). The most frequent lesions included DNTM3A (28.7%), NPM1 (27.0%), TET2 (21.0%), and FLT3-ITD (18.7%) mutations. The allele ratio (mutated/wild-type) of FLT3-ITDs was ≥0.5 in 21 of 88 (23.9%) patients with FLT3-ITD. The median number of mutations was 3 (range, 1-10). Only 290 patients (61.6%) could be assigned unambiguously to oncogene-defined subgroups as defined by Papaemmanuil et al in an all-ages cohort,7 the most frequent being NPM1, TP53-aneuploidy, and chromatin-spliceosome (supplemental Figure 1B). There were marked differences between the mutation spectrum of patients with poor-risk cytogenetics compared with good/intermediate risk cytogenetics, with signification overrepresentation of TP53, KRAS, SETBP1, ETV6, and CALR mutations (all P < .05) contrasting with a significant underrepresentation of NPM1, DNMT3A, FLT3-ITD, IDH2-R140, and IDH2-R172 mutations in patients with poor-risk cytogenetics (Figure 1A). ELN 2017 risk was favorable, intermediate, and adverse in 133 (28.2%), 129 (27.4%), and 195 (41.4%) patients, respectively, but remained unavailable because of missing cytogenetics and lack of a classifying mutation in 14 (3.0%) patients.
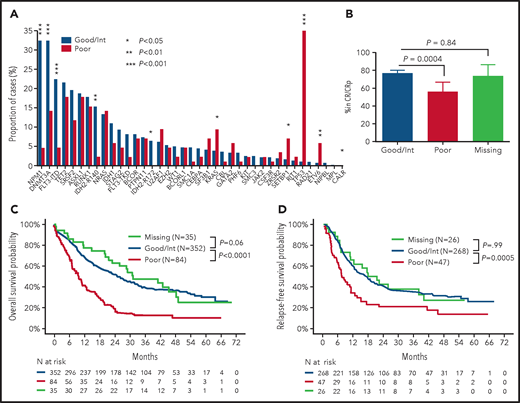
Differences in mutation pattern and outcome according to cytogenetic risk. (A) Mutation pattern in patients with favorable/intermediate risk cytogenetics (n = 352) vs adverse cytogenetics (n = 84). P values from Fisher’s exact test. (B) Rates of CR/CRp at 2 courses in patients with good/intermediate (n = 352), poor (n = 84), or missing (n = 35) cytogenetics with 95% CIs. P values from Fisher’s exact test. OS (C) and RFS (D) according to cytogenetic risk. P values from log-rank tests.
Differences in mutation pattern and outcome according to cytogenetic risk. (A) Mutation pattern in patients with favorable/intermediate risk cytogenetics (n = 352) vs adverse cytogenetics (n = 84). P values from Fisher’s exact test. (B) Rates of CR/CRp at 2 courses in patients with good/intermediate (n = 352), poor (n = 84), or missing (n = 35) cytogenetics with 95% CIs. P values from Fisher’s exact test. OS (C) and RFS (D) according to cytogenetic risk. P values from log-rank tests.
Impact of cytogenetics on outcome
Two hundred and sixty-eight of 352 (76.1%) patients with good or intermediate cytogenetic risk achieved CR/CRp after 1 or 2 courses, compared with 47 of 84 (56.0%) patients with poor-risk cytogenetics (P = 0.0004; Figure 1B). OS and RFS were also markedly different between cytogenetic subgroups, with median OS and RFS of 25.0 and 16.8 months in patients with good/intermediate-risk cytogenetics compared with 9.5 and 7.1 months in patients with poor-risk cytogenetics, respectively (P < 10−4 and P = .0005, respectively; Figure 1C-D). These major differences in mutation spectrum, short- and long-term outcome between cytogenetic groups prompted us to investigate the prognosis of gene mutations in an oncogenetic hierarchy stemming from cytogenetic groups. The 35 patients with missing cytogenetics had a CR rate of 74.3%, median OS and RFS of 31.0 and 19.3 months, without significant difference from patients with favorable/intermediate cytogenetics (CR, P = .84; OS, P = .60; RFS P = .99). We therefore grouped patients into poor (n = 84) and non–poor (favorable/intermediate/missing; n = 387) cytogenetic risk for all further analyses. Of note, although among those 387 patients without poor-risk cytogenetics there was a trend toward better outcome in patients with normal karyotype than in those with intermediate risk aneuploid karyotype (supplemental Figure 2), further cytogenetic stratification beyond the dichotomic poor-risk vs other classifiers did not affect our multivariate survival analyses (data not shown).
Molecular predictors of CR in cytogenetic groups
In univariate analysis, mutations in NPM1, IDH2-R140, and DNMT3A were associated with higher CR/CRp rates after 1 or 2 courses, and mutations in TET2, NRAS, RUNX1, ASXL1, SETBP1, and ETV6 to lower CR/CRp rates in the 387 patients with non–adverse cytogenetics (all P < .05; supplemental Figure 3A). In the 84 patients with adverse cytogenetics, no single gene mutation significantly influenced CR/CRp rate (supplemental Figure 3B). We next performed multivariable logistic regression accounting for all gene mutations and clinical covariates (age, sex, secondary AML, and WBC count) in each of the 2 cytogenetic strata. After variable selection by penalized regression, NPM1 mutations predicted a high CR/CRp rate, whereas mutations in NRAS, SETBP1, RUNX1, and ASXL1 retained significant detrimental impact on CR/CRp, independent of high WBC count in patients without poor-risk cytogenetics, although only higher WBC count impacted CR/CRp rate in those with poor-risk cytogenetics (Table 2).
Multivariate logistic regression for CR/CRp achievement according to cytogenetic risk
| Variable | Odds ratio | 95% CI | P |
|---|---|---|---|
| Non–poor cytogenetics (n = 387) | |||
| Log (WBC) | 0.69 | 0.58-0.82 | <.0001 |
| NPM1 mutation | 2.25 | 1.15-4.51 | .02 |
| NRAS mutation | 0.46 | 0.23-0.91 | .02 |
| SETBP1 mutation | 0.16 | 0.02-0.87 | .04 |
| RUNX1 mutation | 0.43 | 0.23-0.81 | .009 |
| ASXL1 mutation | 0.52 | 0.28-0.98 | .04 |
| Poor risk cytogenetics (n = 84) | |||
| Log (WBC) | 0.61 | 0.41-0.87 | .009 |
Univariate prognostic impact of gene mutations in cytogenetic groups
We next studied the prognostic value of gene mutations on OS in patients according to their cytogenetic risk. In patients with non–poor cytogenetics (n = 387), NPM1 mutations were associated with a lower hazards ratio (HR) for death in univariate analysis (HR, 0.69; 95% CI, 0.52-0.92; P = .011), whereas mutations in DNMT3A, NRAS, ASXL1, RUNX1, PHF6, CSF3R, SETBP1, and ETV6 all conferred a higher risk of death (all P < .05, Figure 2A). In univariate analysis, only the adverse prognostic impact of high allelic ratio (≥0.5) FLT3-ITDs (HR, 2.04; 95% CI, 1.23-3.39; P = .006), but not of low allelic ratio (HR, 1.31; 95% CI, 0.95-1.82; P = .09) reached statistical significance. In patients with poor-risk cytogenetics (n = 84), both TP53 (HR, 2.31; 95% CI, 1.43-3.73; P = .0006) and KRAS (HR, 3.01; 95% CI, 1.42-6.39; P = .004) mutations further worsened OS in univariate analyses (Figure 2B).

HRs of death according to gene mutations. (A) Patients with non–poor cytogenetic risk (n = 387). (B) Patients with poor cytogenetic risk (n = 84). Error bars indicate 95% CI. P values are from univariate Cox models.
HRs of death according to gene mutations. (A) Patients with non–poor cytogenetic risk (n = 387). (B) Patients with poor cytogenetic risk (n = 84). Error bars indicate 95% CI. P values are from univariate Cox models.
Multivariate prognostic impact of gene mutations in cytogenetic groups
In the 387 patients with non–poor cytogenetics, the presence of an NPM1 mutation predicted prolonged OS (HR, 0.57; 95% CI, 0.41-0.77; P = .0004), whereas FLT3-ITDs with low (HR, 1.85; 95% CI, 1.31-2.62; P = .0005) or high allelic ratio (HR, 3.51; 95% CI, 2.03-6.08; P < 10−4); DNMT3A (HR, 1.86; 95% CI, 1.40-2.47; P < 10−4), NRAS (HR, 1.54; 95% CI, 1.07-2.20; P = .019), or ASXL1 (HR, 1.89; 95% CI, 1.34-2.67; P = .0003) mutations independently predicted a shorter OS in a multivariate Cox model after variable selection by Lasso-penalized regression (Table 3). The range of HRs in this model allowed for designing a simple score (−1 point for an NPM1 mutation, +1 point each for FLT3-ITD low allele ratio, DNMT3A, NRAS, and ASLX1, and 2 points for FLT3-ITD high allele ratio) that could regroup patients with non–poor cytogenetics into 4 distinct risk categories with 12-month OS estimates ranging from 96.2% (95% CI, 89.0-100.0) to 43.5% (95% CI, 31.3-60.5; supplemental Table 5; supplemental Figure 4).
Multivariate Cox models for OS in patients according to cytogenetic risk
| Variable | HR | 95% CI | P |
|---|---|---|---|
| Non–poor risk cytogenetics (n = 387) | |||
| NPM1 mutation | 0.57 | 0.41-0.77 | .0004 |
| FLT3-ITD low ratio | 1.85 | 1.31-2.62 | .0005 |
| FLT3-ITD high ratio | 3.51 | 2.03-6.08 | <.0001 |
| NRAS mutation | 1.54 | 1.07-2.20 | .019 |
| ASXL1 mutation | 1.89 | 1.34-2.67 | .0003 |
| DNMT3A mutation | 1.86 | 1.40-2.47 | <.0001 |
| Poor risk cytogenetics (n = 84) | |||
| KRAS mutation | 3.60 | 1.68-7.72 | .001 |
| TP53 mutation | 2.49 | 1.53-4.04 | .0003 |
After Lasso-penalized regression in the 84 patients with poor-risk cytogenetics, TP53 (HR, 2.49; 95% CI, 1.53-4.04; P = .0003) and KRAS (HR, 3.60; 95% CI, 1.68-7.72; P = .001) mutations independently predicted worse OS (Table 3). Patients with poor-risk genetics without TP53 or KRAS mutation had a 12-month OS of 58.3% (95% CI, 45.9-74.1) vs 19.4% (95% CI, 10.0-37.8) for those with either mutation (log-rank test, P = 2 × 10⁻⁵; supplemental Figure 4; supplemental Table 5).
Development of the ALFA molecular decision tool
We empirically designed a 3-tier oncogenetic decision model assigning patients with 2-year OS estimates >60% to the go-go group, those with 2-year OS estimates <10% to the no-go group, and all others to the slow-go tier. Patients with non–poor cytogenetics and either NPM1 mutation with at most 1 mutation among FLT3-ITD low allelic ratio, DNMT3A, ASXL1, or NRAS mutations or those with NPM1, FLT3-ITD, DNMT3A, ASXL1, or NRAS, all wild-type (n = 184; 39.1%, ie, groups A and B in supplemental Table 5), were assigned to the very favorable go-go group. Conversely, patients with adverse risk cytogenetics and either a mutation in KRAS or TP53 (n = 36; 7.6%, ie, group F in supplemental Table 5) were assigned to the no-go group, and the remaining 251 patients (53.3%) were assigned to the slow-go group (Table 4). Two-year OS estimates were 66.1% (95% CI, 59.5-73.3), 39.1% (95% CI, 33.5-45.7), and 2.8% (95% CI, 0.4-19.2) in the go-go, slow-go, and no-go groups, respectively (overall log-rank test; P < 10−5; Figure 3A). Censoring OS at the time of HSCT in first CR did not affect those results (supplemental Figure 5). CR rates were 84.2% (95% CI, 78.0-89.0), 66.5% (95% CI, 60.3-72.3), and 52.3% (95% CI, 35.7-69.2) in the go-go, slow-go, and no-go groups, respectively (overall Fisher’s exact test, P < 10−5). RFS also markedly differed between these tiers, with 2-year estimates of 49.7% (95% CI, 42.4-58.2), 30.2% (95% CI, 24.0-38.1), and 5.3% (95% CI, 0.8-35.5), respectively (overall log-rank test, P < 10−5; Figure 3B).
Repartition and outcome per ALFA decision tool tier in the ALFA1200 training cohort and validation cohorts
| Training cohort | Validation cohorts | |||||||||||
|---|---|---|---|---|---|---|---|---|---|---|---|---|
| ALFA1200 (n = 471) | AMLSG (n = 223) | HDF (n = 141) | SAL (n = 466) | |||||||||
| n (%) | 2-y OS (95% CI) | P | n (%) | 2-y OS (95% CI) | P | n (%) | 2-y OS (95% CI ) | P | n (%) | 2-y OS (95% CI) | P | |
| Go-go* | 184 (39.1) | 66.1% (59.5-73.3) | <10−5 | 84 (37.7) | 44.8 (35.3-56.9) | .0006 | 44 (31.2) | 43.4 (30.7-61.4) | .06 | 171 (36.7) | 35.5 (28.9-43.5) | .02 |
| Slow-go | 251 (53.3) | 39.1% (33.5-45.7) | Ref. | 113 (50.7) | 21.9 (15.4-31.2) | Ref. | 78 (55.3) | 29.9 (21.2-42.2) | Ref. | 243 (52.1) | 28.2 (20.1-31.2) | Ref. |
| No-go | 36 (7.6) | 2.8% (0.4-19.2) | <10−5 | 26 (11.6) | 3.8 (0.5-26.2) | 3 × 10⁻⁵ | 19 (13.5) | 10.5 (2.8-39.1) | .01 | 52 (11.2) | 2.0 (0.2-13.9) | <10−5 |
| Overall log-rank test | <10−5 | <10−5 | .003 | <10−5 | ||||||||
P values by overall log-rank test and from pairwise log-rank tests considering the slow-go group as reference (Ref.)
Go-go tier: non–poor cytogenetics, NPM1 mutated and at most 1 mutation among FLT3-ITD low, DNMT3A, ASXL1, or NRAS OR non–poor cytogenetics and NPM1, FLT3-ITD, DNMT3A, ASXL1, and NRAS all wild-type; no-go tier: poor-risk cytogenetic with KRAS and/or TP53 mutation; slow-go: all others.
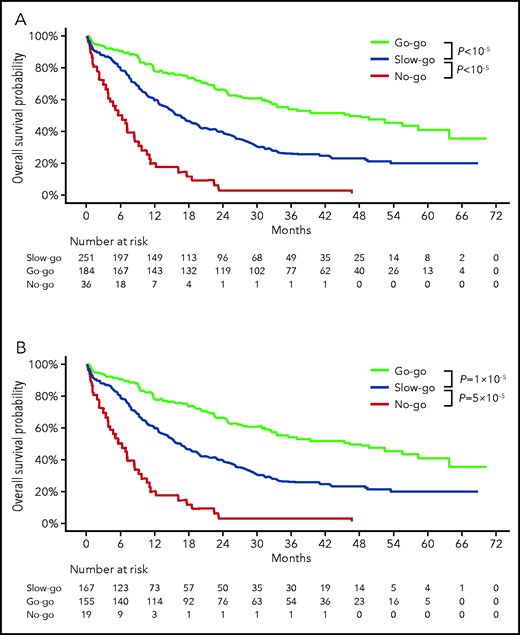
Outcome of the ALFA1200 cohort according to the ALFA decision tool. Overall survival (A) and relapse-free survival (B) according to ALFA decision tiers. P values from log-rank tests.
Outcome of the ALFA1200 cohort according to the ALFA decision tool. Overall survival (A) and relapse-free survival (B) according to ALFA decision tiers. P values from log-rank tests.
Comparison with alternative decision tools
To benchmark our ALFA decision tool, we ranked patients according to their 5-year survival predicted by the KB approach.29,30 The 184 patients with best predicted outcome were assigned to a KB go-go group, and the 36 with poorest KB predictions were assigned to the KB no-go group. Agreement between ALFA and the KB decision tools was moderate (Cohens κ, 0.47; 95% CI, 0.40-0.55; supplemental Table 6). This KB-guided decision tool also discriminated among patients with different outcomes (supplemental Figure 6). However, its concordance index for OS was 0.73 (95% CI, 0.68-0.77), comparable with that of the ALFA decision tool (0.72; 95% CI, 0.68-0.77; P = .58). Thus, the KB approach did not supersede the simpler ALFA decision tool. Similarly, in the 457 patients with evaluable ELN 2017 risk, the concordance index of the ALFA decision tool for OS was still 0.72 (95% CI, 0.63-0.72), compared with only 0.63 (95% CI, 0.59-0.68) for the ELN 2017 risk classification (P = 2 × 10⁻⁵; supplemental Table 6).
External validation of the ALFA decision tool
We finally performed external validation of the ALFA decision tool in 3 distinct cohorts of 141 to 466 older patients treated intensively with older accrual dates and longer follow-up, resulting in lower median OS durations (supplemental Table 3). The proportion of patients assigned to the go-go group ranged from 31.2% to 37.7% and that of no-go patients from 11.2% to 13.5%. Statistically significant differences in OS were seen between decision tiers in all 3 cohorts (overall log-rank tests: HDF [Hauts-de-France], P = .003 and AMLSG [AML Study Group] and SAL [Study Alliance Leukemia], both P < 10−5; Figure 4), and to a lesser extent on RFS (supplemental Figure 7).
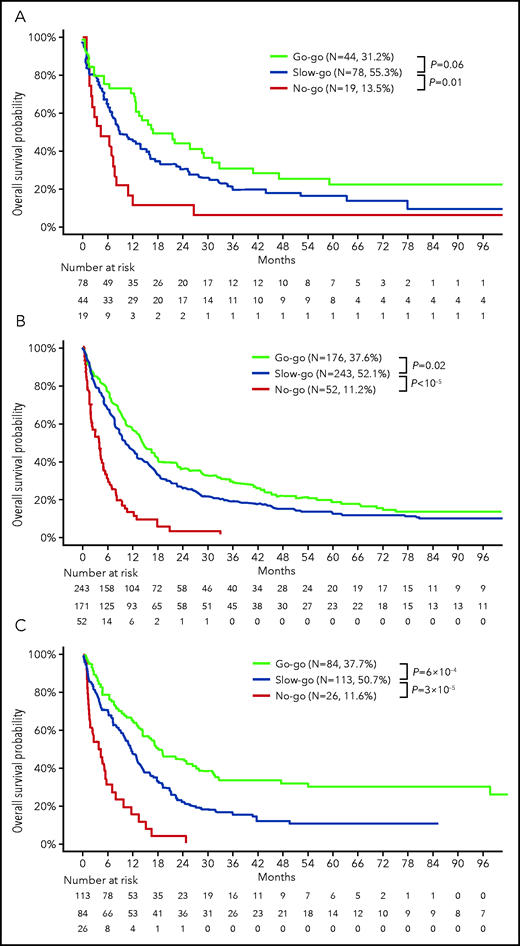
External validation of the ALFA decision tool. OS according to ALFA decision tiers: (A) 141 patients accrued to the Hauts-De-France registry (HDF cohort); (B) 466 patients accrued to Study Alliance Leukemia trials (SAL cohort); and (C) 233 patients ≥60 years or older excluding t(15;17) cases in the AML Study Group public dataset7,29 (AMLSG cohort). Characteristics of these cohorts are provided in supplemental Table 3. P values from log-rank tests.
External validation of the ALFA decision tool. OS according to ALFA decision tiers: (A) 141 patients accrued to the Hauts-De-France registry (HDF cohort); (B) 466 patients accrued to Study Alliance Leukemia trials (SAL cohort); and (C) 233 patients ≥60 years or older excluding t(15;17) cases in the AML Study Group public dataset7,29 (AMLSG cohort). Characteristics of these cohorts are provided in supplemental Table 3. P values from log-rank tests.
Discussion
This study relies on cytogenetics and targeted sequencing of 37 genes in a uniformly treated, prospective cohort of 471 patients aged ≥60 years, with newly diagnosed AML. We identified oncogenetic predictors of short-term (remission) and long-term (OS) benefit of intensive chemotherapy. We developed and validated a simple decision model that accounted for cytogenetics and mutations in 7 genes (NPM1, FLT3-ITD, DNMT3A, NRAS, ASXL1, KRAS, and TP53) that reproducibly identified patients with significant differences in overall survival across multiple cohorts.
The results of intensive chemotherapy in older adults with newly diagnosed AML have long remained disappointing, and physicians are increasingly turning to alternative options, such as the combination of azacitidine and venetoclax, especially for unfit patients.16 Fitness for chemotherapy has 2 orthogonal dimensions: one is related to the patients’ condition and the other to the disease risk. The characteristics of our cohort, including most patients with no comorbidity and good performance status, resulting in relatively low early death rate (6.8% at day 30), enabled us to carefully study the role of disease-related factors on chemotherapy outcome. Our cohort including a similar proportion of de novo AML and poor-risk cytogenetics (∼20%) compared with other populations of older AML patients treated intensively (supplemental Table 3).39,40 This reflects the accepted notion that treatment decision can be delayed until obtaining the results of cytogenetics in older patients with AML.41,42
In keeping with many previous reports,17,22 our results stress the prominent role of poor-risk cytogenetics, mostly complex karyotype and related chromosomal imbalances (deletion 5q/monosomy 5 or 7 [del5q/-5-7], and so on) in predicting induction failure and shorter overall survival. Conventional karyotyping failure remains an obstacle to accurate patient stratification. In our series, the 7.4% of patients in this situation had similar outcome as patients with non–poor cytogenetics, enabling us to group them. Routine use of molecular cytogenetic tools in this context will overcome this limitation.43,44
Among patients with non–poor cytogenetics, we identified mutations in NRAS, SETBP1, RUNX1, and ASXL1 to independently predict lower CR rate. These findings differ from other published series,23,45 perhaps owing to the assessment after 2 cycles in the present series. Of note, some of these genes (SETBP1 and RUNX1) did not harbor prognostic impact in our analysis of OS. Though this could be because of their overlap with other frequently mutated genes such as ASXL1, it raises the possibility that salvage therapies, the details of which were not available in our cohort, could have attenuated their prognostic impact beyond primary induction failure.
In univariate analysis, we found shorter OS among patients without poor risk cytogenetics in those harboring mutations in DNMT3A, NRAS, ASXL1, RUNX1, PHF6, CSF3R, SETBP1, and ETV6, and in poor-risk cytogenetics AMLs with mutations in TP53 or KRAS. Most of these gene mutations have already been associated with poorer outcome in AML cohorts treated intensively.6,11,13,23,45
The prognostic value of DNTM3A mutations remains debated,11,26,46 and we found similar prognosis between R882 hotspot substitutions and other mutations (data not shown). DNTM3A, but also TET2 or ASXL1 (DTA) are often preleukemic hits in AML.47-50 Based on VAFs, most of these mutations appeared as ancestral mutations in our cohort, and our cohort was not powered to assign a different prognostic value to secondary, as opposed to ancestral, DTA lesions (data not shown).
In our univariate analysis, only a high allele ratio of FLT3-ITD, as defined by ELN consensus (ratio, ≥0.5),3 was associated with shorter OS. However, variable selection based on penalized Lasso regression uncovered a lesser, yet significant prognostic value to lower FLT3-ITD clones in multivariate analysis. This finding stresses both the need to perform stringent variable selection when considering large genotyping datasets31 and the challenges in using allele ratio of FLT3-ITDs for prognostic assignment,51 most of which were overcome here by centralized evaluation. These results confirm the longstanding notion that FLT3-ITD is also a high-risk lesion in older patients with AML.19 Of 74 patients with mutated NPM1 without FLT3-ITD, 48 (64.9%) had at least 1 mutation in DNMT3A, NRAS, or ASXL1, which had independent poor prognostic value in our final Cox model. The variable incidence of these adverse co-mutations in different cohorts has most likely contributed to the divergent reports on the prognostic role of NPM1 mutations in older patients with AML.20-22
Progresses in chemotherapy-free regimens have challenged the role of intensive therapies in other heme malignancies. Decision tools have thus been developed to segregate patients for whom intensive treatment should not be questioned (go-go) from those where it should be carefully considered (slow-go ) or readily discarded (no-go).52 Combining cytogenetics and the mutational status of 7 genes, we could design and validate such a 3-tier decision tool. With a C-index for OS in the higher range of reported values across genetic classifiers in various AML cohorts,29,30,53 the resulting model was more discriminative than ELN 2017 risk stratification, whose limits in this context have already been reported,22,24 and comparable to the more cumbersome KB approach, which takes 100 variables as input, including important clinical variables, such as age and WBC count, compared with only 8 for our decision tool, and has yet to be fully validated in patients >60 years or age.29,30
Across all tested cohorts, the ALFA decision tool identified 30% to 35% of patients with superior outcome, including a 2-year OS of 66.1% in the more recent ALFA1200 trial. These go-go patients should be considered candidates for intensive chemotherapies, and future trials should aim at improving its results (eg, through the addition of novel therapies, or intervening early using measurable residual disease).54-56 Importantly, this go-go group could not be solely identified on the basis of NPM1 and FLT3-ITD status, let alone the presence of core-binding factor fusions, which are rarely seen at this age.
Conversely, the ALFA decision tool consistently identified ∼10% of no-go patients with very poor short-term survival. Importantly, this group was not only defined by poor-risk cytogenetics, and the short OS of these high-risk patients contrasted with a seemingly acceptable CR/CRp rate of 52.3%. These findings illustrate the need for integrated cytogenetic and genetic risk stratification and stress that CR achievement, per se, may not always translate into prolonged survival in older patients with AML, raising a question about its role as a clinical trial end point in this population. For this minor subset of no-go AMLs, despite adequate performance status and lack of comorbidities, it may be considered ethical to evaluate investigational agents in trials without an intensive reference arm. The remaining 50% to 55% of patients constitute the slow-go group, where one may consider randomizing current intensive regimens vs promising, less intensive combinations.16 Long-term survival data with these less intensive therapies should be inspected stratifying according to the proposed decision tool to strengthen this hypothesis, accounting for the important differences in age and comorbidities of cohorts so far treated with intensive chemotherapy vs hypomethylating agents: venetoclax combinations.57,58 Our decision tool was robust to censoring at HSCT in first remission, a strategy increasingly accessible to older patients with AML.59
Finally, the ALFA decision tool identified significant differences in OS in 3 independent validation cohorts, although the overall lower OS of these cohorts buffered the survival differences between tiers. This likely reflects the fact that patients were mostly accrued to these cohorts before 2010 and thus had longer follow-up,17,60,61 but also stresses the progress made in the supportive care of these patients over the recent years.62
Overall, our ALFA decision model relies on a limited number of lesions, all part of the core oncogenes sequenced in AML cohorts, enabling cross comparison of different treatment approaches currently explored in nonrandomized trials.63-65 Incorporation of additional genetic and nongenetic biomarkers of chemosensitivity may in the future help further refine prognostic assessment in larger cohorts of older patients with AML before treatment is initiated.66 With the acceleration of sequencing turn-around time in most centers, and the increasing acceptance of delayed treatment initiation in older patients with AML,41,42 our simple, reproducible, and discriminant decision tool has the potential to first instruct the design of future clinical trials in fit patients with AML, and then guide frontline treatment decisions in routine practice.
Acknowledgments
The authors thank the ALFA1200 investigators Frédérique Hilaire, Rebecca Grapin, Anne Solenn Debrie, Imen Chouikh, and Lydia Amghar from the ALFA coordination office for data collection; Julie Lejeune and Sylvie Chevret from the Department of Medical Bio-informatics (Hôpital Saint-Louis, Assistance Publique–Hôpitaux de Paris, Paris, France) for data management; Christophe Roumier and the Tumor Bank of the Lille University Hospital (certification NF 96900-2014/65453-1) for handling, conditioning, and storing patient samples; and Sandrine Geffroy and Maxime Bucci for help with sequencing experiments.
This study was funded by the French National Cancer Institute and French Health Ministry (PHRC 2007/1911 and PRTK TRANSLA10-060).
Authorship
Contribution: R.I. designed the study, performed analyses, and drafted the manuscript; C.G. and H.D. were the principal investigators and coordinators of the ALFA1200 study; C.B., T.B., C.P., E.L., J.-B.M., L.A., D.L., J.V.M., L. Gastaud, E.R., P.R., X.T., S.C., T.C., and N.B. accrued patients for the ALFA1200 study; E.F., A.M.-R., O.N., and O.B. did the sequencing analyses of the ALFA1200 study under the supervision of C.P. and N.D.; C.B., C.R., H.S., L. Goursaud, and K.-J.W. accrued patients to the validation cohorts; C. Thiede, C.P., and N.D. supervised molecular analyses of the validation cohorts; C. Terré centrally reviewed cytogenetics of the ALFA1200 study; K.C.-L., R.I., C.G., H.D., and N.D. controlled the database; and all authors reviewed the manuscript and approved its final version.
Conflict-of-interest disclosure: The authors have no competing financial interests.
Correspondence: Raphael Itzykson, Service Hématologie Adultes, Hôpital Saint-Louis, 1 Av Claude Vellefaux, F-75010 Paris; e-mail: raphael.itzykson@aphp.fr.
Presented in part at the 60th annual meeting of the American Society of Hematology, San Diego, CA, 30 November to 4 December 2018.
An analysis limited to only a few genes of the discovery cohort has been reported.24
The original data will be made available in response to e-mail request to the corresponding author (raphael.itzykson@aphp.fr).
The online version of this article contains a data supplement.
There is a Blood Commentary on this article in this issue.
The publication costs of this article were defrayed in part by page charge payment. Therefore, and solely to indicate this fact, this article is hereby marked ”advertisement” in accordance with 18 USC section 1734.
