Subjects:
Free Research Articles
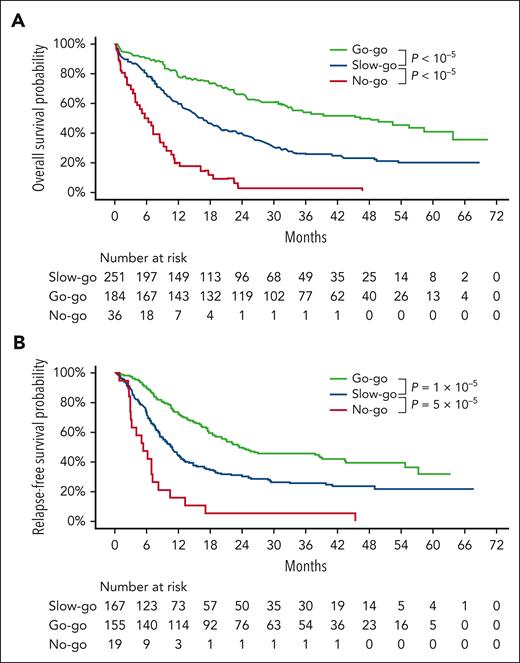
In Figure 3 on page 514, the graph curves in panel B are duplicates of those in panel A because of an error that occurred during the publication process. The corrected Figure 3 is shown below.
Figure 3.
Outcome of the ALFA1200 cohort according to the ALFA decision tool. Overall survival (A) and relapse-free survival (B) according to ALFA decision tiers. P values from log-rank tests.
Figure 3.
Outcome of the ALFA1200 cohort according to the ALFA decision tool. Overall survival (A) and relapse-free survival (B) according to ALFA decision tiers. P values from log-rank tests.
© 2023 by The American Society of Hematology
2023


This feature is available to Subscribers Only
Sign In or Create an Account Close Modal