

Key Points
Tumor cells express transcriptional programs of both immature and mature stages of normal PC development.
Survival of patients with AL and MM is inferior when tumor cells express transcriptional programs of more immature normal PC stages.

Abstract
Although light-chain amyloidosis (AL) and multiple myeloma (MM) are characterized by tumor plasma cell (PC) expansion in bone marrow (BM), their clinical presentation differs. Previous attempts to identify unique pathogenic mechanisms behind such differences were unsuccessful, and no studies have investigated the differentiation stage of tumor PCs in patients with AL and MM. We sought to define a transcriptional atlas of normal PC development in secondary lymphoid organs (SLOs), peripheral blood (PB), and BM for comparison with the transcriptional programs (TPs) of tumor PCs in AL, MM, and monoclonal gammopathy of undetermined significance (MGUS). Based on bulk and single-cell RNA sequencing, we observed 13 TPs during transition of normal PCs throughout SLOs, PB, and BM. We further noted the following: CD39 outperforms CD19 to discriminate newborn from long-lived BM-PCs; tumor PCs expressed the most advantageous TPs of normal PC differentiation; AL shares greater similarity to SLO-PCs whereas MM is transcriptionally closer to PB-PCs and newborn BM-PCs; patients with AL and MM enriched in immature TPs had inferior survival; and protein N-linked glycosylation–related TPs are upregulated in AL. Collectively, we provide a novel resource to understand normal PC development and the transcriptional reorganization of AL and other monoclonal gammopathies.
Medscape Continuing Medical Education online
In support of improving patient care, this activity has been planned and implemented by Medscape, LLC and the American Society of Hematology. Medscape, LLC is jointly accredited by the Accreditation Council for Continuing Medical Education (ACCME), the Accreditation Council for Pharmacy Education (ACPE), and the American Nurses Credentialing Center (ANCC), to provide continuing education for the healthcare team.
Medscape, LLC designates this Journal-based CME activity for a maximum of 1.00 AMA PRA Category 1 Credit(s)™. Physicians should claim only the credit commensurate with the extent of their participation in the activity.
Successful completion of this CME activity, which includes participation in the evaluation component, enables the participant to earn up to 1.0 MOC points in the American Board of Internal Medicine’s (ABIM) Maintenance of Certification (MOC) program. Participants will earn MOC points equivalent to the amount of CME credits claimed for the activity. It is the CME activity provider’s responsibility to submit participant completion information to ACCME for the purpose of granting ABIM MOC credit.
All other clinicians completing this activity will be issued a certificate of participation. To participate in this journal CME activity: (1) review the learning objectives and author disclosures; (2) study the education content; (3) take the post-test with a 75% minimum passing score and complete the evaluation at http://www.medscape.org/journal/blood; and (4) view/print certificate. For CME questions, see page 1643.
Disclosures
Associate Editor Hervé Avet-Loiseau, CME questions author Laurie Barclay, freelance writer and reviewer, Medscape, LLC, and the authors declare no competing financial interests.
Learning objectives
Upon completion of this activity, participants will be able to:
- 1.
Describe a gene expression atlas of normal plasma cell (PC) differentiation throughout secondary lymphoid organs, peripheral blood, and bone marrow, according to a study
- 2.
Compare transcriptional programs expressed in tumor PCs of light-chain amyloidosis (AL) vs monoclonal gammopathy of undetermined significance and multiple myeloma (MM), according to a study
- 3.
Describe clinical and pathophysiologic implications of study findings regarding the differentiation stage of tumor PCs in patients with AL and MM and a transcriptional atlas of normal PC development
Release date: October 28, 2021; Expiration date: October 28, 2022
Introduction
Multiple myeloma (MM) and light-chain amyloidosis (AL) are the most common malignant monoclonal gammopathies. Although both present with accumulations of tumor plasma cells (PCs) in bone marrow (BM), AL results from the deposition of misfolded light chains.1-3 This urged the identification of the unique pathogenic mechanisms in AL. Success in identifying these mechanisms has thus far been limited.4-7
Knowledge about the neoplastic transformation of normal PCs remains scarce,8 particularly when considering the anatomical diversity reflected by their generation in secondary lymphoid organs (SLOs), circulation in peripheral blood (PB), and residence in BM. Thus, we sought to develop a gene-expression atlas of normal PC differentiation throughout SLOs, PB, and BM to compare transcriptional programs (TPs) expressed in tumor PCs of AL vs monoclonal gammopathy of undetermined significance (MGUS) and MM.
Study design
One hundred subjects were studied. Tonsillar and PB-PCs were flow-sorted according to surface heavy-chain immunoglobulin expression, and 5 BM-PC subsets were isolated based on the expression of CD19, CD39, CD56, and CD81, due to their ascribed role in dissecting unique BM-PC differentiation states, from 9 healthy adults (HAs).9 Tumor PCs from patients with AL (n = 32), MM (n = 32), and MGUS (n = 6) were isolated for RNA sequencing (RNAseq) using fluorescence-activated cell sorting according to patient-specific aberrant phenotypes.4 We used an RNAseq method optimized for limited cell numbers10 due to the very small percentages of normal PC subsets in HAs and tumor PCs in AL and MGUS. Single-cell RNAseq (scRNAseq) was performed in 80 239 PCs from SLOs (n = 3), PB (n = 3), and BM (n = 3) samples from HAs, and BM aspirates from AL (n = 6) and MM (n = 15) patients. The complete methodology is described in supplemental Methods (available on the Blood Web site), the study workflow is shown in supplemental Figure 1, and patient characteristics are presented in supplemental Table 1.
Results and discussion
Transition from early to late stages of PC development includes cessation of the cell cycle and activation of antiapoptotic genes.11-13 Thus, prolonged survival of long-lived normal PCs could be an intrinsic advantage before their neoplastic transformation, whereas blocked proliferation after exiting SLOs would pose a challenge to their clonal expansion. Yet, precise knowledge about the TPs expressed by tumor PCs in relation to normal PC development remains unknown. Hence, we first displayed a 3-dimensional principal component analysis of normal and tumor PC gene expression (Figure 1A), which exposed the presence of 13 TPs during the transition of normal PCs throughout SLOs, PB, and BM (Figure 1B), and uncovered that tumor PCs express TPs linked to various stages of normal PC differentiation (Figure 1C).
![Transcriptional atlas of normal PC development and neoplastic transformation. Data were normalized with RUVSeq, and differential expression of genes was analyzed with Deseq2 or masigpro, followed by k-means clustering in R. (A) Tridimensional principal component analysis of gene-expression data based on the top 500 variable genes. Normal PCs were isolated by fluorescence-activated cell sorting (FACS) from SLOs (ie, tonsils, SLO) and PB according to immunoglobulin heavy-chain isotypes, as well as from BM samples of healthy adults according to differential expression of CD19, CD39, CD56, and CD81. Tumor PCs were isolated by FACS from BM samples of patients with AL (n = 32), MGUS (n = 6), and MM (n = 32). (B) Heat map of gene expression in normal PC subsets (after merging SLO- and PB-PCs with immunoglobulin M [IgM], IgG, and IgA isotypes as well as all CD39− BM-PCs due to overlapping profiles) and tumor PCs from AL, MGUS, and MM patients, based on a total of 2200 genes selected by their differential expression in normal SLO-PCs, PB-PCs, and CD39+ and CD39− BM-PCs plus 720 genes differentially expressed in tumor PCs from AL, MGUS, and MM patients. TPs were defined by semisupervised k-means clustering (k = 13), and gene expression is represented with a row z score. (C) Functional enrichment heat map based on top nonredundant biological functions (ie, gene ontology [GO]) (P < .05) per TP determined with Metascape. TP1, TP7, and TP8 shared the same top biological functions and were grouped. Color intensity is proportional to the significance level. Box plots from left to right represent gene-expression levels in normal SLO-PCs, PB-PCs, and CD39+ and CD39− BM-PCs as well as tumor PCs from AL, MGUS, and MM patients. The most significant deregulated genes are shown at the right end of the graphical representation. (D) Uniform manifold approximation and projection (UMAP) of 142 778 individual PCs isolated by FACS from healthy adults; SLOs (n = 3), PB (n = 3), and BM (n = 3) and from patients with AL (n = 6) and MM (n = 15). (E) Single normal BM-PCs and tumor PCs were colored according to the TPs identified in panel C, based on the expression level of the most significant genes defining each TP. We used the Seurat R package24 for data integration and clustering.](https://ash.silverchair-cdn.com/ash/content_public/journal/blood/138/17/10.1182_blood.2020009754/9/m_bloodbld2020009754f1.png?Expires=1765909889&Signature=H1kptSsEZKSqJ4e-V0-lprhrdWkrwks8wJ~C-Oj-lf1K6dr5y7eDqniWmZwct4r4Q7zqzHBfkWkJgk-992ovq16FtvrjZw9Hp11QfCPJNgjJkMyfXTOvr~xDzonWyuPS7FZVvLJKLnMVUQ~kQeWbRjf2uKkhqVkmY604eAB-o~y1ImLQLr9KoRls25D6GZBJIaaoVfTFp~DVjQc-DIY6jVP7MOPNq152vvxvJGGZYbA5x3-rCzRrcHX9l7f1xZGLljegDvFuKx1wkMl~ZeaFNEEidYZ~Bn02o2CmCcxKfD8WJGrHtSV9is2rNZSp7ahFcjxELoBKWUKHGgn0QJuoxg__&Key-Pair-Id=APKAIE5G5CRDK6RD3PGA)
Transcriptional atlas of normal PC development and neoplastic transformation. Data were normalized with RUVSeq, and differential expression of genes was analyzed with Deseq2 or masigpro, followed by k-means clustering in R. (A) Tridimensional principal component analysis of gene-expression data based on the top 500 variable genes. Normal PCs were isolated by fluorescence-activated cell sorting (FACS) from SLOs (ie, tonsils, SLO) and PB according to immunoglobulin heavy-chain isotypes, as well as from BM samples of healthy adults according to differential expression of CD19, CD39, CD56, and CD81. Tumor PCs were isolated by FACS from BM samples of patients with AL (n = 32), MGUS (n = 6), and MM (n = 32). (B) Heat map of gene expression in normal PC subsets (after merging SLO- and PB-PCs with immunoglobulin M [IgM], IgG, and IgA isotypes as well as all CD39− BM-PCs due to overlapping profiles) and tumor PCs from AL, MGUS, and MM patients, based on a total of 2200 genes selected by their differential expression in normal SLO-PCs, PB-PCs, and CD39+ and CD39− BM-PCs plus 720 genes differentially expressed in tumor PCs from AL, MGUS, and MM patients. TPs were defined by semisupervised k-means clustering (k = 13), and gene expression is represented with a row z score. (C) Functional enrichment heat map based on top nonredundant biological functions (ie, gene ontology [GO]) (P < .05) per TP determined with Metascape. TP1, TP7, and TP8 shared the same top biological functions and were grouped. Color intensity is proportional to the significance level. Box plots from left to right represent gene-expression levels in normal SLO-PCs, PB-PCs, and CD39+ and CD39− BM-PCs as well as tumor PCs from AL, MGUS, and MM patients. The most significant deregulated genes are shown at the right end of the graphical representation. (D) Uniform manifold approximation and projection (UMAP) of 142 778 individual PCs isolated by FACS from healthy adults; SLOs (n = 3), PB (n = 3), and BM (n = 3) and from patients with AL (n = 6) and MM (n = 15). (E) Single normal BM-PCs and tumor PCs were colored according to the TPs identified in panel C, based on the expression level of the most significant genes defining each TP. We used the Seurat R package24 for data integration and clustering.
Transcriptional atlas of normal PC development and neoplastic transformation. Data were normalized with RUVSeq, and differential expression of genes was analyzed with Deseq2 or masigpro, followed by k-means clustering in R. (A) Tridimensional principal component analysis of gene-expression data based on the top 500 variable genes. Normal PCs were isolated by fluorescence-activated cell sorting (FACS) from SLOs (ie, tonsils, SLO) and PB according to immunoglobulin heavy-chain isotypes, as well as from BM samples of healthy adults according to differential expression of CD19, CD39, CD56, and CD81. Tumor PCs were isolated by FACS from BM samples of patients with AL (n = 32), MGUS (n = 6), and MM (n = 32). (B) Heat map of gene expression in normal PC subsets (after merging SLO- and PB-PCs with immunoglobulin M [IgM], IgG, and IgA isotypes as well as all CD39− BM-PCs due to overlapping profiles) and tumor PCs from AL, MGUS, and MM patients, based on a total of 2200 genes selected by their differential expression in normal SLO-PCs, PB-PCs, and CD39+ and CD39− BM-PCs plus 720 genes differentially expressed in tumor PCs from AL, MGUS, and MM patients. TPs were defined by semisupervised k-means clustering (k = 13), and gene expression is represented with a row z score. (C) Functional enrichment heat map based on top nonredundant biological functions (ie, gene ontology [GO]) (P < .05) per TP determined with Metascape. TP1, TP7, and TP8 shared the same top biological functions and were grouped. Color intensity is proportional to the significance level. Box plots from left to right represent gene-expression levels in normal SLO-PCs, PB-PCs, and CD39+ and CD39− BM-PCs as well as tumor PCs from AL, MGUS, and MM patients. The most significant deregulated genes are shown at the right end of the graphical representation. (D) Uniform manifold approximation and projection (UMAP) of 142 778 individual PCs isolated by FACS from healthy adults; SLOs (n = 3), PB (n = 3), and BM (n = 3) and from patients with AL (n = 6) and MM (n = 15). (E) Single normal BM-PCs and tumor PCs were colored according to the TPs identified in panel C, based on the expression level of the most significant genes defining each TP. We used the Seurat R package24 for data integration and clustering.
As expected, TPs related to germinal center formation and B-cell activation/proliferation were turned off once normal PCs egressed from SLOs (TP-3 and TP-4). By contrast, genes related to NF-κB, among others, in TP-9 became active from the moment PCs left SLOs. The transition from PB- into BM-PCs was characterized by differential expression of genes related to protein secretion (TP-10), whereas newborn and long-lived BM-PC subsets differed on the expression of genes associated with proliferation (TP-5) and survival (TP-13). This transcriptional atlas of normal PC differentiation may contribute to further insights on genes involved in the generation of antibody-secreting cells and maturation into long-lived BM-PCs.13 For example, we observed that CD39 outperforms CD19 as a marker to discriminate newborn (CD39+) from long-lived (CD39−) normal BM-PCs (Figure 1B; supplemental Figure 2).
There are divergent opinions about the anatomical origin of monoclonal gammopathies in accordance with different concepts of disease pathogenesis; namely an antibody-secreting cell that originates from post–germinal center B cells in SLOs and can be detected in PB vs long-lived PCs in the BM.14-19 Here, we unraveled that tumor PCs from AL, MM, and MGUS patients express TPs from more immature SLOs, PB, and newborn PCs (eg, MYC activation in TP-7, TP-8) together with TPs from long-lived BM-PCs (eg, survival in TP-13). By contrast, reduced protein secretion (eg, TP-10) and regulation of response to endoplasmic reticulum stress (eg, TP-12) emerged as hallmarks of the neoplastic transformation from normal, long-lived BM-PCs into tumor PCs.
Based on the nonsuperimposable distribution of tumor PCs from AL, MM, and MGUS patients throughout the various stages of normal PC development (principal component 4 in Figure 1A), we decided to determine gene-expression correlation levels between each TP in the multiple normal PC subsets vs tumor PCs from each disease (supplemental Figure 3A). As such, the TPs that better defined each normal PC subset were identified, and their relative weight was measured in tumor PCs to unbiasedly identify their closest normal PC counterpart (supplemental Figure 3B). Surprisingly, we found that whereas TPs from SLOs, PB, and newborn and long-lived BM-PCs were equally distributed in MGUS, there was predominant expression of TPs from SLO-PCs in AL and TPs from PB- plus newborn BM-PCs in MM (supplemental Figure 3C).
We then used scRNAseq to investigate whether these TPs were homogeneously (vs heterogeneously) expressed in individual normal and tumor PCs (Figure 1D). As expected, normal PCs clustered according to their differentiation. Some patients also clustered, which could be partially explained by the proliferative stage of tumor PCs (supplemental Figure 4) and, to a lesser extent, IGH translocations (supplemental Figure 5). Furthermore, we observed that, whereas all AL patients had a predominant TP expressed by a majority of tumor PCs (ie, TP-9, TP-11, and TP-12; Figure 1E; supplemental Figure 6A), there was considerable single-cell diversity and most TPs were detectable in smaller percentages of tumor PCs (supplemental Figure 6A-B). These findings build upon recent concepts about the evolutionary tradeoffs of cancer hallmarks.20,21 Thus, rather than tumors being forced to select 1 biological function (eg, proliferation, survival, invasion, etc), singular PC subsets would be specialized in one or another task, and subset predominance in response to stimuli (eg, hypoxia) would dictate the tumor phenotype in a given moment.
Because previous studies in MM have shown an association between the differentiation stage of tumor PCs and patient outcome,9 we investigated whether the same applied to AL. First, we defined a normalized enrichment score (NES) based on the transcriptional profile of SLO-PCs, PB-PCs plus newborn BM-PCs and long-lived BM-PCs (supplemental Figure 7). As expected, the various normal PC subsets from SLOs, PB, and BM displayed the highest corresponding NES, whereas tumor PCs from AL and MM patients showed higher NES values related to the transcriptional profile of SLO-PCs and PB-PCs/newborn BM-PCs, respectively (Figure 2A). Although the number of patients precludes definitive conclusions, AL patients with tumor PCs displaying higher NES values corresponding to normal SLO-PCs had significantly inferior progression-free survival (Figure 2B-C). Similarly, we found that, in a larger series of patients with MM enrolled in CoMMpass, those displaying high NES values corresponding to PB-PCs/newborn BM-PCs had significantly poorer outcome (Figure 2D-E and supplemental Figure 8, in which MKI67 was removed).
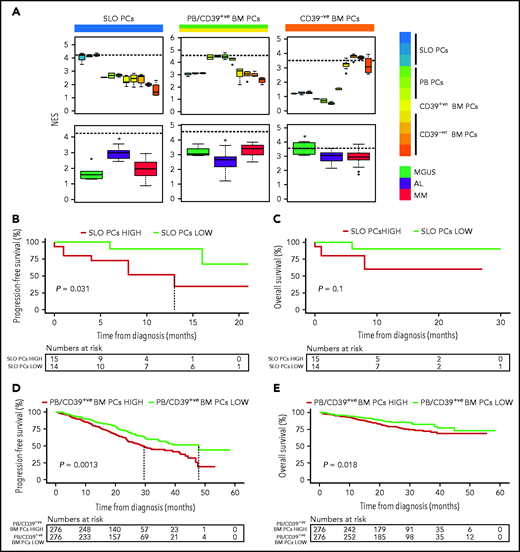
Impact of tumor gene expression in the survival of patients with AL and MM according to the resemblance with normal PC counterparts. (A) NES values based on the transcriptional profile of SLOs (ie, tonsils, SLO), PB, CD39+ (CD39+ve), and CD39− (CD39-ve) BM normal PCs, measured in these as well as in tumor PCs from patients with AL (n = 32), MGUS (n = 6), and MM (n = 32). The dashed line marks the median NES of the corresponding normal PC subset. *P < .05. (B-C) Progression-free and overall survival of patients with AL (n = 29) according to low vs high NES values corresponding to normal SLO-PCs (red, NES value above the median; green, NES values below the median). (D-E) Progression-free and overall survival of patients with MM (n = 552) according to low vs high NES values corresponding to normal PB-PCs and CD39+ BM-PCs (red, NES values above the median; green, NES values below the median).
Impact of tumor gene expression in the survival of patients with AL and MM according to the resemblance with normal PC counterparts. (A) NES values based on the transcriptional profile of SLOs (ie, tonsils, SLO), PB, CD39+ (CD39+ve), and CD39− (CD39-ve) BM normal PCs, measured in these as well as in tumor PCs from patients with AL (n = 32), MGUS (n = 6), and MM (n = 32). The dashed line marks the median NES of the corresponding normal PC subset. *P < .05. (B-C) Progression-free and overall survival of patients with AL (n = 29) according to low vs high NES values corresponding to normal SLO-PCs (red, NES value above the median; green, NES values below the median). (D-E) Progression-free and overall survival of patients with MM (n = 552) according to low vs high NES values corresponding to normal PB-PCs and CD39+ BM-PCs (red, NES values above the median; green, NES values below the median).
This is the first integrated bulk and single-cell analysis of the transcriptional programs of anatomically different normal PC subsets vs tumor PCs in AL, MM, and MGUS. Our results unveiled shared and exclusive transcriptional states between normal and tumor PCs, together with unique differences in tumor PCs from patients with AL, MM, and MGUS (supplemental Figure 9). Indeed, there were 720 genes differentially expressed in AL vs MM and MGUS (supplemental Table 2). It could be hypothesized that the greater similarity between MGUS and MM is because most MGUS progress into MM and not AL. Larger studies are needed to confirm this, and that specific cytogenetic abnormalities have no impact in transcriptional differences between AL vs MGUS/MM (supplemental Figure 10).
Two-thirds of genes overexpressed in AL vs MM/MGUS belonged to TP-2, TP-3, and TP-6 (213 of 335; 64%). These are linked to chromatin organization and protein N-linked glycosylation, which becomes downregulated as normal PCs egress from SLOs (Figure 1B-C). Interestingly, there is a fourfold higher rate of N-glycosylation in light chains from patients with AL vs other PC disorders ,22 although we could not confirm in vitro that knockdown of NAGK and MGAT2 reduced N-glycosylation of light chains produced by KJON cells (supplemental Figure 11).
More than one-half of genes underexpressed in AL vs MM/MGUS belonged to TP-1 and TP-8 (223 of 385; 58%), which are associated with oxidative phosphorylation, MYC, or ribosome biogenesis that becomes upregulated as normal PCs egress from SLOs (Figure 1B-C). These findings are consistent with previous observations about impaired ribosome machinery in AL.23 Thus, our results could potentially shed new light into the different clinical presentation of AL.
Acknowledgments
The authors thank all of the investigators who included patients in this study: Abelardo Barez, A.O., Albert Perez, A.G.d.C., Amaia Balerdi, Angel Ramirez, Cristina Martinez, Daniel Borrego, Elena Cabezudo, Elham Askari, E.M.O., Esther Gonzalez, F.d.A., F.P., Gonzalo Caballero, I.K., J.d.l.R., Javier Marco, J.F.S.M., J.M.-L., J.L., J.-E.d.l.P., Jose Julio Hernandez, Jose Luis Sastre, Jose Maria Alonso, Juan Jose Bargay, Juan Jose Gavira, J.-J.L., L.P., M.C., Maria Dolores Garcia-Malo, Maria Jesus Blanchard, Maria Jose Cejalvo, Maria Lourdes Elicegui, Maria Sarasa, M.-V.M., Martin Mascaro, Martin Nuñez, Mercedes Berenguer, M.G., N.P., Norma Gutierrez, Perla Salama Bendayan, Rafael Del Orbe, Rafael Rios, Ramon Garcia-Sanz, R.L., Rebeca Cuello, Roberto Hernandez, Rosa Lopez, V.C., Vicente Carrasco, and Tomas Gonzalez. The authors are deeply grateful to Magne Børset of the Norwegian University of Science and Technology for providing KJON cells.
This work was supported by CIBER-ONC del Instituto de Salud Carlos III (CB16/12/00369 and CB16/12/00489), Instituto de Salud Carlos III/Subdirección General de Investigación Sanitaria and Federación Española de Enfermedades Raras (FEDER) (FIS no. PI13/02196 and PI19/01451), Cancer Research UK, Fundación Científica Asociación Española Contra El Cáncer (FCAECC) and Associazione Italiana per la Ricerca sul Cancro (AIRC) under the Accelerator Award Program, the Black Swan Research Initiative of the International Myeloma Foundation, the Research Fellow Award from the Multiple Myeloma Research Foundation, Fundacion Areces (PREMMAN), GN Proyectos Estratégicos (AGATA) and the European Research Council (ERC) 2015 Starting Grant (MYELOMANEXT, 680200), the CRIS Cancer Foundation (PR_EX_2020-02) and Italian Ministry of Health (Grant GR-2018-12368387).
Authorship
Contribution: I.A., J.F.S.M., and B.P. conceived the idea and designed the study protocol; D.L.-A., E.M.O., R.L., A.G.d.C., J.L., M.-E.G., L.P., M.G., V.C., M.C., A.O., I.K., A.P.-M., J.d.l.R., J.-E.d.l.P., F.d.A., J.M.-L., J.-J.L., M.-V.M., F.P., A.W., I.A., V.M.F., M.-D.O., M.N., and J.F.S.M. provided study material and patients; M.L., N.P., M.T.C., and B.P. analyzed flow cytometry data; D. Alignani and S.G. performed cell sorting; M.V., S.R., A.V.-Z., and S.S. extracted and processed samples for RNAseq and scRNAseq; E.A. and A.N. performed in vitro studies; D. Alameda, I.G., M.V., and B.P. analyzed and interpreted data and wrote the manuscript; and all authors reviewed and approved the manuscript.
Conflict-of-interest disclosure: The authors declare no competing financial interests.
Correspondence: Bruno Paiva, Clínica Universidad de Navarra, Centro de Investigación Médica Aplicada (CIMA), Av Pío XII 55, 31008 Pamplona, Spain, e-mail: bpaiva@unav.es.
The single-cell RNAseq and bulk RNAseq data reported in this article have been deposited in the Gene Expression Omnibus database (accession number GSE175386).
All sequencing data will be made freely available to organizations and researchers; requests may be e-mailed to bpaiva@unav.es.
The online version of this article contains a data supplement.
There is a Blood Commentary on this article in this issue.
The publication costs of this article were defrayed in part by page charge payment. Therefore, and solely to indicate this fact, this article is hereby marked “advertisement” in accordance with 18 USC section 1734.

This feature is available to Subscribers Only
Sign In or Create an Account Close Modal