

Key Points
Oligomannose-type glycans are tumor-specific insertions into the antigen-binding sites of aggressive GCB-DLBCL.
These glycans empower cells to interact with microenvironmental lectins that can be precisely targeted by novel therapeutic antibodies.

Abstract
Glycosylation of the surface immunoglobulin (Ig) variable region is a remarkable follicular lymphoma–associated feature rarely seen in normal B cells. Here, we define a subset of diffuse large B-cell lymphomas (DLBCLs) that acquire N-glycosylation sites selectively in the Ig complementarity-determining regions (CDRs) of the antigen-binding sites. Mass spectrometry and X-ray crystallography demonstrate how the inserted glycans are stalled at oligomannose-type structures because they are buried in the CDR loops. Acquisition of sites occurs in ∼50% of germinal-center B-cell–like DLBCL (GCB-DLBCL), mainly of the genetic EZB subtype, irrespective of IGHV-D-J use. This markedly contrasts with the activated B-cell–like DLBCL Ig, which rarely has sites in the CDR and does not seem to acquire oligomannose-type structures. Acquisition of CDR-located acceptor sites associates with mutations of epigenetic regulators and BCL2 translocations, indicating an origin shared with follicular lymphoma. Within the EZB subtype, these sites are associated with more rapid disease progression and with significant gene set enrichment of the B-cell receptor, PI3K/AKT/MTORC1 pathway, glucose metabolism, and MYC signaling pathways, particularly in the fraction devoid of MYC translocations. The oligomannose-type glycans on the lymphoma cells interact with the candidate lectin dendritic cell–specific intercellular adhesion molecule 3 grabbing non-integrin (DC-SIGN), mediating low-level signals, and lectin-expressing cells form clusters with lymphoma cells. Both clustering and signaling are inhibited by antibodies specifically targeting the DC-SIGN carbohydrate recognition domain. Oligomannosylation of the tumor Ig is a posttranslational modification that readily identifies a distinct GCB-DLBCL category with more aggressive clinical behavior, and it could be a potential precise therapeutic target via antibody-mediated inhibition of the tumor Ig interaction with DC-SIGN–expressing M2-polarized macrophages.
Introduction
Diffuse large B-cell lymphomas (DLBCLs) are clinically variable aggressive tumors with heterogeneous phenotypic and genetic profiles and differential responses to conventional therapies. They are commonly classified into 2 broad subsets and an intermediate unclassifiable subset based on gene expression profiling.1,2 The germinal-center B-cell–like DLBCL (GCB-DLBCL) subset has a profile similar to that of normal GC B cells, whereas the activated B-cell–like DLBCL (ABC-DLBCL) has a profile similar to that of B cells activated by anti-immunoglobulin M (IgM) in vitro. Recent genomic studies have further subclassified DLBCL into 7 subtypes, with GCB-DLBCL that includes an EZB subtype defined by the acquisition of a BCL2 translocation and mutations in epigenetic regulator genes, including EZH2, KMT2D, CREBBP, EP300, ARID1A, IRF8, MEF2B, and EBF1.3,4 These lesions are early tumor events, which seem to be associated with worse clinical behavior, particularly when MYC translocations occur.3,4 The BCL2 and epigenetic regulator lesions are also early hallmarks of follicular lymphomas (FLs),5-7 suggesting a relationship between FL and the EZB subtype.3
In vivo ablation of surface immunoglobulin (sIg) on mature B cells results in rapid cell death,8 and deletion of the tumor sIg impairs the growth of lymphomas in mouse models.9,10 The sIg is typically expressed at high levels on DLBCL cells, but the influences of B-cell receptor (BCR) signaling in ABC-DLBCL and GCB-DLBCL seem to be distinct. In ABC-DLBCL, there is constitutive signaling, via either mutations of genes in the BCR-associated pathway or a range of interactions with putative autoantigens,11,12 and therapeutic inhibitors of this pathway can be effective in these patients.13 In contrast, there is less evidence for constitutive signaling in GCB-DLBCL, and BCR inhibitors are not as effective, which raises the question of the role of a BCR-mediated drive in this subset.
One of the key features of FL is the almost universal acquisition of N-linked glycosylation sites in the Ig variable region.14 The acquired N-glycosylation sites (AGSs) are tumor-specific and are introduced during somatic hypermutation.15 They persist through the entire disease history, despite ongoing somatic hypermutation, and those lymphoma cells that lose the sites (which is a rare event) reqcquire a different site or are lost from subsequent samples, indicating that they are not selected for expansion or long-term survival.16
In FL, the glycans acquired on the sIg variable region are unusual in that their biosynthetic processing is stalled at the initial oligomannose-type state.17 Termination of any cell surface glycoprotein at oligomannose is rare in normal human cells, but a common feature of infective agents, where it facilitates diverse roles, including immune evasion by glycan shielding and enhancement of immune cell colonization.18-20 Mannosylated sIg (sIg-Mann) interacts with the C-type lectin dendritic cell–specific intercellular adhesion molecule 3 grabbing non-integrin (DC-SIGN),21,22 which is naturally expressed by dendritic cells and macrophages with M2 polarization.23,24 This interaction induces low-level intracellular signaling and Myc activation in FL.21,22 This antigen-independent signal is relatively weak compared with anti-Ig, but it is sustained,22 and it seems to protect sIg-Mann+ FL cells against apoptosis through direct interaction with DC-SIGN–expressing macrophages.25,26
In an early study, we analyzed the tumor Ig heavy chain variable region (IGHV) sequences from a small group of patients with DLBCL and found that 13 (41%) of 32 acquired N-glycosylation sites.14,27 However, the characteristics of the subsets of DLBCL have not been defined. Here we have investigated the nature and three-dimensional structure of the glycans that seem to be affected by location in the variable region. We have mapped incidence, distribution, and functional consequences of the acquired sites in DLBCL, stratifying the GCB category into 2 distinct subsets and pointing to a potential opportunity to target this feature by blocking antibodies when sites are located in the antigen-binding region.
Materials and methods
Primary samples, cell lines, and phenotypic and intracellular signaling analyses
Details regarding the primary samples, cell lines, and phenotypic and intracellular signaling analyses are outlined in the supplemental Methods (available on the Blood Web site). The study was approved by the Institutional Review Boards of the University of Southampton (H228/02/t) and the University of Rochester (ULAB03012). All patients and healthy individuals provided informed consent.
DC-SIGN binding assay
Cells were incubated with 20 μg/mL DC-SIGN-Fc (R&D Systems) or left untreated for 30 minutes on ice in RPMI-1640 with 10% fetal bovine serum and 1 mM calcium. Cells were then washed and stained with fluorescein isothiocyanate–conjugated or allophycocyanin-Cy7–conjugated anti-human-Fc (BioLegend) for 30 minutes on ice. Binding was analyzed by flow cytometry. In primary samples, DC-SIGN binding was measured in the CD20+ or CD20+CD10+ cells, depending on tumor phenotype.
IG gene, genetic variants, and RNA-seq data analysis
The tumor IG transcript sequences were identified from public RNA sequencing (RNA-seq) data,3,28 or viable DLBCL primary samples and cell lines, as described in the supplemental Methods. Genetic data were obtained via the National Cancer Institute Genomic Data Commons for Genotypes and Phenotypes (accession phs001444.v1.p1) and analyzed for genetic variants and RNA-seq expression as described in the supplemental Methods.
Glycopeptide mass spectrometry of lymphoma-derived Fabs
Procedures for generating and purifying lymphoma fragment antigen-binding factors (Fabs) are described in the supplemental Methods. Fabs were digested separately with trypsin and chymotrypsin (Promega) at a 1:30 (w/w) ratio in 50 mM tris(hydroxymethyl)aminomethane (Tris) and HCl (pH 8.0). Glycopeptides were eluted using C18 Zip-tip pipette tips (Merck Millipore), dried, resuspended in 0.1% formic acid, and analyzed by nano liquid chromatography-electrospray ionization mass spectrometry with an Easy-nLC 1200 system and a Fusion mass spectrometer (Thermo Fisher Scientific) using higher-energy collisional dissociation fragmentation. Peptides were separated using an Easy-Spray PepMap RSLC C18 column (75 µm × 75 cm) with a 0% to 32% acetonitrile linear gradient in 0.1% formic acid for 240 minutes followed by 80% acetonitrile in 0.1% formic acid for 35 minutes (flow rate, 200 nL/min; spray voltage, 2.8 kV; capillary temperature, 275°C; collisional energy, 50%). Glycopeptide fragmentation data were extracted using Byonic and Byologic software (Protein Metrics). The peptide was scored as true-positive when the correct b and y fragment ions were observed along with oxonium ions corresponding to the glycan identified (supplemental Table 1). The chromatographic areas for each true-positive peptide with the same amino acid sequence were compared to determine the relative amounts of each glycoform at individual sites.
Determination of L14 Fab crystal structure and heterotypic cell clustering
Determination of the purified L14 Fab crystal structure following X-ray diffraction data recording, indexing, integration, and scaling was performed as described in the supplemental Methods. Fab atomic coordinates and structure factors have been deposited in the Protein Data Bank (access code 6ZEC; supplemental Table 2 and PDB report). Heterotypic cell clustering was determined by flow cytometry and by inverted fluorescence microscopy.
For flow cytometry, Raji, Raji/DC-SIGN, and monocyte-derived dendritic cells (MoDCs) (supplemental Methods) were labeled with carboxyfluorescein diacetate succinimidyl ester (CFSE) (10 minutes at 37°C in phosphate-buffered saline), and lymphoma cells were stained with DiD (Invitrogen) (30 minutes at 37°C in phosphate-buffered saline). Cells were washed 3 times before coculture in 1 mM calcium medium. Lymphoma cells were cocultured with Raji or Raji/DC-SIGN (1:1 ratio, 30 minutes, 37°C), or with MoDCs (1:5 ratio, 2 hours, 37°C). Anti-DC-SIGN antibody hIgG1-D1 (humanized AZN-D1 05E03) was added (10 nM) to Raji/DC-SIGN and MoDCs for 20 minutes before or for 2 hours during coculture at 37°C. Cells were fixed in 0.5% paraformaldehyde, and clustering was measured in the live cell population using a FACSCanto-II flow cytometer and FlowJo software. For microscopy, Raji and Raji/DC-SIGN were labeled with CFSE (10 minutes), and lymphoma cells were stained with PKH26 (Sigma-Aldrich) (5 minutes). Clustering was analyzed by using an Olympus IX81 microscope.
Results
Incidence and location of acquired N-glycosylation sites in the IGHV of DLBCL subsets
Incidence of AGSs was analyzed in 321 samples from primary DLBCL. These included 309 samples from the Genomic Data Commons (GDC) database portal,3,28 and 12 from our tissue banks; there were 92 GCB-DLBCL and 180 ABC-DLBCL samples (Figure 1; supplemental Table 3). In this cohort, selected for DLBCL with IGHV homology to germline <98%, the mean somatic hypermutation frequency was higher in GCB-DLBCL than in ABC-DLBCL (Figure 1A), in line with previous studies.12,29 The incidence of AGSs was strikingly different between GCB (60%) and ABC (13%) subsets (P < .0001), and the unclassified subset had an intermediate level (Figure 1B).
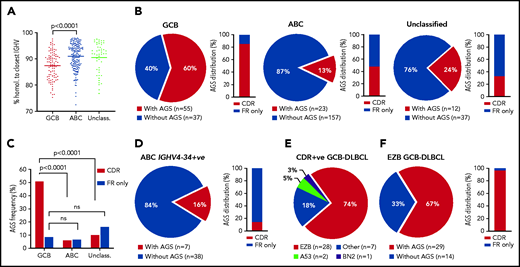
Frequency and location of AGSs in the Ig heavy chain variable region of DLBCL subsets. Tumor IGHV-IGHD-IGHJ-IGHC rearrangements from primary DLBCL cases were analyzed according to the IMGT/V-QUEST numbering system, and NxS/T motifs acquired by somatic hypermutation (AGSs) were identified. The pie charts show the frequency of rearrangements with at least 1 AGS or no AGSs. Bar charts identify the percentage of rearrangements with sites containing at least 1 AGS in the CDR or AGSs in the FR only . (A) Homology (%) of the tumor IGHV transcript sequence to the closest germline sequence in GCB-, ABC- and unclassified DLBCLs. Horizontal bars indicate the mean. (B) Frequency of rearrangements with AGSs (pie charts) and their distribution in the CDR or FR only (bar charts), divided by COO subset (GCB-, ABC- and unclassified DLBCLs). (C) Frequency of rearrangements with AGSs in the CDR or the FR only relative to the total number of GCB-, ABC- and unclassified DLBCLs. (D) Frequency of rearrangements with AGSs (pie chart) and their distribution in the CDR or FR only (bar chart) in the ABC-DLBCL using IGHV4-34. (E) Distribution of genetic subtypes (according to LymphGen algorithm) within GCB-DLBCL having acquired sites in the CDR. (F) Frequency of rearrangements with AGSs (pie chart) and their percent distribution in the CDR or FR only (bar chart) in GCB-DLBCLs assigned to the EZB genetic subtype according to the LymphGen algorithm. +ve, positive; ns, not significant.
Frequency and location of AGSs in the Ig heavy chain variable region of DLBCL subsets. Tumor IGHV-IGHD-IGHJ-IGHC rearrangements from primary DLBCL cases were analyzed according to the IMGT/V-QUEST numbering system, and NxS/T motifs acquired by somatic hypermutation (AGSs) were identified. The pie charts show the frequency of rearrangements with at least 1 AGS or no AGSs. Bar charts identify the percentage of rearrangements with sites containing at least 1 AGS in the CDR or AGSs in the FR only . (A) Homology (%) of the tumor IGHV transcript sequence to the closest germline sequence in GCB-, ABC- and unclassified DLBCLs. Horizontal bars indicate the mean. (B) Frequency of rearrangements with AGSs (pie charts) and their distribution in the CDR or FR only (bar charts), divided by COO subset (GCB-, ABC- and unclassified DLBCLs). (C) Frequency of rearrangements with AGSs in the CDR or the FR only relative to the total number of GCB-, ABC- and unclassified DLBCLs. (D) Frequency of rearrangements with AGSs (pie chart) and their distribution in the CDR or FR only (bar chart) in the ABC-DLBCL using IGHV4-34. (E) Distribution of genetic subtypes (according to LymphGen algorithm) within GCB-DLBCL having acquired sites in the CDR. (F) Frequency of rearrangements with AGSs (pie chart) and their percent distribution in the CDR or FR only (bar chart) in GCB-DLBCLs assigned to the EZB genetic subtype according to the LymphGen algorithm. +ve, positive; ns, not significant.
In GCB-DLBCL, there was no skewed IGHV use, and AGSs accumulated in multiple IGHV genes, irrespective of IgM or IgG isotype (supplemental Table 3), and 85% of the AGSs were located in the complementarity-determining regions (CDRs), accounting for 51% of all GCB-DLBCLs (Figure 1C). This differed significantly from ABC-DLBCL, for which only 6% of the AGSs were located in the CDR. This difference was even more striking in the ABC-DLBCLs using IGHV4-34 (95% IgM), known to be overused in this subset (25% of all ABC-DLBCLs in this analysis), which acquired sites infrequently (16%) and exceptionally in the CDR (2%; Figure 1D). These data indicated that the differential frequency of AGSs between subsets was particularly evident in the CDR of GCB-DLBCL. The frequency in the framework regions (FRs) was instead low and similar between GCB-DLBCL and the other subtypes (Figure 1B).
Genetic features of the GCB-DLBCLs with N-glycosylation sites acquired in the CDR
In all, 307 samples were available for analysis of genetic subtype and mutational profile (supplemental Figure 1A; supplemental Tables 3 and 4).3 The GCB-DLBCLs with AGSs in the CDR (CDR+) were mainly the EZB subtype (74%), and 26% were assigned to either no specific subtype (18%) or, less frequently, to A53 (5%) or BN2 (3%) (Figure 1E). In contrast, the CDR– GCB-DLBCLs were more heterogeneous with fewer assigned to EZB (36%; P < .001) and the remaining 64% to no specific subtype (33%), BN2 (17%), ST2 (9%), or A53 (5%) (supplemental Figure 1B). Concerning location, the majority (97%) of AGSs in EZB were in the CDRs (Figure 1F).
We focused on CDR+ EZBs (65% of all EZBs; Figure 1F) and compared their genetic features to CDR– EZBs (supplemental Tables 4 and 5; supplemental Figure 2). The epigenetic modifier lesions were similarly frequent in the CDR+ and CDR– EZBs. In contrast, lesions of BCL2 were more frequent in the CDR+ (78% translocations and 62.5% mutations) than in the CDR– EZB (33%, P = .008; and 15%, P = .013). Another striking difference was the significant enrichment of either single-copy deletion or mutation of PTEN in the CDR+ (45.4%) compared with the CDR– EZB (7.7%). PTEN regulates the PI3K/AKT pathway, which may be preferentially induced by lectin-engaged sIg-Mann.22 Mutations of PTEN, leading to its downregulation, may amplify the antigen-independent signal of CDR+ lymphomas.22,30 These data documented that the majority of CDR+ GCB-DLBCLs were of the EZB subtype (74%). This subtype could now be divided into CDR+ EZB, enriched with BCL2 translocations or mutations reminiscent of the cell of origin (COO) of FL, and CDR– EZB with a potentially distinct COO.
Structure and composition of the acquired glycans in the Ig variable region
To characterize the nature of the glycans acquired at CDR and FR sites, we analyzed the structural features of the variable region oligosaccharides of 2 lymphomas, L14 and L29 (Figure 2A; supplemental Figure 3). L14 was chosen because it also used IGHV4-34, known to contain the germline N57 site in the heavy chain CDR2 (HCDR2), which would be expected not to be glycosylated.31 The single acquired site in L14 was located in the HCDR1 (N38). The 3 acquired sites in L29 were in the HCDR2 (N55), HFR3 (N84), and kappa light chain CDR3 (KCDR3, N107).

Glycan composition and structure of the lymphoma-derived Fabs. Determination of the crystal structure of L14 and glycan analysis of Fabs L14 and L29 that have N-glycan sites in both the CDR loops and the FR. (A) Schematic representation of the Ig variable heavy (H) and kappa light (κ) chain pairs of L29 and L14 displaying the location of the AGSs and of the natural N57 glycosylation site. Sites are numbered according to the IMGT/V-QUEST numbering system. Distribution of each site is represented relative to CDR or FR and colored by predominant glycan composition. Pie charts are colored according to the proportion of oligomannose-type glycans, processed complex-type glycans, and no glycans at each site. At least 1 CDR AGS is always occupied by glycans terminating at oligomannose-type in both L14 and L29, whereas the site in FR3 of L29 is predominantly but not always occupied by complex glycans. (B) Site-specific glycan compositions detected for L29 and L14 as determined by liquid chromatography-mass spectrometry. Bars represent the relative abundance of each category of glycan. Oligomannose-type (green) glycans are categorized according to the number of mannose residues (M9-M5), hybrids by the presence/absence of fucose (F), and complex-type glycans (magenta) according to the number of N-acetyl hexosamine structures detected (HexNAc) and the presence or absence of fucose. The proportion of AGSs without a glycan attached is shown as a gray bar. (C) Structure of the L14 Fab at 1.65 Å resolution. The Ig heavy chain (HC) is light gray and the Ig κ light chain (KC) is dark gray. CDR loops are shown: KCDR1 (red), KCDR2 (yellow), KCDR3 (light blue), HCDR1 (magenta), HCDR2 (purple), and HCDR3 (blue). The amino acids Q44, N57, and E110 that interact with the glycan at position N38 are shown as sticks. Their carbon atoms are colored according to the CDR on which they are present, whereas their oxygen atoms are red and their nitrogen atoms are blue. The 2 resolved GlcNAc residues at N38 are colored by atom with carbon in green, oxygen in red, and nitrogen in blue. Atoms likely to form electrostatic interactions with the N38 glycan are shown as dashed yellow lines. The representation in the left panel is rotated by 100° on the y-axis and 20° on the x-axis in the right panel to visualize the contacts of the glycan to itself and to the protein. Maximum likelihood-weighted 2Fo-Fc electron density obtained for the glycan at N38 is shown (green mesh).
Glycan composition and structure of the lymphoma-derived Fabs. Determination of the crystal structure of L14 and glycan analysis of Fabs L14 and L29 that have N-glycan sites in both the CDR loops and the FR. (A) Schematic representation of the Ig variable heavy (H) and kappa light (κ) chain pairs of L29 and L14 displaying the location of the AGSs and of the natural N57 glycosylation site. Sites are numbered according to the IMGT/V-QUEST numbering system. Distribution of each site is represented relative to CDR or FR and colored by predominant glycan composition. Pie charts are colored according to the proportion of oligomannose-type glycans, processed complex-type glycans, and no glycans at each site. At least 1 CDR AGS is always occupied by glycans terminating at oligomannose-type in both L14 and L29, whereas the site in FR3 of L29 is predominantly but not always occupied by complex glycans. (B) Site-specific glycan compositions detected for L29 and L14 as determined by liquid chromatography-mass spectrometry. Bars represent the relative abundance of each category of glycan. Oligomannose-type (green) glycans are categorized according to the number of mannose residues (M9-M5), hybrids by the presence/absence of fucose (F), and complex-type glycans (magenta) according to the number of N-acetyl hexosamine structures detected (HexNAc) and the presence or absence of fucose. The proportion of AGSs without a glycan attached is shown as a gray bar. (C) Structure of the L14 Fab at 1.65 Å resolution. The Ig heavy chain (HC) is light gray and the Ig κ light chain (KC) is dark gray. CDR loops are shown: KCDR1 (red), KCDR2 (yellow), KCDR3 (light blue), HCDR1 (magenta), HCDR2 (purple), and HCDR3 (blue). The amino acids Q44, N57, and E110 that interact with the glycan at position N38 are shown as sticks. Their carbon atoms are colored according to the CDR on which they are present, whereas their oxygen atoms are red and their nitrogen atoms are blue. The 2 resolved GlcNAc residues at N38 are colored by atom with carbon in green, oxygen in red, and nitrogen in blue. Atoms likely to form electrostatic interactions with the N38 glycan are shown as dashed yellow lines. The representation in the left panel is rotated by 100° on the y-axis and 20° on the x-axis in the right panel to visualize the contacts of the glycan to itself and to the protein. Maximum likelihood-weighted 2Fo-Fc electron density obtained for the glycan at N38 is shown (green mesh).
The 2 CDR glycan sites of L29 terminated at mannoses, with Man8GlcNAc2 dominating the HCDR2 site and Man5GlcNAc2 dominating the KCDR3 site (Figure 2A-B). The HFR3 site was occupied by complex glycans, indicating that it was fully processed by the endoplasmic reticulum and Golgi α-mannosidases and was not under the same processing restraints as the CDR sites (Figure 2A). The L14 Fab glycans detected at the HCDR1 site were also oligomannose-type (Figure 2A-B). The predominant glycan detected was Man6GlcNAc2. In line with our previous observations, no glycans could be detected at the N57 germline site (Figure 2A).
To understand the local steric environment surrounding the N-glycans, we resolved the crystal structure of the L14 Fab to 1.65 Å (Figure 2C). This structure revealed that the N38 site was buried among the CDR loops. Because of the intrinsically flexible nature of N-glycans, we could not accurately resolve the N-glycan beyond the first 2 GlcNAc residues. However, the presence of oligomannose-type glycans at N38 can be rationalized because the glycan-processing enzymes are likely to be prevented from making extensive contacts with the target glycan on account of its interaction with residues within the HCDR2, HCDR3, and KCDR3 loops. Prominent interactions with GlcNAc residues of the mannosylated glycan were mediated by S108 and E110 in the HCDR3 loop. The final key contact observed was between the Q44 side chain in HFR2. The Q44 side chain is oriented internally and is inaccessible to solvent. So its interaction with the glycan seems possible only because the glycan itself is buried in the CDR loops. Lack of electron density for any glycan at N57 in HCDR2 provided further evidence that this germline site was unoccupied. This position contacts the GlcNAc acetyl group, suggesting that N57 cannot be occupied by a glycan without disrupting the Fab structure. These data suggest that the buried nature of the glycan region likely inhibits the trimming activity of the mannosidases in the endoplasmic reticulum and early Golgi apparatus, resulting in the presentation of oligomannose-type glycans on the mature protein.
Mannosylated Ig is expressed at the cell surface
The mannosylation status of sIg was analyzed enzymatically in CDR+ primary samples and cell lines (supplemental Tables 6 and 7). In all cases, sodium dodecyl sulfate polyacrylamide gel electrophoresis separation showed a single band of sIgμ or sIgγ chain that increased mobility after mannose cleavage by Endo H (Figure 3; supplemental Figure 4). Removal of all glycans by PNGase F increased mobility further. A CDR– cell line and normal B cells were unaffected by Endo H but were susceptible to PNGase F. These results confirm that the sIgs (either IgM or IgG) of CDR+ DLBCLs, but not CDR– DLBCLs and normal B cells, are mannosylated.
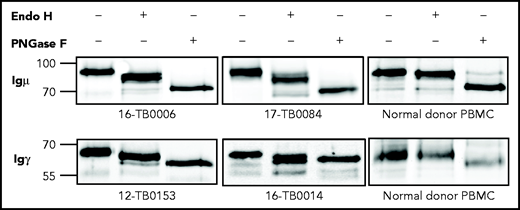
N-linked mannoses in the antigen-binding site of GCB-DLBCL are susceptible to treatment with Endo H. The glycosylation patterns of GCB-DLBCL primary samples (known to have AGSs in the CDRs) and peripheral blood mononuclear cells (PBMCs) from healthy donors were analyzed by digestion with Endo H (which cleaves mannose only) or PNGase F (which removes all glycans) after biotinylation and isolation of the cell surface proteins. Primary anti-µ or anti-γ antibodies were used to detect the surface Igµ (16-TB0006 and 17-TB0084 primary samples) or Igγ heavy chains (12-TB0153 and 16-TB0014) by immunoblotting, respectively. Numbers on the left of each gel indicate the molecular weight in kD of the reference ladder. The characteristics of the primary samples are described in supplemental Table 6. The glycosylation pattern of DLBCL cell lines with or without AGS in the CDR is shown in supplemental Figure 4.
N-linked mannoses in the antigen-binding site of GCB-DLBCL are susceptible to treatment with Endo H. The glycosylation patterns of GCB-DLBCL primary samples (known to have AGSs in the CDRs) and peripheral blood mononuclear cells (PBMCs) from healthy donors were analyzed by digestion with Endo H (which cleaves mannose only) or PNGase F (which removes all glycans) after biotinylation and isolation of the cell surface proteins. Primary anti-µ or anti-γ antibodies were used to detect the surface Igµ (16-TB0006 and 17-TB0084 primary samples) or Igγ heavy chains (12-TB0153 and 16-TB0014) by immunoblotting, respectively. Numbers on the left of each gel indicate the molecular weight in kD of the reference ladder. The characteristics of the primary samples are described in supplemental Table 6. The glycosylation pattern of DLBCL cell lines with or without AGS in the CDR is shown in supplemental Figure 4.
C-type lectin binding of the mannosylated Ig
We assessed the ability of sIg-Mann to bind to DC-SIGN, a calcium-dependent lectin known to recognize oligomannose-type glycans.32 Specificity for sIg-Mann was confirmed by the failure of DC-SIGN to bind to normal B cells, including naïve, memory, and GCB cells (supplemental Figure 5A) and by the loss of DC-SIGN binding after Endo H digestion (supplemental Figure 5B).
Ten DLBCL primary samples were available for the DC-SIGN binding assay (supplemental Table 6). DC-SIGN binding to the phenotypically defined tumor cells was observed in 7 of 10 samples (Figure 4A). The 7 samples that bound DC-SIGN were all CDR+ GCB-DLBCLs. Conversely, the 3 DC-SIGN non-binders were 1 CDR– GCB-DLBCL, and 2 ABC-DLBCLs with no sites. Analysis of 10 cell lines (supplemental Table 7) confirmed that, like in the primary samples, binding occurred in all of the CDR+ GCB-DLBCLs, but not in the CDR– GCB-DLBCLs with FR sites (OCI-Ly7 and WSU-DLCL2) or in the ABC-DLBCLs (Figure 4B; supplemental Table 7; supplemental Figure 5B-C). Binding to tumor cells seemed to be homogeneous, with no subpopulations unable to bind.
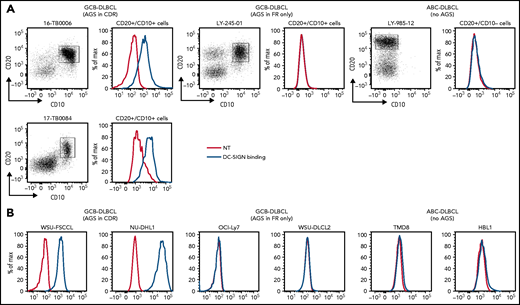
DC-SIGN binds specifically to the sIg-Mann GCB-DLBCL cells. Binding of recombinant DC-SIGN was analyzed in primary samples and DLBCL cell lines by flow cytometry after incubation with fluorescein isothiocyanate (FITC)-conjugated anti-Fc antibody. Blue lines represent binding of DC-SIGN, red lines represent binding of the secondary antibody in the untreated control. (A) DC-SIGN binding to the clonal CD20+/CD10+ of GCB-DLBCL primary samples or CD20+/CD10– ABC-DLBCL tumor population primary samples. (B) DC-SIGN binding in GCB-DLBCL (with AGSs in the CDR or in the FR only) and ABC-DLBCL cell lines (not having AGSs). Supplemental Tables 6 and 7 show the intensity of DC-SIGN binding to the primary samples and cell lines. NT, untreated.
DC-SIGN binds specifically to the sIg-Mann GCB-DLBCL cells. Binding of recombinant DC-SIGN was analyzed in primary samples and DLBCL cell lines by flow cytometry after incubation with fluorescein isothiocyanate (FITC)-conjugated anti-Fc antibody. Blue lines represent binding of DC-SIGN, red lines represent binding of the secondary antibody in the untreated control. (A) DC-SIGN binding to the clonal CD20+/CD10+ of GCB-DLBCL primary samples or CD20+/CD10– ABC-DLBCL tumor population primary samples. (B) DC-SIGN binding in GCB-DLBCL (with AGSs in the CDR or in the FR only) and ABC-DLBCL cell lines (not having AGSs). Supplemental Tables 6 and 7 show the intensity of DC-SIGN binding to the primary samples and cell lines. NT, untreated.
The conclusion is that AGSs in the CDRs are occupied by oligomannose-type glycans able to bind DC-SIGN, but those in the FRs are not. Thus, location of the glycan acceptor motifs in the CDRs seems to be critical for mannosylation and for conferring the ability to bind DC-SIGN. This is a tumor-related feature of a subset of GCB-DLBCLs that is not evident in normal B cells and not found in ABC-DLBCLs.
DC-SIGN induces sIg-Mann–mediated low-level intracellular signals in DLBCL
To assess the functional competence of sIg-Mann in DLBCL, we measured SYK phosphorylation (pSYK) in sIg-Mann+ samples and cell lines after exposure to DC-SIGN or anti-Ig (Figure 5A). We selected a Phosflow assay that allowed detection of signals within the tumor (CD20+/BCL2hi) population and excluded non-tumor cells (supplemental Figure 6A).33 We found pSYK induction by DC-SIGN in both the primary DLBCL samples and the GCB-DLBCL lines (Figure 5A; supplemental Figure 6B-C). Levels of phosphorylation induced by DC-SIGN were lower than those induced by anti-Ig, and levels and kinetics varied between samples. In the ABC cell line TMD8, phosphorylation of SYK was not induced by DC-SIGN, but cells responded to anti-Ig, as expected. By using additional immunoblot analyses, we also found that pAKT and pERK levels were increased after 15 minutes of treatment with DC-SIGN (Figure 5B). Preincubation of DC-SIGN with the hIgG1-D1 antibody, which is specific for the DC-SIGN carbohydrate-recognition domain,23,34-36 inhibited the capacity of DC-SIGN to induce signaling in sIg-Mann+ lymphoma cells of either a primary sample or a cell line (Figure 5C; supplemental Figure 6D), confirming that DC-SIGN–induced signaling occurred by engagement with the sIg oligomannose-type glycans.
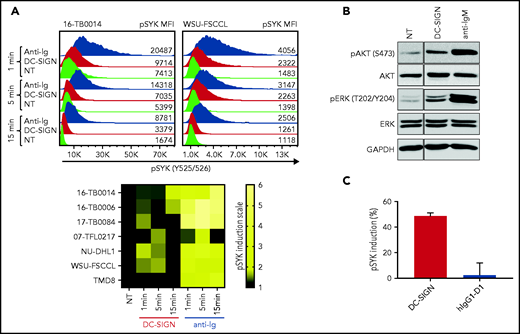
DC-SIGN mediates low-level antigen-independent signaling in sIg-Mann+ cells. (A) The histograms show SYK phosphorylation at Y525/526 in a representative sIg-Mann+ primary sample (16-TB0014) and in the WSU-FSCCL cell line after stimulation with DC-SIGN (red), anti-Ig (blue), or no treatment (green) (top). Geometric mean fluorescence intensity (MFI) levels of pSYK are shown for each condition. Heat-map of DC-SIGN–mediated and anti-Ig–mediated signaling in all cell lines and primary samples analyzed at 1, 5, and 15 minutes. MFI of pSYK after stimulation was normalized with pSYK MFI of the untreated (NT) sample at the respective time point (NT sample was normalized to 1) (bottom). The statistical difference between DC-SIGN and anti-Ig stimulation was significant at each time point (P = .03; Wilcoxon signed-rank test). (B) Immunoblotting of AKT phosphorylation at S473 and ERK phosphorylation at T202/Y204 in the primary DLBCL sample 17-TB0084 after exposure to DC-SIGN or anti-IgM or left untreated (NT) for 15 minutes. Glyceraldehyde-3-phosphate dehydrogenase (GAPDH) was used as the loading control. (C) Soluble recombinant DC-SIGN was incubated with 500 nM hIgG1-D1 before treating NU-DHL1 cells. Phosphorylation of SYK at Y525/526 was measured by flow cytometry. Data are represented as the mean ± standard error of the mean (SEM) of 3 independent experiments. Supplemental Tables 6 and 7 provide sIg characteristics and DC-SIGN binding of the primary samples and cell lines.
DC-SIGN mediates low-level antigen-independent signaling in sIg-Mann+ cells. (A) The histograms show SYK phosphorylation at Y525/526 in a representative sIg-Mann+ primary sample (16-TB0014) and in the WSU-FSCCL cell line after stimulation with DC-SIGN (red), anti-Ig (blue), or no treatment (green) (top). Geometric mean fluorescence intensity (MFI) levels of pSYK are shown for each condition. Heat-map of DC-SIGN–mediated and anti-Ig–mediated signaling in all cell lines and primary samples analyzed at 1, 5, and 15 minutes. MFI of pSYK after stimulation was normalized with pSYK MFI of the untreated (NT) sample at the respective time point (NT sample was normalized to 1) (bottom). The statistical difference between DC-SIGN and anti-Ig stimulation was significant at each time point (P = .03; Wilcoxon signed-rank test). (B) Immunoblotting of AKT phosphorylation at S473 and ERK phosphorylation at T202/Y204 in the primary DLBCL sample 17-TB0084 after exposure to DC-SIGN or anti-IgM or left untreated (NT) for 15 minutes. Glyceraldehyde-3-phosphate dehydrogenase (GAPDH) was used as the loading control. (C) Soluble recombinant DC-SIGN was incubated with 500 nM hIgG1-D1 before treating NU-DHL1 cells. Phosphorylation of SYK at Y525/526 was measured by flow cytometry. Data are represented as the mean ± standard error of the mean (SEM) of 3 independent experiments. Supplemental Tables 6 and 7 provide sIg characteristics and DC-SIGN binding of the primary samples and cell lines.
Direct interaction between sIg-Mann+ lymphoma cells and DC-SIGN–expressing cells
We assessed the ability of sIg-Mann+ lymphoma cell lines to interact with the DC-SIGN–transduced Raji cell line (Raji/DC-SIGN) or with MoDCs (Figure 6; supplemental Figure 7), which express DC-SIGN after treatment with interleukin-4 (IL-4).23 The flow cytometry and fluorescence microscopy assays documented that sIg-Mann+ lymphoma cells clustered with both Raji/DC-SIGN (but not with parental Raji) and MoDCs (Figure 6A-B). Conversely, sIg-Mann– lymphoma cells failed to cluster with Raji/DC-SIGN (supplemental Figure 8A).

The specific interaction of sIg-Mann+ lymphoma cells and DC-SIGN–expressing cells. (A-B) sIg-Mann+ lymphoma cells form clusters round DC-SIGN–expressing cells. (A) Flow cytometry analysis of clustering between sIg-Mann+ DLBCL lines (WSU-FSCCL or NU-DHL1) and Raji/DC-SIGN cells (top), parental Raji cells (middle), or MoDCs (bottom). (B) Inverted fluorescence microscopy images of clustering between sIg-Mann+ DLBCL lines (WSU-FSCCL or NU-DHL1) and either Raji/DC-SIGN (top) or Raji cells (bottom). (C-E) The interaction of sIg-Mann+ lymphoma cells and DC-SIGN–expressing cells is specifically inhibited or interrupted by the anti-DC-SIGN antibody hIgG1-D1. (C-D) Raji/DC-SIGN or MoDCs were treated with 10 nM hIgG1-D1 or left untreated (NT), before coculture with WSU-FSCCL or NU-DHL1. (C) Clustering of WSU-FSCCL with Raji/DC-SIGN was determined by flow cytometry (left) and inverted fluorescence microscopy (right). (D) Percent of clustering, as determined by flow cytometry in the presence or absence of hIgG1-D1 was calculated as (double-positive population) × 2/(2 × double-positive population + single-positive carboxyfluorescein diacetate succinimidyl ester (CFSE) + single-positive DiD). (E) Raji/DC-SIGN cells were cultured with WSU-FSCCL or NU-DHL1 for 30 minutes. HIgG1-D1 (10 nM) or medium (NT) was subsequently added to the coculture, and clustering was measured after 2 hours by flow cytometry. Clustering with WSU-FSCCL is shown. Data are represented as mean ± SEM of at least 2 independent experiments.
The specific interaction of sIg-Mann+ lymphoma cells and DC-SIGN–expressing cells. (A-B) sIg-Mann+ lymphoma cells form clusters round DC-SIGN–expressing cells. (A) Flow cytometry analysis of clustering between sIg-Mann+ DLBCL lines (WSU-FSCCL or NU-DHL1) and Raji/DC-SIGN cells (top), parental Raji cells (middle), or MoDCs (bottom). (B) Inverted fluorescence microscopy images of clustering between sIg-Mann+ DLBCL lines (WSU-FSCCL or NU-DHL1) and either Raji/DC-SIGN (top) or Raji cells (bottom). (C-E) The interaction of sIg-Mann+ lymphoma cells and DC-SIGN–expressing cells is specifically inhibited or interrupted by the anti-DC-SIGN antibody hIgG1-D1. (C-D) Raji/DC-SIGN or MoDCs were treated with 10 nM hIgG1-D1 or left untreated (NT), before coculture with WSU-FSCCL or NU-DHL1. (C) Clustering of WSU-FSCCL with Raji/DC-SIGN was determined by flow cytometry (left) and inverted fluorescence microscopy (right). (D) Percent of clustering, as determined by flow cytometry in the presence or absence of hIgG1-D1 was calculated as (double-positive population) × 2/(2 × double-positive population + single-positive carboxyfluorescein diacetate succinimidyl ester (CFSE) + single-positive DiD). (E) Raji/DC-SIGN cells were cultured with WSU-FSCCL or NU-DHL1 for 30 minutes. HIgG1-D1 (10 nM) or medium (NT) was subsequently added to the coculture, and clustering was measured after 2 hours by flow cytometry. Clustering with WSU-FSCCL is shown. Data are represented as mean ± SEM of at least 2 independent experiments.
Incubation of Raji/DC-SIGN or MoDCs with hIgG1-D1 efficiently prevented cluster formation with sIg-Mann+ cells (Figure 6C-D; supplemental Figure 8B). Furthermore, the addition of hIgG1-D1 after coculture disrupted preformed clusters (Figure 6E), confirming the specificity of the sIg-Mann/DC-SIGN interaction. These data show that cell-cell interaction occurs between lymphoma cells expressing sIg-Mann and DC-SIGN–expressing cells, including MoDCs.
Maintenance of sIg-Mann function after transformation from FL to DLBCL
IGHV-IGHD-IGHJ rearrangement, DC-SIGN binding, and sIg-Mann–mediated signaling capacity were investigated in a patient with biopsies available at the time of FL diagnosis and after transformation to DLBCL (supplemental Figure 9). IGHV-IGHD-IGHJ rearrangements were clonally related, and the AGSs in the CDR3 of the primary FL were preserved at transformation. The AGSs were occupied by an oligomannose-type glycan, as documented by DC-SIGN binding of the entire clonal population with a similar pattern at both time points. DC-SIGN induced SYK phosphorylation, and the anti-DC-SIGN hIgG1-D1 efficiently prevented cluster formation at both times.
The finding in 3 previous patients that the AGS persists through a transformation from FL to DLBCL despite ongoing somatic hypermutation suggested that the influence of sIg-Mann continued.16 The results from this new case demonstrate that oligomannose-type glycans occupying the sIg antigen-binding site preserve structure and function and that retention of DC-SIGN binding continues after transformation.
Association of sIg-Mann with clinical progression of DLBCL
The observation that 65% of EZBs acquired sites in the CDRs and that 35% did not (Figure 1F) prompted us to investigate the association of sIg-Mann with clinical progression in this subtype (supplemental Table 8). The CDR+ EZB progressed more rapidly than the CDR– EZB (P = .007; Figure 7A). However, 44% of the CDR+ EZBs had an MYC translocation (EZB MYC+) compared with 18% of the CDR– EZBs (P = .1), and the more rapid progression of the CDR+ lost statistical significance within the EZB MYC+ (P = .152), possibly because of small numbers and MYC overexpression mastering the transcriptional profile (supplemental Figure 10).3 To avoid this, EZB MYC– lymphomas were investigated separately. Here, although numbers were limited, CDR+ EZB progressed significantly faster than CDR– EZB (P = .037, Figure 7B). These data suggested that the acquisition of oligomannose-type glycans in the antigen-binding sites is associated with more rapid progression.
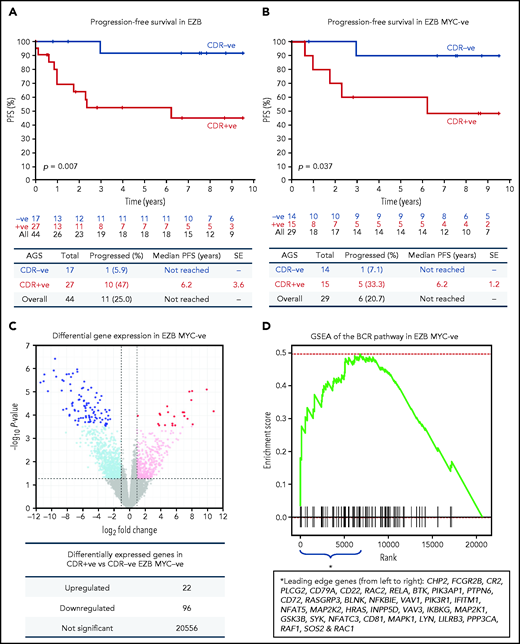
Progression-free survival and gene expression profile of EZB lymphomas acquiring N-glycosylation sites in the CDR. (A-B) Progression-free survival (PFS) was determined by the Kaplan-Meier method using log-rank statistics. The number of patients at risk is indicated in blue (CDR–) or in red (CDR+) at each time point (years). (A) PFS in EZB GCB-DLBCL with N-glycosylation sites acquired in the CDR of the tumor Ig (CDR+) or not (CDR–). (B) PFS in CDR+ and CDR– EZB GCB-DLBCL without MYC translocation (EZB MYC–). (C-D) Differential gene expression and BCR gene set enrichment in CDR+ compared with CDR– EZB MYC– DLBCL. (C) Each point represents a gene and the fold change and P value for differential expression in CDR+ vs CDR– EZB MYC– DLBCL. CDR+ had higher expression of positive log2 fold changes, and CDR– had higher expression of negative log2 fold changes. Gray points were not differentially expressed genes. Light blue and magenta points were differentially expressed at P = .05, whereas blue and red points were differentially expressed at false discovery rate of 0.05 after controlling for multiple testing (Benjamini-Hochberg procedure). (D) Gene set enrichment analysis (GSEA) plot showing the enrichment of BCR signaling pathway genes in the log2 fold change ranked genes for CDR+ vs CDR–. Enrichment of the BCR pathway toward the beginning of the ranked list indicated that the BCR pathway was enriched in genes more highly expressed in CDR+ than in CDR– EZB MYC–. Leading-edge genes (ie, those observed on the left edge of the green curve) in the BCR pathway are listed in the same order as they appear on the x-axis.
Progression-free survival and gene expression profile of EZB lymphomas acquiring N-glycosylation sites in the CDR. (A-B) Progression-free survival (PFS) was determined by the Kaplan-Meier method using log-rank statistics. The number of patients at risk is indicated in blue (CDR–) or in red (CDR+) at each time point (years). (A) PFS in EZB GCB-DLBCL with N-glycosylation sites acquired in the CDR of the tumor Ig (CDR+) or not (CDR–). (B) PFS in CDR+ and CDR– EZB GCB-DLBCL without MYC translocation (EZB MYC–). (C-D) Differential gene expression and BCR gene set enrichment in CDR+ compared with CDR– EZB MYC– DLBCL. (C) Each point represents a gene and the fold change and P value for differential expression in CDR+ vs CDR– EZB MYC– DLBCL. CDR+ had higher expression of positive log2 fold changes, and CDR– had higher expression of negative log2 fold changes. Gray points were not differentially expressed genes. Light blue and magenta points were differentially expressed at P = .05, whereas blue and red points were differentially expressed at false discovery rate of 0.05 after controlling for multiple testing (Benjamini-Hochberg procedure). (D) Gene set enrichment analysis (GSEA) plot showing the enrichment of BCR signaling pathway genes in the log2 fold change ranked genes for CDR+ vs CDR–. Enrichment of the BCR pathway toward the beginning of the ranked list indicated that the BCR pathway was enriched in genes more highly expressed in CDR+ than in CDR– EZB MYC–. Leading-edge genes (ie, those observed on the left edge of the green curve) in the BCR pathway are listed in the same order as they appear on the x-axis.
Association of sIg-Mann with differential sIg signaling in patients
To verify the hypothesis that the sIg-Mann might determine a chronic antigen-independent BCR signal affecting clinical behavior, we compared the gene expression signature of CDR+ against CDR– EZB MYC– lymphomas. CDR+ EZB MYC– had 22 genes upregulated and 96 genes downregulated (Figure 7C; supplemental Table 9). Gene set enrichment analysis revealed a significant enrichment of the BCR signaling pathway (P = .024; Figure 7D) with upregulation of genes involved with PI3K/AKT/MTORC1 pathway, glucose metabolism, mitosis, and translation (supplemental Table 10). Although these cases did not have any documentation of MYC translocation in the public data set,3 there was also upregulation of MYC-associated genes, suggesting some association between sIg-Mann and MYC activation.
Discussion
Our data describe the acquisition of N-glycosylation motifs in the antigen-binding sites of DLBCLs and add a stable and discriminatory feature to current gene-based disease subdivisions. The presence of unusual oligomannose-type glycans in the antigen-binding sites (CDRs) has now identified a new GCB-DLBCL subset with a specific ability to interact with environmental lectins through the glycan-modified sIg. Although its frequency might be slightly higher if the IG light chain is also investigated,37 our previous analysis of heavy and light chain V regions in 44 cases of FL revealed only 3 cases with sites in the light chain only, and the nature of those sites remains to be assessed. The sites in CDRs identify 51% of GCB-DLBCL cases and contrast strikingly with the ABC-DLBCL subset (6%).11,12
A recent probabilistic classification of GCB-DLBCL based on genetic features has delineated a subtype, EZB, identified by the presence of a BCL2 translocation and mutations of epigenetic modifiers.3 Our study adds another dimension of heterogeneity by documenting that a large percentage (74%) of CDR+ GCB-DLBCLs lie within the EZB subtype. The sites in EZB are located mainly in the CDRs, as might be expected, because the COO is likely to be related to FL, where such sites are universal and almost exclusively (∼90%) in the CDR.37 The acquisition of sites reflects the fact that the COO of a potentially new subtype has undergone somatic hypermutation and positive selection for this feature and that this clonal marker persists across FL and DLBCL.
However, 35% of EZBs have no AGSs in the CDR, pointing to a different derivation and revealing heterogeneity within this category. In addition, 26% of GCB-DLBCLs have AGSs in the CDR but they are not EZBs, perhaps suggesting a COO in common with FL, but with a distinct subsequent development. Along with revealing the COO, the presence of sites is likely to confer environmental support, which then sets the scene for further genetic events.
Probing for an overall function of the sIg-Mann has to account for the fact that sites are acquired by a wide range of IGV rearrangements and in different positions within the CDR. We closely inspected the added glycans in recombinant Fabs derived from 2 lymphomas and found strong evidence that structural features control glycan processing. It is rare for mammalian-expressed glycoproteins to present such homogeneous mannosylation. However, it is reminiscent of pathogens such as HIV in which, on the densely glycosylated viral envelope, several sites have exclusively underprocessed oligomannose-type glycans.38 The reason for stalling further sugar addition can be seen when ER α1,2-mannosidase-I (ERManI) is docked onto a particular glycosylation site where adjacent glycans clash and prevent processing.39 A similar mechanism seems to be occurring here in which the Fab inhibits glycan processing by steric protection of the AGS from the catalytic site buried inside the mannosidase.40 In lymphoma, in which AGSs can be added to any available IGV during somatic hypermutation, this seems to be a tumor-specific process that selects only those sites in which mannosidase processing is stalled and the resulting oligomannose-type glycans can bind DC-SIGN.41
DC-SIGN is expressed on M2-polarized macrophages and is expected to serve for heterotypic interactions with sIg-Mann in lymphoma cells.23,24,42-44 The mechanism whereby the interaction with microenvironmental DC-SIGN supports tumor cells may involve a low-level antigen-independent signal similar to those in FL cells, inducing survival and possibly MYC-mediated growth.22,25 We have found that cell-cell interaction occurs between lymphoma-expressed sIg-Mann and MoDC-expressed DC-SIGN, and it is possible that this interaction may fine-tune the sIg for adequate survival signals in DLBCL,25,45 while at the same time shielding the sIg from its original antigen46 and protecting it from potential sIg overstimulation by an alternative ligand.47
We probed the impact of the sIg-Mann on clinical behavior by investigating progression-free survival in the EZB subset. The CDR+ EZBs were enriched in MYC translocations mastering the transcriptional profile over the sIg-Mann–mediated signals. However, the concurrence of MYC translocations and AGSs is also found in endemic Burkitt lymphoma,14,27 suggesting a pathogenetic link between these 2 events. To identify a signature associated with sIg-Mann in vivo, we focused on those EZBs that did not carry an MYC translocation. In the MYC+ EZB, the number of cases investigated was too small to reach statistical value, but in the MYC– EZB, the acquisition of N-glycosylation sites identified a subset of patients with significantly more aggressive lymphoma. Validation of this observation will be required in independent studies that rigorously account for BCL2 and MYC status.48 However, the upregulation of the BCR pathway was evident in these lymphomas, which also carried an enrichment of MYC- and glycolytic-pathway genes.
The interaction between sIg-Mann and DC-SIGN depends on a non-templated posttranslational modification, which reveals a new opportunistic strategy exploited by tumor cells that behave more aggressively in patients. The interaction can be inhibited by antibodies that block the DC-SIGN carbohydrate-recognition domain.35 Even preformed clusters of interacting cells can be disrupted by antibodies, which raises the possibility that this specific dependence can be blocked in vivo, separating any sIg-Mann+ cells from their natural habitat. This focused microenvironmental disruption could lead to tumor cell stress while avoiding significant effects on normal cells. Blockade by antibodies could offer a potential new specific therapeutic approach for sIg-Mann+ lymphomas.
Acknowledgments
The authors thank Riccardo Dalla-Favera and Laura Pasqualucci (Columbia University, New York, NY) for generously providing the DLBCL cell lines; Bas van der Schoot and Martijn Verdoes (Radboud University) for providing the anti-DC-SIGN antibody; Peter Johnson for providing lymphoma specimens (University of Southampton); Kathy Potter at the Faculty of Medicine Tissue Bank (Cancer Sciences Unit, University of Southampton) for processing and storing the primary DLBCL specimens; Tom Walter (University of Oxford) for help with crystal freezing; and Diamond Light Source for beamtime (proposal mx14744) and for collecting crystallographic data.
This study was supported by grants from Blood Cancer UK/Bloodwise (18009); the Eyles Cancer Immunology Fellowship; Cancer Research UK (C2750/A23669, C36811/A29101, and C42023/A29370); the Southampton Experimental Cancer Medicine Centre and Cancer Research UK Southampton Centre core funding (C24563/A15581 and C34999/A18087) (Y.W., P.J.D., J.D.A., and M.C). The mass spectrometer was funded by the Bill and Melinda Gates Foundation through the Collaboration for AIDS Vaccine Discovery (OPP1115782) (M.C.), and crystallographic work was supported by grants from the Medical Research Council (MR/L009528/1 and MR/S007555/1) (T.A.B.). The Wellcome Centre for Human Genetics is supported by a grant from the Wellcome Centre (203141/Z/16/Z). The Genomic Variation in Diffuse Large B Cell Lymphomas study was supported by the Intramural Research Program of the National Institutes of Health (NIH), National Cancer Institute. The datasets have been accessed through the NIH database for Genotypes and Phenotypes (dbGaP). A full list of acknowledgements can be found in the supplementary note (Schmitz et al, PMID: 29641966).
Authorship
Contribution: G.C. performed research, analyzed and interpreted data, and wrote the manuscript; J.D.A. analyzed and interpreted glycans; D.J.B. designed the bioinformatic pipeline for the IG gene analysis and analyzed genetic variant data; P.R., E.A.M., and B.V.-A. helped characterize primary samples; P.J.D. generated the lymphoma-derived Fab; I.H. and K.J.M. sequenced and characterized the primary samples; Y.W. and T.A.B. analyzed and interpreted X-ray crystallography scans; J.S.B. contributed to the IG gene analysis pipeline; C.G.F. contributed anti-DC-SIGN antibodies; T.B.H.G. contributed DC-SIGN–expressing and parental cell lines; D.J.B. and G.W.W. analyzed gene expression data; J.C.S., G.P., T.B.H.G., C.G.F., L.M.S., and R.B. helped interpret and discuss the data; M.C. and T.A.B. led the structural biology research and wrote the manuscript; F.K.S. and F.F. designed the study, supervised research, interpreted data, and wrote the manuscript; and all authors reviewed and approved the manuscript.
Conflict-of-interest disclosure: The authors declare no competing financial interests.
Correspondence: Francesco Forconi, School of Cancer Sciences, Cancer Research UK Centre, University of Southampton, University Hospital, Somers Building, MP824, Tremona Rd, Southampton SO16 6YD, United Kingdom; e-mail: f.forconi@soton.ac.uk.
For original data, please contact Francesco Forconi via e-mail at f.forconi@soton.ac.uk. The tumor IG rearranged transcript sequences, genetic variants, and RNA-seq expression were identified from the National Cancer Institute Genomic Data Commons for Genotypes and Phenotypes, available under accession phs001444.v1.p1.
The online version of this article contains a data supplement.
There is a Blood Commentary on this article in this issue.
The publication costs of this article were defrayed in part by page charge payment. Therefore, and solely to indicate this fact, this article is hereby marked “advertisement” in accordance with 18 USC section 1734.

This feature is available to Subscribers Only
Sign In or Create an Account Close Modal