

Key Points
Plasma levels of GlcNAc in patients with SM correlate with advanced disease.
GlcNAc is an oncometabolite that promotes SM aggressiveness and exacerbates neoplastic mast-cell functions by chromatin remodeling.

Abstract
Systemic mastocytosis (SM) is a KIT-driven hematopoietic neoplasm characterized by the excessive accumulation of neoplastic mast cells (MCs) in various organs and, mainly, the bone marrow (BM). Multiple genetic and epigenetic mechanisms contribute to the onset and severity of SM. However, little is known to date about the metabolic underpinnings underlying SM aggressiveness, which has thus far impeded the development of strategies to leverage metabolic dependencies when existing KIT-targeted treatments fail. Here, we show that plasma metabolomic profiles were able to discriminate indolent from advanced forms of the disease. We identified N-acetyl-d-glucosamine (GlcNAc) as the most predictive metabolite of SM severity. High plasma levels of GlcNAc in patients with advanced SM correlated with the activation of the GlcNAc-fed hexosamine biosynthesis pathway in patients BM aspirates and purified BM MCs. At the functional level, GlcNAc enhanced human neoplastic MCs proliferation and promoted rapid health deterioration in a humanized mouse model of SM. In addition, in the presence of GlcNAc, immunoglobulin E-stimulated MCs triggered enhanced release of proinflammatory cytokines and a stronger acute response in a mouse model of passive cutaneous anaphylaxis. Mechanistically, elevated GlcNAc levels promoted the transcriptional accessibility of chromatin regions that contain genes encoding mediators of receptor tyrosine kinases cascades and inflammatory responses, thus leading to a more aggressive phenotype. Therefore, GlcNAc is an oncometabolite driver of SM aggressiveness. This study suggests the therapeutic potential for targeting metabolic pathways in MC-related diseases to manipulate MCs effector functions.
Introduction
Systemic mastocytosis (SM) is a KIT-driven hematopoietic neoplasm characterized by the accumulation of abnormal neoplastic mast cells (MCs) in various organs and the bone marrow (BM).1-3 SM pathology ranges from benign, chronic manifestations to highly aggressive tumors with limited therapeutic options.4,5 Patients with indolent SM (ISM) have symptoms primarily related to MC mediator release and exhibit a normal life expectancy.6 However, in advanced SM (ASM), the clinical course is aggressive, with organ impairment and failure related to excessive MC infiltration and mediator release, leading to a shortened life expectancy.7-9
Little is known about the mechanisms contributing to the malignant expansion of neoplastic MCs and their progenitors in patients with ASM. The KIT D816V mutation is a major cause of the disease, but its association with most clinical forms of SM argues against its role in disease progression.10-13 Possible explanations for the diverse clinical presentations include the co-occurrence of KIT D816V with secondary genetic lesions14-17 and epigenetic18-24 and/or microenvironment alterations25-30 that modify disease phenotype.
Reprogramming of cellular metabolism occurs as a direct consequence of oncogenic mutations and environmental cues that affect the abundance of oncometabolites by eliciting oncogenic cascades.31-34 Oncometabolites are conventional metabolites that, when aberrantly accumulated, have pro-oncogenic functions mainly via epigenetic dysregulation.34-36 The identification of oncometabolites in diagnostics and prognostics, as both novel therapeutic targets and as plasmatic biomarkers of disease,37-39 are areas of considerable interest in oncology and could lead to novel therapeutic strategies in SM. Therefore, we profiled the plasma metabolome of SM to investigate metabolic alterations and potential oncometabolites associated with SM aggressiveness.
Methods
Patient data and cell lines
Adults with SM were enrolled in a prospective, national, multicenter study sponsored by the French association for initiative and research on mast cell and mastocytosis. Diagnoses were established according to criteria provided by the World Health Organization. Twelve ASM plasma specimen taken from patients with ASM (n = 4), SM with associated hematological neoplasm (n = 6), and mast cell leukemia (n = 2), and 13 ISM specimens were used (supplemental Table 1, available on the Blood Web site). Plasma was collected in heparinized tubes and stored at −80°C until analysis. Blood and BM aspirates were obtained at diagnosis after written informed consent was obtained. Sample collections were approved by the Ethics Committee of Necker Hospital (Paris, France) and conducted in accordance with the protocols of Helsinki. The human MC lines ROSAKIT WT, ROSAKIT D816V, and ROSAKIT D816V-Gluc were used.40,41
Cell proliferation
ROSAKIT WT and ROSAKIT D816V MCs were seeded in low glucose (1 g/L) Iscove modified Dulbecco medium supplemented with 10% fetal calf serum, 100 μg/mL streptomycin, 100 IU/mL penicillin, 2 mM l-glutamine, and 1 mM sodium pyruvate at day 0 ± 20 mM N-acetyl-d-glucosamine (GlcNAc; Sigma-Aldrich, St Louis, MO). Automated cell counting was conducted on a Cellometer Auto T4 (Nexcelom Bioscience, Lawrence, MA) on days 2, 4, and 8.
Metabolomic profiling and metabolic transcript screening
Plasmatic polar metabolites were extracted from patients.42 Metabolomic profiling was conducted at the mass spectrometry platform at Beth Israel Deaconess Medical Center. Gene expression profiles from highly purified BM MCs of SM patients were generated in a previous study.43 The complete lists of functional categories are provided in supplemental Table 3. Technical details of the analysis are provided in the supplemental Methods.
Degranulation assays and cytokine staining
Degranulation was monitored by the release of β-hexosaminidase into culture supernatants.20 For intracellular cytokine analysis, cells were seeded in a low glucose medium ± 100 mM GlcNAc overnight at 37°C. Cells were then stimulated with 0.5 μg/mL immunoglobulin E (IgE)-anti-DNP and 0.2 μg/mL DNP-OVA for 3 hours. To inhibit protein exocytosis, 10 μg/mL BrefeldinA was added in the final 2 hours of stimulation. Anti-tumor necrosis factor-α (TNF-α)-PE/Cy7 or anti-interleukin-6 (IL-6)–PE antibodies (BioLegend, San Diego, CA) were used for intracellular staining and analyzed via flow cytometry. TNF-α release was measured using a mouse TNF-α high sensitivity enzyme-linked immunosorbent assay (eBioscience, San Diego, CA) following the manufacturer’s recommendations. Absorbance values were measured at 450 nm using a FLUOstar OPTIMA microplate reader.
Mice, murine BMMCs, and xenogenic transplantations
All animal studies were performed in compliance with the laws and protocols approved by the French Animal Ethics Committee (Agreement APAFISN°6743-2016091513513606v4). Murine BM-derived MCs (BMMCs) were differentiated by culturing BM from Kit D814VFl Mx1-Cre and Kit WT Mx1-Cre mice for 4 to 6 weeks in IL-3 supplemented media.44 For xenogenic transplantation, 10 × 106 ROSAKIT D816V-Gluc cells were injected into NOD-SCID IL-2R γ−/− (NSG) mice (2 groups, 5 mice per group) 24 hours after sublethal irradiation (1.5 Gy). Intraperitoneal injections of 300 mg/kg GlcNAc were administered on 5 consecutive days per week for 7 weeks. Treated animals had ad libitum access to drinking water supplemented with 50 mg/mL GlcNAc. Engraftment was assessed after 4 weeks by quantitative measurement of Gluc activity in plasma and quantitative measurement of green fluorescence protein+ (GFP+) or cyan fluorescent protein+ (CFP+) cells in peripheral blood using flow cytometry.24 Gluc activity was measured using a luminometer (PerkinElmer, Waltham, MA).40
ATAC-seq analysis
ROSAKIT WT and ROSAKIT D816V cells were cultured overnight in a low glucose (1 g/L) medium and incubated with 20 mM GlcNAc for 24 hours. An assay for transposase-accessible chromatin with high-throughput sequencing (ATAC-seq) was performed by Active Motif (Carlsbad, CA) following a previously published protocol.45
Gene expression validation
RNA was isolated using the RNAeasyPlus Kit (Qiagen, Hilden, Germany) and reverse transcribed using oligo dT12-18 primers and Superscript III (Thermo-Fisher Scientific, Carlsbad, CA). Quantitative polymerase chain reaction (PCR) was performed using Sso-Advanced Universal SYBR Green Supermix on a CFX96 Touch Real-Time PCR Detection System (BioRad, Hercules, CA) and the predesigned KICqStart SYRBR Green primers (Sigma-Aldrich) for each target.
Western blots
For protein extracts, patient BM aspirates were lysed in RIPA buffer (50 mM Tris HCl, pH 7.4, 150 mM NaCl, 0.1% sodium dodecyl sulfate, 1% Triton X100, 0.5% sodium deoxycholate) supplemented with phosphatase (PhosSTOPEASYPack; Roche, Basel, Switzerland) and protease inhibitors (Sigma-Aldrich). Samples (30 μg) were run on 10% sodium dodecyl sulfate-polyacrylamide gels and transferred to polyvinylidene fluoride membranes. Immunodetection was performed with an anti-OGlcNAc (RL2) (1:2000; Abcam, Cambridge, United Kingdom), an anti-OGT (1:1000; Abcam), an anti-OGA (1:20000), or an anti-GlcNAc kinase (NAGK; 1:10000) antibody overnight at 4°C. An anti-ERK2 antibody (1:20 000) was used for loading controls. Incubation with horseradish peroxidase-conjugated secondary antibodies (Santa Cruz Biotechnology, Dallas, TX) was performed at room temperature for one hour. Enhanced chemiluminescence and X-ray films were used to detect protein expression signals.
Passive cutaneous anaphylaxis
These experiments were performed as previously described.20 Briefly, 20 mg GlcNAc was administered by intraperitoneal injection to half of the mice (n = 20) on days 0, 1, and 2, and phosphate-buffered saline (PBS) was administered to the other half. In each group, the left ear was sensitized by a 10 μL intradermal injection of 1 μg anti-DNP IgE or vehicle in the right ear. Mice were injected intravenously 24 hours later with 0.5 mg DNP-OVA in 0.5% Evans Blue dye (Sigma-Aldrich) in PBS. One hour later, the mice were euthanized and ear sections were excised. The extravasated blue dye was then extracted and its intensity measured spectrophotometrically (optical density 650).
Quantification and statistical analysis
Statistics were calculated using Prism 6 software (GraphPad Software, San Diego, CA). Data are represented as mean ± standard deviation (SD). Significant differences between groups were determined using paired or unpaired Student t tests, or 2-way analysis of variance, unless otherwise indicated. For all tests, differences were considered significant when P < .05.
Results
Metabolomic alterations associated with SM severity
We investigated the plasmatic metabolome of 25 patients with varying degrees of SM severity (supplemental Figure 1; supplemental Table 1). A principal component analysis (PCA) showed two clusters with modest overlap between the ISM and ASM samples. Fifty-nine of the 306 identified metabolites were discriminant between these 2 classes (P < .05, fold-change >1.5) (Figure 1B; supplemental Figure 1E). Mapping the differential metabolites’ profiles to their respective biochemical pathways revealed alterations in nicotinate/nicotinamide, pyrimidine, purine, glycerophospholipid, amino sugar metabolism, arginine biosynthesis, and 1 carbon pool by folate metabolism (Figure 1C; supplemental Figure 2A). We found similar results using a new pathway-covering approach (MetaCyc database)46 (Figure 1D; supplemental Table 2).
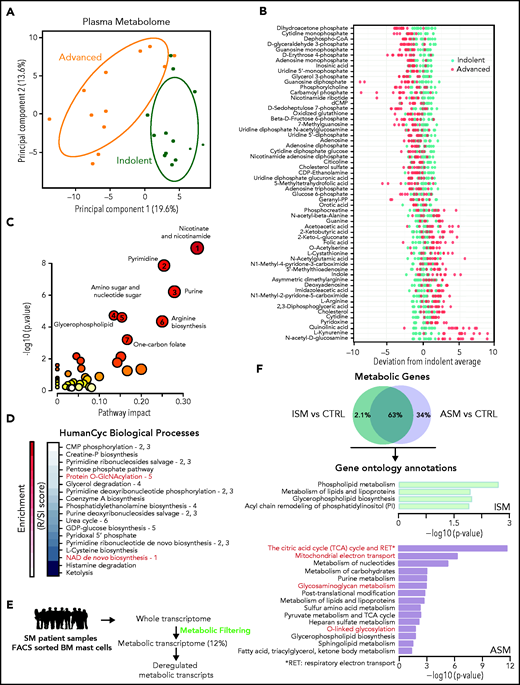
Metabolomic alterations associated with systemic mastocytosis severity. (A) Principal component analysis (PCA) of metabolites measured in indolent (green) and advanced (orange) SM plasma samples. (B) Indolent SM-based z-score plot of 59 metabolites significantly deregulated between samples from patients with ISM and AdvSM. Each dot represents 1 metabolite in 1 SM sample, and the color indicates the disease form (light green: indolent; red: advanced) (C) Metabolome view from pathway analysis performed using MetaboAnalyst 4.0. Each circle represents a different pathway, and the circle size and color shade indicate the pathway impact and P value (with red being the most significant), respectively. Selected pathways with high impact and/or high P values are labeled 1 to 7. (D) Pathway covering using HumanCyc showing the smallest pathways including differential metabolites. (E) Outline of the transcriptomic approach used to highlight significant dysregulated metabolic transcripts in sorted bone marrow mast cells (MCs) from patients with SM. (F) Enrichment of overactivated pathways between different groups of patients with SM, as identified by Enrich. The adjusted P values are shown as −log (P) values on the x-axis.
Metabolomic alterations associated with systemic mastocytosis severity. (A) Principal component analysis (PCA) of metabolites measured in indolent (green) and advanced (orange) SM plasma samples. (B) Indolent SM-based z-score plot of 59 metabolites significantly deregulated between samples from patients with ISM and AdvSM. Each dot represents 1 metabolite in 1 SM sample, and the color indicates the disease form (light green: indolent; red: advanced) (C) Metabolome view from pathway analysis performed using MetaboAnalyst 4.0. Each circle represents a different pathway, and the circle size and color shade indicate the pathway impact and P value (with red being the most significant), respectively. Selected pathways with high impact and/or high P values are labeled 1 to 7. (D) Pathway covering using HumanCyc showing the smallest pathways including differential metabolites. (E) Outline of the transcriptomic approach used to highlight significant dysregulated metabolic transcripts in sorted bone marrow mast cells (MCs) from patients with SM. (F) Enrichment of overactivated pathways between different groups of patients with SM, as identified by Enrich. The adjusted P values are shown as −log (P) values on the x-axis.
To confirm these findings at the RNA level in neoplastic MCs, the gene expression profiles of highly purified BMMCs from patients with ISM and ASM (a subtype of AdvSM, supplemental Figure 1A ) from a published study were analyzed.43 To identify transcripts involved in metabolic processes that were differentially expressed between the samples, we filtered the entire human genome to select only those transcripts that encoded for known metabolic enzymes and transporters (Figure 1E). Unlike the metabolomic approach (Figure 1A), a PCA of the transcriptomic data revealed a weak separation of ISM and ASM patients (supplemental Figure 2B). However, 180 transcripts (34%) significantly upregulated only in the ASM samples (Figure 1F). The ASM metabolic signature was highly enriched in pathways associated with oxidation-reduction processes and amino acid glycosylation (Figure 1F; supplemental Table 3). This replicated the findings at the metabolomic levels as metabolites involved in both protein O-GlcNAcylation and nicotinamide adenine dinucleotide biosynthesis were identified among the most deregulated pathways (Figure 1C). Thus, ASM presented with oxidative phosphorylation and protein glycosylation alterations, and plasma metabolic profiles were able to discriminate between different levels of SM aggressiveness.
GlcNAc is a circulating predictive metabolite of SM aggressiveness
To determine whether any components of the discriminating metabolic pathways between ASM and ISM were markers of disease aggressiveness, we performed a volcano plot analysis (Figure 2A). Compared with the ISM samples, ASM samples showed significantly decreased dihydroxyacetone phosphate levels and increased levels of GlcNAc, kynurenine, and quinolinate, which were significantly positively correlated in the same samples (supplemental Figure 3). GlcNAc is part of the hexosamine biosynthesis pathway (HBP) that is responsible for protein glycosylation, and kynurenine/quinolinate are part of the oxidative processes leading to the production of nicotinamide adenine dinucleotide. GlcNAc was the most discriminant of the 3 metabolites in terms of fold-change and significance, suggesting it would be the most robust ASM biomarker. To test this, we measured the absolute concentrations of GlcNAc by liquid chromatography tandem mass spectometry (LC-MS/MS) in randomly selected KIT D816V samples from the first cohort mixed with randomly selected KIT D816V patient samples from the CEREMAST database (supplemental Table 4). GlcNAc levels were significantly increased in the ASM (4.7 μM) compared with the ISM specimens (2.8 μM) and healthy donors (0.46 μM) (Figure 2B).
![GlcNAc is a circulating biomarker of advanced systemic mastocytosis (AdvSM). (A) Volcano plot of statistical significance against fold-change between the indolent and advanced forms of SM showing the most significantly differentially regulated metabolites linked to disease severity. (B) Plasmatic GlcNAc levels measured by LC-MS/MS in SM-related patients (n = 10, 5 ASM and 5 SM with associated hematological neoplasm [SM-AHN]), healthy donor (HD) (n = 5), allergic (n = 5), asthmatic (n = 5), acute leukemias (n = 9), chronic myeloid leukemia (CML; n = 10), myelodysplastic and myeloproliferative syndrome (MDS/MNP; n = 7), and essential thrombocythemia (ET) only (n = 10). (C) Receiver operating characteristic curve of GlcNAc concentrations between ISM and advanced SM patient samples. (D) GlcNAc and tryptase levels in SM patient samples. (E) Schematic representation of the hexosamine biosynthetic pathway (HBP) and the use of GlcNAc in the salvage pathway indicating relevant enzymes (O-linked-GlcNAc transferase [OGT], the O-GlcNAcase OGA, and GlcNAc kinase [NAGK]). (F) Lysates from 3 bone marrow biopsies from patients with MCAS, ISM, and AdvSM were immunoblotted with RL2 antibodies that detect O-GlcNAcylation (G) Quantification of the immunoblot shown in panel F by ImageJ software (National Institutes of Health). (H) Normalized transcript levels of HBP enzymes from microarray analysis performed in MCs sorted from bone marrow samples from HDs (n = 5) and patients presenting ISM (n = 14) or ASM (n = 12) disorders. The values in the graphs are presented as the means ± SD (NS [nonsignificant]; *P < .05, **P < .01, ***P < .001; 2-tailed, unpaired Student t test). AUC, area under the curve.](https://ash.silverchair-cdn.com/ash/content_public/journal/blood/138/17/10.1182_blood.2020008948/4/m_bloodbld2020008948f2.png?Expires=1769236043&Signature=0JvBbapiuDtXsyPohf7wWnMHBWcbqtG3be2j5rTq20E1vamhMymDrWWj2AecAKcbj5OTpEkKmXcqK66VlIzszVrfrhQlqMSRC~5Iym3NCoxapiYUCrNUymD84xe3BDQMh1-bBCVAMTROXV4gxwaQhNPHjBberqAnV-kYyG5WkxneItbkLubBj8LnAsAAcFCgI1~gTaAiZC9JXpWXm5tOn9qrfeEBePQSYBecB-EN2NpVtolItZDFVhSrbAG-dhRmoyK9ylaeejXap7~hGyGtWbaKUM7NRde5sPJ7WS50oEE0yKnUf-eyxnk0Kil~C-2KDpHCcJTGu2G1uJSdtToIog__&Key-Pair-Id=APKAIE5G5CRDK6RD3PGA)
GlcNAc is a circulating biomarker of advanced systemic mastocytosis (AdvSM). (A) Volcano plot of statistical significance against fold-change between the indolent and advanced forms of SM showing the most significantly differentially regulated metabolites linked to disease severity. (B) Plasmatic GlcNAc levels measured by LC-MS/MS in SM-related patients (n = 10, 5 ASM and 5 SM with associated hematological neoplasm [SM-AHN]), healthy donor (HD) (n = 5), allergic (n = 5), asthmatic (n = 5), acute leukemias (n = 9), chronic myeloid leukemia (CML; n = 10), myelodysplastic and myeloproliferative syndrome (MDS/MNP; n = 7), and essential thrombocythemia (ET) only (n = 10). (C) Receiver operating characteristic curve of GlcNAc concentrations between ISM and advanced SM patient samples. (D) GlcNAc and tryptase levels in SM patient samples. (E) Schematic representation of the hexosamine biosynthetic pathway (HBP) and the use of GlcNAc in the salvage pathway indicating relevant enzymes (O-linked-GlcNAc transferase [OGT], the O-GlcNAcase OGA, and GlcNAc kinase [NAGK]). (F) Lysates from 3 bone marrow biopsies from patients with MCAS, ISM, and AdvSM were immunoblotted with RL2 antibodies that detect O-GlcNAcylation (G) Quantification of the immunoblot shown in panel F by ImageJ software (National Institutes of Health). (H) Normalized transcript levels of HBP enzymes from microarray analysis performed in MCs sorted from bone marrow samples from HDs (n = 5) and patients presenting ISM (n = 14) or ASM (n = 12) disorders. The values in the graphs are presented as the means ± SD (NS [nonsignificant]; *P < .05, **P < .01, ***P < .001; 2-tailed, unpaired Student t test). AUC, area under the curve.
GlcNAc is a circulating biomarker of advanced systemic mastocytosis (AdvSM). (A) Volcano plot of statistical significance against fold-change between the indolent and advanced forms of SM showing the most significantly differentially regulated metabolites linked to disease severity. (B) Plasmatic GlcNAc levels measured by LC-MS/MS in SM-related patients (n = 10, 5 ASM and 5 SM with associated hematological neoplasm [SM-AHN]), healthy donor (HD) (n = 5), allergic (n = 5), asthmatic (n = 5), acute leukemias (n = 9), chronic myeloid leukemia (CML; n = 10), myelodysplastic and myeloproliferative syndrome (MDS/MNP; n = 7), and essential thrombocythemia (ET) only (n = 10). (C) Receiver operating characteristic curve of GlcNAc concentrations between ISM and advanced SM patient samples. (D) GlcNAc and tryptase levels in SM patient samples. (E) Schematic representation of the hexosamine biosynthetic pathway (HBP) and the use of GlcNAc in the salvage pathway indicating relevant enzymes (O-linked-GlcNAc transferase [OGT], the O-GlcNAcase OGA, and GlcNAc kinase [NAGK]). (F) Lysates from 3 bone marrow biopsies from patients with MCAS, ISM, and AdvSM were immunoblotted with RL2 antibodies that detect O-GlcNAcylation (G) Quantification of the immunoblot shown in panel F by ImageJ software (National Institutes of Health). (H) Normalized transcript levels of HBP enzymes from microarray analysis performed in MCs sorted from bone marrow samples from HDs (n = 5) and patients presenting ISM (n = 14) or ASM (n = 12) disorders. The values in the graphs are presented as the means ± SD (NS [nonsignificant]; *P < .05, **P < .01, ***P < .001; 2-tailed, unpaired Student t test). AUC, area under the curve.
The receiver operating characteristic curves for GlcNAc indicated that its ASM predictive value was high (Figure 2C). The concentration threshold to discriminate ISM from ASM was 3.8 μM. The plasma tryptase level is used as a minor criterion for SM as it rises during anaphylaxis. We found that GlcNAc levels were not correlated with tryptase levels (Pearson r = 0.2) in the same sample, suggesting that GlcNAc may be useful for identifying patients with modestly increased tryptase levels that are likely to have an aggressive disease phenotype (Figure 2D). GlcNAc levels were not correlated with any other available chemical parameters (supplemental Figure 4). However, we observed that high levels of GlcNAc were associated with ASM patients presenting gastrointestinal symptoms (supplemental Table 4). Altogether, this suggests that GlcNAc is a circulating predictive metabolite of SM aggressiveness.
The HBP is activated in ASM
GlcNAc fuels the HBP via the GlcNAc-salvage pathway, which is activated during glucose deficiency and has prosurvival effects (Figure 2E). GlcNAc enters the HBP by NAGK, which is activated under metabolic stress conditions and leads to the posttranslational modification of proteins by O-GlcNAcylation. To measure HBP activity in patients with MC-related diseases, protein extracts from BM aspirates were immunoblotted with an RL2 antibody that recognized O-GlcNAc moieties on proteins (supplemental Table 5) in ISM, ASM, and MC activation syndrome (MCAS). All SM samples exhibited evidence of increased O-GlcNAcylation compared with samples from patients with MCAS. The highest levels of O-GlcNAcylated proteins were found in ASM (Figure 2F-G).
Because protein O-GlcNAcylation levels reflect the activity of the HBP, the expression of a number of HBP enzymes was determined in human MCs sorted from BM of patients with SM from microarray analysis.43 Consistent with the western blot results, most enzymes in this pathway (GFAT1, PGM3, NAGK, OGT, and OGA) were upregulated in SM samples. The levels of the rate-limiting enzymes of glycolysis (PFKL) and the tricarboxylic acid cycle (IDH2, ACO2) were unchanged (Figure 2H). The transcript levels were the same between ISM and ASM, which is in agreement with the PCA (supplemental Figure 2B). Our data showed that increased levels of GlcNAc in the plasma of patients with ASM were associated with the activation of the enzymes of the HBP at the transcriptional level in sorted patient KIT D816V MCs and to high-protein O-GlcNAcylation levels in patient BM aspirate.
GlcNAc exacerbates the severity of the KIT D816V+ SM phenotype
Because high levels of GlcNAc are correlated with ASM, we tested whether GlcNAc promoted proliferation of MCs carrying the KIT D816V mutation. Human ROSAKIT D816V MCs incubated with 20 mM GlcNAc showed significantly higher proliferation rates than their nontreated counterparts (Figure 3A). This dose led to a significant increase in protein glycosylation and intracellular GlcNAc concentrations (9.7 μM) in the range of the physiologic concentration we measured in ASM plasmas (supplemental Figure 5A-B). Similar concentrations were measured in the ROSAKIT WT MCs. Therefore, the absence of an effect of GlcNAc on ROSAKIT WT cell proliferation during the experiment was not due to its inability to enter the cells. An assessment of 5-bromo-2′-deoxyuridine incorporation confirmed these observations (supplemental Figure 5C-D), suggesting oncogenic cooperation between KIT D816V signaling and GlcNAc lead to increased MC proliferation.
![GlcNAc exacerbates the severity of an advanced systemic mastocytosis (AdvSM) phenotype. (A) The proliferation of human MCs, ROSAKIT WT, and ROSAKIT D816V cells, was assessed after treatment with or without 20 mM GlcNAc, and the cells were counted using a Cellometer Auto T4 at days 0, 2, 4, and 8. (B) Schema of in vivo administration of 300 mg/kg GlcNAc to ROSAD816-Gluc transplanted mice after irradiation with 1.5 Gy (n = 10, 5 per group). (C) Measure of GlcNAc activity (in relative luciferase units [RLU]) in PBS- or GlcNAc-treated mice from week 3 (W3) to week 7 (W7). (D) Number of Gluc+ cells circulating in the plasma of mice from W3 to W7, as measured by fluorescence-activated cell sorting (FACS). (E) Number of GFP+ and CFP+ cells in the bone marrow of PBS- or GlcNAc-treated mice, as measured by FACS. (F) Number of GFP+ and CFP+ cells in the spleens of PBS- or GlcNAc-treated mice, as measured by FACS. (G) Weights of spleens at W7 in PBS or GlcNAc-treated mice. (H) Plasmatic concentration of GlcNAc measured by LC-MS/MS in nontransplanted mice, transplanted mice, and GlcNAc-treated transplanted mice. Sampling was done after 7 weeks of treatment, 2 hours after the last injection of GlcNAc. The values in the graphs are presented as the means ± SD (nonsignificant, *P < .05, **P < .01, ***P < .001; 2-tailed, unpaired Student t test).](https://ash.silverchair-cdn.com/ash/content_public/journal/blood/138/17/10.1182_blood.2020008948/4/m_bloodbld2020008948f3.png?Expires=1769236043&Signature=gcoB0TNri1NTRqlkM64095IivgBHLtrmTYRpr58oHIc0Tt-UFaTVIxdNU4C6Nin-bw~vUZlB9bqDgU8UvS5GmV3Cd2Vp2Vh0x58yqLVBiJ0RWdTst38JBAIyQKthWB5PwUvFKqT~kRgwT-a9GhGAijNK8OFtowniCpvsN54FJPVhgVUZ4ZJX7IWWW1LwiLVtBW6PN7bRtpR3YZ~MygbhbztbwoT2Xy3vY1MYJR3PLx-KXJoULQEDiKbmJ7Vpk9qKDD-xOZ64~8uBo5hlIJTh78XRieYeRQlymHUf~jRDlGdpWZqIYtCdvIhEhVxOUB4gXbohPE5L3W4zERVpJXHeGQ__&Key-Pair-Id=APKAIE5G5CRDK6RD3PGA)
GlcNAc exacerbates the severity of an advanced systemic mastocytosis (AdvSM) phenotype. (A) The proliferation of human MCs, ROSAKIT WT, and ROSAKIT D816V cells, was assessed after treatment with or without 20 mM GlcNAc, and the cells were counted using a Cellometer Auto T4 at days 0, 2, 4, and 8. (B) Schema of in vivo administration of 300 mg/kg GlcNAc to ROSAD816-Gluc transplanted mice after irradiation with 1.5 Gy (n = 10, 5 per group). (C) Measure of GlcNAc activity (in relative luciferase units [RLU]) in PBS- or GlcNAc-treated mice from week 3 (W3) to week 7 (W7). (D) Number of Gluc+ cells circulating in the plasma of mice from W3 to W7, as measured by fluorescence-activated cell sorting (FACS). (E) Number of GFP+ and CFP+ cells in the bone marrow of PBS- or GlcNAc-treated mice, as measured by FACS. (F) Number of GFP+ and CFP+ cells in the spleens of PBS- or GlcNAc-treated mice, as measured by FACS. (G) Weights of spleens at W7 in PBS or GlcNAc-treated mice. (H) Plasmatic concentration of GlcNAc measured by LC-MS/MS in nontransplanted mice, transplanted mice, and GlcNAc-treated transplanted mice. Sampling was done after 7 weeks of treatment, 2 hours after the last injection of GlcNAc. The values in the graphs are presented as the means ± SD (nonsignificant, *P < .05, **P < .01, ***P < .001; 2-tailed, unpaired Student t test).
GlcNAc exacerbates the severity of an advanced systemic mastocytosis (AdvSM) phenotype. (A) The proliferation of human MCs, ROSAKIT WT, and ROSAKIT D816V cells, was assessed after treatment with or without 20 mM GlcNAc, and the cells were counted using a Cellometer Auto T4 at days 0, 2, 4, and 8. (B) Schema of in vivo administration of 300 mg/kg GlcNAc to ROSAD816-Gluc transplanted mice after irradiation with 1.5 Gy (n = 10, 5 per group). (C) Measure of GlcNAc activity (in relative luciferase units [RLU]) in PBS- or GlcNAc-treated mice from week 3 (W3) to week 7 (W7). (D) Number of Gluc+ cells circulating in the plasma of mice from W3 to W7, as measured by fluorescence-activated cell sorting (FACS). (E) Number of GFP+ and CFP+ cells in the bone marrow of PBS- or GlcNAc-treated mice, as measured by FACS. (F) Number of GFP+ and CFP+ cells in the spleens of PBS- or GlcNAc-treated mice, as measured by FACS. (G) Weights of spleens at W7 in PBS or GlcNAc-treated mice. (H) Plasmatic concentration of GlcNAc measured by LC-MS/MS in nontransplanted mice, transplanted mice, and GlcNAc-treated transplanted mice. Sampling was done after 7 weeks of treatment, 2 hours after the last injection of GlcNAc. The values in the graphs are presented as the means ± SD (nonsignificant, *P < .05, **P < .01, ***P < .001; 2-tailed, unpaired Student t test).
ROSAKIT D816V MCs have been reported to engraft in NSG mice, giving rise to an ASM/mast cell leukemia-like disease in vivo. To evaluate the effect of GlcNAc on the severity of disease, we used a humanized in vivo model of KIT D816V ASM using a ROSAKIT D816V-Gluc subclone engineered to naturally secrete Gaussia princeps luciferase (Gluc) as a reporter.40 This model led to an ASM phenotype with neoplastic MCs invading the BM, blood, and different vital organs. ROSAKIT D816V-Gluc cells were derived from ROSAKIT D816V cells expressing the KIT D816V mutant/GFP and transduced with a lentiviral vector expressing Gluc and CFP. Disease progression was then monitored using Gluc activity as a reporter and GFP+ and CFP+ as markers of Gluc-expressing cells. We intravenously injected ROSAKIT D816V-Gluc cells (n = 10) into irradiated NSG mice, and treated half with either GlcNAc (300 mg/kg) or PBS (Figure 3B). Upon measuring the activity of Gluc in the plasma of the GlcNAc-treated and PBS-treated controls, we found significantly higher luciferase activity in the GlcNAc-treated group starting at week 4, and an almost threefold increase by week 7 (Figure 3C). The higher level of Gluc activity was correlated with an increased number of Gluc+ cells (Figure 3D). To further investigate disease progression, BM and spleen samples were analyzed for the presence of GFP+ ROSAKIT D816V-Gluc cells. We observed increased numbers of medullary neoplastic MCs (Figure 3E) without increased invasion of SM clones into the spleen (Figure 3F) in the GlcNAc-treated group compared with the control group (Figure 3G). Additionally, we observed rapid health deterioration in the GlcNAc-treated mice associated with splenomegaly, which prompted us to euthanize all the animals at week 7 rather than week 12. Seven weeks after GlcNAc treatment, we found that the transplantation of mutant MCs induced GlcNAc levels from 1.9 to 3.9 nM, which was not significant (Figure 3H). Thus, MCs per se are not the main source of GlcNAc in this model. The concentration of GlcNAc achieved in the transplanted mice treated with GlcNAc was approximately 7.3 μM, which was in the range of the patient plasma concentrations we measured. Our data show that GlcNAc increased human KIT D816V MC proliferation in vitro and exacerbated the severity of the KIT D816V SM model phenotype in vivo by strongly increasing circulating neoplastic MCs.
GlcNAc increases MC susceptibility to IgE-mediated stimulation
To determine whether GlcNAc increased the susceptibility of neoplastic MCs to IgE and antigen-triggered activation, we studied the effect of GlcNAc on MC degranulation. For this assay, we used murine-derived BMMCs because human MCs in culture express very low levels of the high-affinity IgE receptor, FcεRI.41 WT and D814V KIT BMMC cells (carrying the murine homolog of the human KIT D816V mutation) were differentiated in culture with IL-3 from a total BM of KitD814V/flox-Cre mice. MCs treated with 100 mM GlcNAc showed a significantly increased ability to degranulate, as indicated by the release of β-hexosaminidase into the culture supernatant (Figure 4A) and an increase of Annexin V (Figure 4B). The production of TNF-α, IL-6, and IL-13 (cytokines secreted by MCs at high levels in response to IgE/antigen stimulation) was also increased in GlcNAc-treated KIT D814V BMMCs (Figure 4C-E). Unlike the effect of GlcNAc on MC proliferation, the increase in GlcNAc-induced MC responses was independent of the mutational status of KIT (supplemental Figure 6A). We quantified GlcNAc in KIT D814V MCs derived from mouse BM cultured in IL-3 that showed a significantly increased ability to degranulate at 100 mM GlcNAc. At baseline, intracellular levels of GlcNAc were much lower in mouse BMMCs cultured in IL-3 than in the human ROSA MC line (supplemental Figure 6B). Only 20 μM of intracellular GlcNAc was needed to induce a significant increase of protein glycosylation and degranulation (supplemental Figure 6C-E). The inhibition of the OGA enzyme (O-GlcNAcase) by small interfering RNAs enhanced MCs’ KIT D814V degranulation, confirming the link between the accumulation of O-GlcNAcylated proteins and degranulation (Figure 4F). In vivo, we observed significantly enhanced responses of GlcNAc-treated MCs using a model of anaphylaxis-associated vascular permeability (Figure 4H).
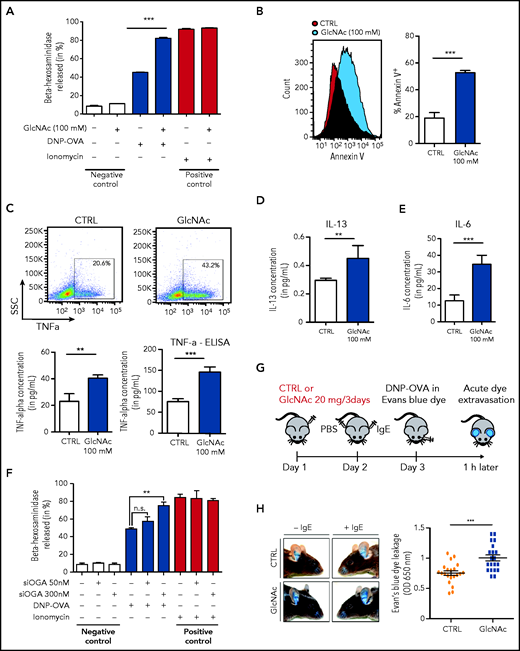
GlcNAc increases MC susceptibility to IgE-mediated stimulation. (A) Degranulation of bone BMMC KITD814V after treatment with or without 100 mM GlcNAc was measured by assessment of β-hexosaminidase release (n = 3). Cells not stimulated with DNP-OVA or ionomycin were considered negative controls, whereas ionomycin stimulation was used as a positive control for MC degranulation ability. (B) Degranulation of MCs was measured by annexin V staining upon stimulation with IgE and antigen complexes for 30 minutes. (C) Intracellular staining (left) or release (right) of TNF-α in MCs stimulated with IgE and antigen incubated with PBS or GlcNAc. The results of 1 representative experiment are shown. SSC, side scatter. (D) Same as panel C for intracellular IL-13. (E) Same as panel C for intracellular IL-6. (F) BMMC KITD814V were transfected with a validated small interfering RNA designed against the OGlcNAcase (OGA) enzyme for 48 hours and degranulation was assessed as described in panel A. (G) Schematic representation of the experimental design for passive cutaneous anaphylaxis. (H) Acute dye extravasation was measured by assessment of the optical density (OD) at 650 nm (n = 20 in each group). The values in the graphs are presented as the means ± SD (nonsignificant, *P < .05, **P < .01, ***P < .001; 2-tailed, unpaired Student t test).
GlcNAc increases MC susceptibility to IgE-mediated stimulation. (A) Degranulation of bone BMMC KITD814V after treatment with or without 100 mM GlcNAc was measured by assessment of β-hexosaminidase release (n = 3). Cells not stimulated with DNP-OVA or ionomycin were considered negative controls, whereas ionomycin stimulation was used as a positive control for MC degranulation ability. (B) Degranulation of MCs was measured by annexin V staining upon stimulation with IgE and antigen complexes for 30 minutes. (C) Intracellular staining (left) or release (right) of TNF-α in MCs stimulated with IgE and antigen incubated with PBS or GlcNAc. The results of 1 representative experiment are shown. SSC, side scatter. (D) Same as panel C for intracellular IL-13. (E) Same as panel C for intracellular IL-6. (F) BMMC KITD814V were transfected with a validated small interfering RNA designed against the OGlcNAcase (OGA) enzyme for 48 hours and degranulation was assessed as described in panel A. (G) Schematic representation of the experimental design for passive cutaneous anaphylaxis. (H) Acute dye extravasation was measured by assessment of the optical density (OD) at 650 nm (n = 20 in each group). The values in the graphs are presented as the means ± SD (nonsignificant, *P < .05, **P < .01, ***P < .001; 2-tailed, unpaired Student t test).
GlcNAc modulates DNA accessibility in KIT D816V+ MCs
Given the contribution of epigenetic deregulation to SM severity18,23 and the ability of GlcNAc to modify transcription factors and epimodifier activities by glycosylation, we performed an ATAC-seq to assess the overall accessibility of genomic regions in KIT D816V MCs to transcription. We mapped open chromatin regions (OCRs) induced by 20 mM GlcNAc 24 hours after treatment to identify the targets of GlcNAc involved in the potential reorganization of MC chromatin. We found 555 regions regulated by GlcNAc in KIT D816V chromatin; 356 were closed and 199 were newly opened (Figure 5A) vs 55 in KIT WT chromatin (50 closed and 5 opened). No overlap was observed between the 555 and 55 regions. Because of the low number of regions modulated by GlcNAc in the context of KIT WT, no significant ontologies could be associated with the genes in these regions (supplemental Table 6). When we compared the opened regions resulting from the mutation (D816V vs WT) and the D816V opened regions resulting from GlcNAc, only 8 were shared (Figure 5B-C). The effect of GlcNAc on chromatin accessibility was likely from the combination of the Kit mutation with GlcNAc and not to the Kit mutation alone. Next, we examined the genomic features of OCRs in KIT D816V chromatin. Compared with the closed regions, the chromatin regions opened by GlcNAc contained fewer promoter sites and more enhancer sites and regions of active transcription (Figure 5C). A Genomic Regions Enrichment of Annotation Tool analysis of the regions showed that in the presence of GlcNAc, genes involved in RTK signaling (MAPK, extracellular signal-regulated kinase cascade), MC activation (FcεRI signaling), and inflammation (cytokine signaling pathways) became more accessible to transcription (Figure 5D; supplemental Table 6). We confirmed the significantly enhanced expression of selected candidate genes in these open regions using reverse transcriptase-quantitative PCR (Figure 5E). The correlation confirmed GlcNAc modulated transcription by chromatin remodeling.
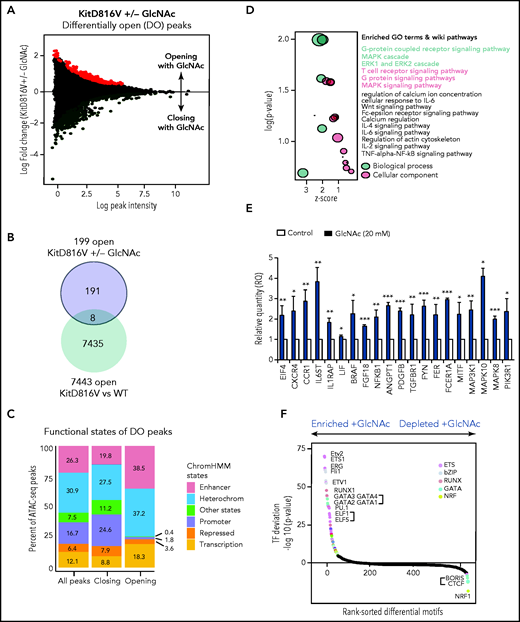
GlcNAc modulates mast cell DNA accessibility in human KIT D816 MCs. (A) Mean-difference plot showing the log-fold change and logCPM (log counts par millions) reads of each peak. Peaks with fold changes significantly greater than 2 (false discovery rate <0.05) are highlighted. Significantly open regions (up peaks = 199) and closed regions (down peaks = 356) are highlighted in red and green, respectively. (B) Venn diagram showing the number of common opened regions in KITD816 vs KIT WT and KITD816V vs KITD816V + GlcNAc. (C) Distributions of ATAC-seq peaks in different regions and the proportion of the genomic regions in each category using functional state annotations from Roadmap cell data sets genomic feature in OCR were shown. (D) Bubble plot of Gene Ontology (GO) terms. The z-scores are shown on the x-axis, and the negative log P values are shown on the y-axis. The bubble area is directly proportional to the number of genes associated with a certain GO term. The MAPK signaling pathway had the largest number of genes and the lowest P value. (E) Altered gene expression by GlcNAc. ROSA KIT D816V cells (n = 3) were either left untreated (control) or treated with 20 mM GlcNAc for 24 hours. Selected candidate genes from Figure 6D were validated by reverse transcriptase-quantitative PCR. Bar graph shows relative quantity (RQ) of transcripts in respect to HPRT transcripts. (F) Rankings of the most differentially enriched motifs between +GlcNAc and −GlcNAc samples. The top motifs were the most enriched motifs and the bottom motifs were the less enriched motifs in the +GlcNAc samples. The values in the graphs are presented as the means ± SD (nonsignificant, *P < .05, **P < .01, ***P < .001; 2-tailed, unpaired Student t test).
GlcNAc modulates mast cell DNA accessibility in human KIT D816 MCs. (A) Mean-difference plot showing the log-fold change and logCPM (log counts par millions) reads of each peak. Peaks with fold changes significantly greater than 2 (false discovery rate <0.05) are highlighted. Significantly open regions (up peaks = 199) and closed regions (down peaks = 356) are highlighted in red and green, respectively. (B) Venn diagram showing the number of common opened regions in KITD816 vs KIT WT and KITD816V vs KITD816V + GlcNAc. (C) Distributions of ATAC-seq peaks in different regions and the proportion of the genomic regions in each category using functional state annotations from Roadmap cell data sets genomic feature in OCR were shown. (D) Bubble plot of Gene Ontology (GO) terms. The z-scores are shown on the x-axis, and the negative log P values are shown on the y-axis. The bubble area is directly proportional to the number of genes associated with a certain GO term. The MAPK signaling pathway had the largest number of genes and the lowest P value. (E) Altered gene expression by GlcNAc. ROSA KIT D816V cells (n = 3) were either left untreated (control) or treated with 20 mM GlcNAc for 24 hours. Selected candidate genes from Figure 6D were validated by reverse transcriptase-quantitative PCR. Bar graph shows relative quantity (RQ) of transcripts in respect to HPRT transcripts. (F) Rankings of the most differentially enriched motifs between +GlcNAc and −GlcNAc samples. The top motifs were the most enriched motifs and the bottom motifs were the less enriched motifs in the +GlcNAc samples. The values in the graphs are presented as the means ± SD (nonsignificant, *P < .05, **P < .01, ***P < .001; 2-tailed, unpaired Student t test).
To predict a genome-wide regulatory network associated with GlcNAc-induced OCRs, we integrated known transcription factor (TF) binding motifs with the DNA accessibility data because binding of TFs to their cognate DNA sequences often leads to nucleosome eviction and the creation of accessible DNA sites (supplemental Table 7).47 Quantitative ranking of the TF motifs showed that ETS, bZIP, RUNX, and GATA were the top family motifs strongly enriched in GlcNAc-induced OCRs (Figure 5F) and are involved in a wide variety of functions associated with cancer.48 We also observed a loss of binding of the TF motif CTCF and associated factor BORIS in GlcNAc-treated chromatin, which supports a role for GlcNAc in opening regions that were insulated. These data indicate that GlcNAc modulates chromatin accessibility in KIT D816V MCs. GlcNAc enhances transcription accessibility of genomic regions coding for building blocks necessary for neoplastic MC hyperproliferation and has little to no effect on KIT WT MC chromatin.
With bioinformatics tools, we created an integrated pathway analysis to understand the intracellular processes targeted by GlcNAc. We profiled the metabolome of ROSAKIT D816V MCs 24 hours after treatment with 20 mM of GlcNAc. The metabolic signature was enriched in pathways associated with purine, pyrimidine metabolism, glycerophospholipids, and amino sugar metabolism (Figure 6A; supplemental Table 8); 4 of the 7 pathways differentially deregulated in the plasma of ASM patients (Figure 1). A combined data analysis showed that GlcNAc affected aminoacyl-transfer RNA biosynthesis (subnetwork 1), but 2 major cellular processes (subnetwork 2) centered on purine and pyrimidine metabolism (Figure 4B-C) that were related to RTK signaling pathways, MAPK cascade, cell proliferation, and signal transduction (Figure 6C).
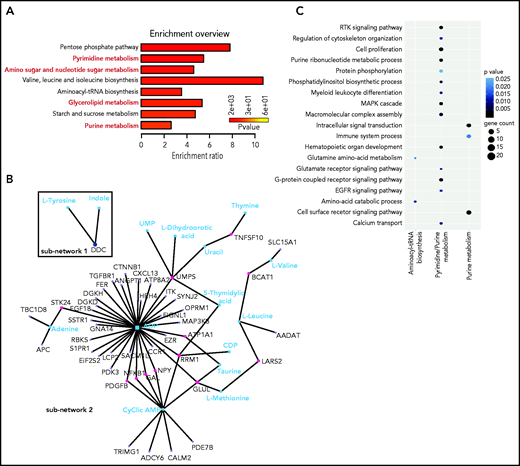
GlcNAc links purine and pyrimidine metabolism to RTK and MAP cascade signaling. (A) Most deregulated metabolic pathways induced by a 24-hour treatment of 20 mM GlcNAc in KIT D816V human MCs. Pathway analysis was performed using MetaboAnalyst 4.0. Each bar represents a pathway, and the color of the bar indicates the P value of the calculated enrichment ratio. (B) Network analysis between the 199 genes in the open region by GlcNAc and the 61 metabolites differentially deregulated par GlcNAc. The 2 subnetworks identified by MetaboAnalyst 4.0 are shown. (C) Integration of the gene pathways and the metabolite pathways deregulated by GlcNAc. Dot color indicates the P value; dot size indicates the number of genes in the pathway.
GlcNAc links purine and pyrimidine metabolism to RTK and MAP cascade signaling. (A) Most deregulated metabolic pathways induced by a 24-hour treatment of 20 mM GlcNAc in KIT D816V human MCs. Pathway analysis was performed using MetaboAnalyst 4.0. Each bar represents a pathway, and the color of the bar indicates the P value of the calculated enrichment ratio. (B) Network analysis between the 199 genes in the open region by GlcNAc and the 61 metabolites differentially deregulated par GlcNAc. The 2 subnetworks identified by MetaboAnalyst 4.0 are shown. (C) Integration of the gene pathways and the metabolite pathways deregulated by GlcNAc. Dot color indicates the P value; dot size indicates the number of genes in the pathway.
Discussion
In this study, we report the designation of GlcNAc as a new oncometabolite that showed pro-oncogenic functions in neoplastic MCs as a result of chromatin remodeling. Although SM is a heterogeneous disease, plasma metabolic profiling was sufficiently sensitive to discriminate among SM forms that differ according to levels of aggressiveness and to potentially stratify MC-related pathologies.
We identified a role for GlcNAc in the control of cellular responses through epigenetic dysregulation. The effect of GlcNAc on neoplastic MC proliferation via chromatin remodeling is likely to be the end-result of numerous direct and indirect effects on gene-expression regulation at multiple levels.49,50 Identifying O-GlcNAcylated targets in the KIT D816V context is necessary to understand this complex phenotype.51,52 Among the possible targets, TET2 is of interest. Inactivating mutations in the hydroxymethylating enzyme, TET2 cooperates with the KIT D816V mutation to transform MCs into a more aggressive phenotype in vivo and in vitro.18,23,53,54 TET2 can also be modified by O-GlcNAcylation. Future studies will determine whether the effect of GlcNAc on chromatin remodeling was through a loss of TET2 function by aberrant O-GlcNAcylation and loss of hydroxymethylated marks in specific area of the genome. This mechanism could explain the ASM phenotype of patients without the TET2 mutation.
The biological activity of GlcNAc is hindered by its inefficient membrane permeability and poor cell entry, is limited by the lack of a cell-surface transporter, and requires high doses to enter cells via macropinocytosis. This process depends on the rate of membrane turnover and the activation of the PI3 kinase pathway by growth factors. In vivo, GlcNAc is quickly metabolized and 30% is excreted in the urine. Given that we could measure GlcNAc concentrations in the μM range suggests a chronic exposure to GlcNAc and/or the existence of focal areas at the sites of inflammation, where GlcNAc levels are highest.
An important question concerns the source of the GlcNAc pool in ASM. Our data showed that the GlcNAc amount was not dependent on the presence of the KIT D816V mutation in vitro or in vivo. Free cellular GlcNAc may be produced by the degradation of dietary or recycled glycoconjugates by glycosidases; however, our data suggested an exogenous origin of GlcNAc, such as the microbiota, because GlcNAc is a component of the bacterial cell-wall peptidoglycan.55 We found that high levels of GlcNAc in patients with ASM were associated with gastrointestinal tract symptoms resulting from intestinal hyperpermeability from the release of MC mediators in the gut, which created gaps in the epithelial lining. Further investigations are required to determine whether bacterial waste products such as GlcNAc directly enter the bloodstream, potentially resulting in a vicious cycle of activating more MCs, which secrete proinflammatory cytokines that further increase inflammation and intestinal permeability. This increase of circulating GlcNAc could exacerbate MC proliferation and degranulation, thus releasing MC intracellular GlcNAc into the microenvironment and making GlcNAc concentration dependent on MC number.
In summary, this study provides insight into the metabolic reprogramming associated with SM severity and neoplastic MC functions. Our results highlight the therapeutic potential of targeting metabolic pathways in MC-related diseases as a means to control MC effector functions.
Acknowledgments
The authors thank the patients and their families for their participation to this study, the Association for Federal Information Resources Management (AFFIRM), and French Reference Center for Mastocytosis (CEREMAST) clinicians for coordinating and collecting patient samples. The authors are grateful to Eric Solary (Gustave Roussy Hospital, Paris, France) and Pascal Chanez (Nord Hospital, Marseille, France) for plasma samples and S. Granjeaud and G. Bidaut from the Integrative Bioinformatics (Cibi) platform at the Centre de Recherche en Cancérologie de Marseille (CRCM), as well as the cytometry platform, animal facilities, and the TrGET platform at the CRCM for technical support. The authors extend special thanks to M. Arock (École Normale Supérieure, Paris, France) for providing the ROSAKIT D816V-Gluc cell line model, and thank S. Létard, Y. Forand, and A. Legrand (CRCM) for technical assistance. CRCM is a member of OPALE Carnot Institute, the Organization for Parternships in Leukemia.
This work was supported by la Ligue Nationale Contre le Cancer (Équipe Labellisée) (P.D ), the ARC Foundation (PJA #20191209490 to F.B.), and research funding from the Canceropôle Provence-Alpes Côtes d'Azur (PACA), Institut National du Cancer and Région Sud (F.B.).
Authorship
Contribution: F.B. and P.D. undertook study conception and supervision; J.A., A.G., R.C., J.A., Q.V.N., G.S., and F.B. provided data generation and analysis; J.A., O.H., and P.D. provided patient samples clinical data; Q.D.C. and P.K. undertook RNA sequencing and metabolomic analysis; R.C., J.M., and P.K. undertook ATAC-seq analysis; C.T. and A.O. generated transcriptomic data from sorted systemic mastocytosis patient mast cells; M.Y. and J.M.A. provided global metabolomics by mass spectrometry on plasma samples; P.D., P.D.S., and A.O. provided expert comments; and F.B. undertook manuscript writing with input from all authors.
Conflict-of-interest disclosure: The authors declare no competing financial interests.
Correspondence: Fabienne Brenet, Centre de Recherche en Cancérologie de Marseille (CRCM), INSERM U1068, UMR7258 CNRS, Aix-Marseille Université, Institut Paoli-Calmettes, Equipe Labellisée Ligue Contre le Cancer, 27 Bd Lei Roure CS30059, Marseille 13273, France; e-mail: fabienne.brenet@inserm.fr.
Data are freely accessible in the Gene Expression Omnibus using the following secure token created to allow review of record GSE149106 while it remains in private status: czylcmqutnwrniv.
The online version of this article contains a data supplement.
The publication costs of this article were defrayed in part by page charge payment. Therefore, and solely to indicate this fact, this article is hereby marked “advertisement” in accordance with 18 USC section 1734.

This feature is available to Subscribers Only
Sign In or Create an Account Close Modal