

Key Points
EZH2 inhibition accelerates MK differentiation.
EZH2 regulates polyploidization and proplatelet formation.

Abstract
EZH2, the enzymatic component of PRC2, has been identified as a key factor in hematopoiesis. EZH2 loss-of-function mutations have been found in myeloproliferative neoplasms, particularly in myelofibrosis, but the precise function of EZH2 in megakaryopoiesis is not fully delineated. Here, we show that EZH2 inhibition by small molecules and short hairpin RNA induces megakaryocyte (MK) commitment by accelerating lineage marker acquisition without change in proliferation. Later in differentiation, EZH2 inhibition blocks proliferation and polyploidization and decreases proplatelet formation. EZH2 inhibitors similarly reduce MK polyploidization and proplatelet formation in vitro and platelet levels in vivo in a JAK2V617F background. In transcriptome profiling, the defect in proplatelet formation was associated with an aberrant actin cytoskeleton regulation pathway, whereas polyploidization was associated with an inhibition of expression of genes involved in DNA replication and repair and an upregulation of cyclin-dependent kinase inhibitors, particularly CDKN1A and CDKN2D. The knockdown of CDKN1A and to a lesser extent CDKN2D could partially rescue the percentage of polyploid MKs. Moreover, H3K27me3 and EZH2 chromatin immunoprecipitation assays revealed that CDKN1A is a direct EZH2 target and CDKN2D expression is not directly regulated by EZH2, suggesting that EZH2 controls MK polyploidization directly through CDKN1A and indirectly through CDKN2D.
Introduction
Enhancer of Zeste 1 and 2 (EZH1 and EZH2) are subunits of polycomb repressive complex 2 (PRC2), which, along with 2 other proteins, extraembryonic ectoderm development (EED) and suppressor of Zeste 12 (SUZ12), constitute the core of PRC2. EZHs are the mutually exclusive catalytic subunits of PRC2 and induce trimethylation on the K27 of histone H3 (H3K27me3), which is a repressive histone mark.1,2 EZH2 plays an important role in normal and malignant hematopoiesis, where frequent mutations are observed.3-5 Loss-of-function mutations in EZH2 are associated with myeloid malignancies, including myelodysplastic syndromes (MDS), BCR-ABL-negative myeloproliferative neoplasms (MPN), and MDS/MPN.3,6 In MPN, EZH2 mutations confer a poor prognosis and are mainly found in primary myelofibrosis (MF) and secondary MF.7 The association of EZH2 mutations with MF suggests that EZH2 plays an important role in regulating megakaryocyte (MK) differentiation. Furthermore, EZH2 mutations are also observed in the progression of Down syndrome transient myeloproliferative disorder to acute megakaryoblastic leukemia.8 The role of EZH2 on normal megakaryopoiesis appears moderate in mice. On one hand, Ezh2 haploinsufficiency in Mpl−/− mice partially corrects the platelet level.9 On the other hand, induction of Ezh2 deletion in adult hematopoiesis leads to a moderate thrombocytosis10,11 or does not change platelet levels,12 even with a specific deletion in the MK lineage.13 However one of the adverse effects of EZH2 inhibitors in clinical trials is thrombocytopenia.14Ezh2 deletion in a Jak2V617F background induces a switch in the observed disorder from polycythemia to essential thrombocythemia progressing rapidly to MF. This effect is associated with a shift in differentiation responsible for an increase in progenitors and mature MKs at the expense of the erythroid lineage.12,13,15
Using 2 catalytic inhibitors and RNA interference on in vitro MK differentiation derived from CD34+ cells, we observed a dual effect of EZH2 inhibition: accelerating MK commitment/differentiation at early stages and inhibiting proliferation, polyploidization, and proplatelet formation at later stages. A similar effect of in vitro EZH2 inhibition on polyploidization of JAK2V617F MKs and proplatelet formation was observed in MPN patients and was confirmed in a Jak2V617F mouse model. This polyploidization defect was related to the inhibition of DNA replication by increased expression of 2 cyclin-dependent kinase inhibitors (CDKi’s): (1) p21Cip1 encoded by CDKN1A, a known target of PRC216; and (2) p19INK4D encoded by CDKN2D, CDKi that physiologically regulates MK polyploidization.17 The defect in proplatelet formation correlated with an abnormal regulation of the F-actin cytoskeleton.
Material and methods
Cell culture
Cord blood, peripheral blood, and leukapheresis samples were obtained after informed consent in agreement with our Institutional Ethics Committee (Assistance Publique–Hôpitaux de Paris) and in accordance with the Declaration of Helsinki. They were processed and separated using immunomagnetic beads following the manufacturer’s protocol (Miltenyi Biotech). Isolated CD34+ cells were cultured in serum-free medium in presence of recombinant human thrombopoietin (TPO; Kirin Brewery, Tokyo, Japan) and stem cell factor (SCF; Biovitrum, Stockolm, Sweden).18 EZH2 inhibition was achieved using GSK126 (MedKoo Biosciences) and GSK343 (Sigma-Aldrich) at 1 µM on day 0 and then every 3 days (see supplemental Material and methods, available on the Blood Web site).
shRNA construction and transduction
Short hairpin RNA (shRNA) sequences targeting EZH2, CDKN1A, CDKN2D,17 and a control sequence (CTL) were cloned into the pRRL-pGK-GFP lentiviral vector (Open Biosystems-Dharmacon) and transduced at day 0 for shEZH2 and at day 5 for shCDKN1A (p21) and shCDKN2D (p19), as previously described.17 shRNA sequences are listed in supplemental Table 1.
Proliferation assay
CD34+ cells were seeded at a concentration of 40 000 to 50 000 cells/mL in triplicate. Cells were counted using a Malassez counting chamber with a trypan blue exclusion (Sigma-Aldrich) at the indicated days.
Flow cytometry and cell sorting analysis
Cell sorting and analysis of ploidy level were performed as previously described.19 Detailed protocols of violet dye (BD Horizon) and flow cytometry experiments are presented in supplemental Material and methods.
RNA extraction, RNA retrotranscription, and qPCR
RNA extraction was performed using RNeasy Micro Kit (Qiagen) for microarrays at day 9 and their validation by quantitative reverse transcription polymerase chain reaction (qRT-PCR). For the transcriptomic analysis at day 13, we used Direct-zol RNA MicroPrep (Zymo Research). RNA retrotranscription was performed using 200 ng total RNA and SuperScript II (Invitrogen). qPCR was performed using PowerUp SYBR Green Master Mix on QuantStudio5 (Applied Biosystems) using the manufacturer’s program for SYBRfast PCR. Primer sequences are listed in supplemental Table 1.
Chromatin immunoprecipitation sequencing (ChIP-seq), ChIP-qPCR, and assay for transposase-accessible chromatin using sequencing analysis
Detailed protocols are presented in supplemental Material and methods. Data and protocol have been submitted to ArrayExpress at the European Bioinformatics Institute with the accession number E-MTAB-8611.
Western blot
Western blot was performed using 12% SDS-PAGE gel. Proteins were lysed in Laemmli buffer with dithiothreitol (100 mM) and proteinase/phosphatase inhibitors. An anti-EZH2 mouse monoclonal antibody (AC22, Cell Signaling Technology), an anti-EZH1 rabbit polyclonal antibody (ab13665, Abcam), or an anti-β-actin mouse monoclonal antibody (clone AC-15, A5441, Sigma-Aldrich) was used.
Microarray analysis
Detailed protocols are described in supplemental Material and methods. Microarrays were performed at days 9 and 13 of culture and were analyzed either using GSEA (gene set enrichment analysis) v5.2 or GO (Gene Ontology) using the PANTHER Classification System. Data and protocols have been submitted to ArrayExpress at the European Bioinformatics Institute with the accession numbers E-MTAB-8610 (day 9 of culture) and E-MTAB-8609 (day 13 of culture).
Bone marrow engraftment and treatment with GSK343
All procedures were approved by the Gustave Roussy Ethics Committee (protocol 2019-087-23444). 2 × 10⁶ total wild-type (WT) or Jak2V617F bone marrow cells were engrafted IV into lethally irradiated recipient mice. Six weeks after transplantation, mice were injected IV every other day with 0.2 mL vehicle or GSK343 (200 μg/kg) until day 20. At day 22, mice were sacrificed and analyzed. For more details, see supplemental Material and methods.
Statistical analysis
The statistical tests used are indicated in each figure legend. Data are represented using mean ± standard error of the mean (SEM). Statistical analyses were performed using Prism GraphPad 6. A value of P < .05 was considered significant.
Results
Expression of EZH1 and EZH2 during MK differentiation
To induce MK differentiation in vitro, cord blood CD34+ cells were cultured in presence of TPO and SCF. In these conditions, cells differentiate in a semisynchronous manner; at day 5, cultures are enriched in MK precursors (CD41−CD42−) and immature MKs (CD41+CD42−) and contain a minority of more mature MKs (CD41+CD42+), whereas at day 12, cultures are enriched in mature MKs (70%) (supplemental Figure 1). At these 2 time points, a significant decrease of EZH1 expression was observed, whereas EZH2 transcripts remained constant at a high level (Figure 1A). The higher expression level of EZH2 compared with EZH1 was confirmed by Western blot (Figure 1B). In contrast to messenger RNA (mRNA) levels, protein levels of both EZH1 and EZH2 were low at day 0 in CD34+ cells and increased at day 5 of culture (Figure 1B). To analyze more homogeneous cell populations, CD34+ cells were cultured for 9 days and sorted as shown in Figure 1C. Microarray analysis showed a decrease in EZH1 and EED transcripts during MK differentiation, whereas EZH2 and SUZ12 expression remained constant, with some variability among experiments (Figure 1C). Interestingly, in agreement with a decrease of EZH2 at protein level at the end of maturation (Figure 1B), the global level of H3K27me3 significantly decreased only in more mature cells (CD41+CD42+) at day 9 of culture (Figure 1D).
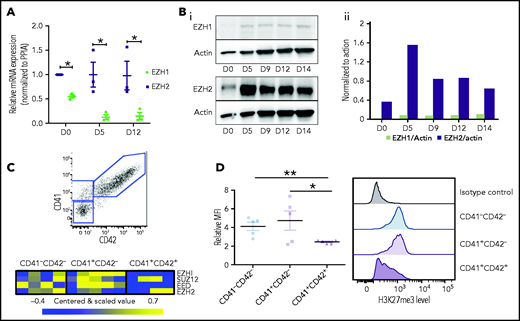
PRC2 expression and H3K27me3 during megakaryopoiesis. (A) Gene expression of EZH1 and EZH2 during MK differentiation (n = 3). Data were compared using a t test with Mann-Whitney correction and are shown as mean ± SEM. *P < .05. (B) Protein expression of EZH1 and EZH2 at different days of MK differentiation (i). Actin was used as loading control. Quantification of EZH1 and EZH2 relative to actin using ImageJ software (ii). (C) Three different cell populations (CD41+CD42+, n = 4; CD41+CD42−, n = 5; and CD41−CD42−, n = 4) were sorted at day 9 of culture (top). Microrarrays were performed on each population. Heatmaps showing gene expression of PRC2 components in each population (n = 4) (bottom). (D) H3K27me3 mean fluorescence intensity relative to immunoglobulin G control for each MK population at day 9 of culture (n = 5) (left). Flow cytometry histograms representative of one experiment (right). Data were compared using a Student t test with Mann-Whitney correction. D, day; MFI , mean fluorescence intensity; PPIA, peptidyl-prolyl cis-trans isomerase. All data represent means ± SEM. *P < .05; **P < .005.
PRC2 expression and H3K27me3 during megakaryopoiesis. (A) Gene expression of EZH1 and EZH2 during MK differentiation (n = 3). Data were compared using a t test with Mann-Whitney correction and are shown as mean ± SEM. *P < .05. (B) Protein expression of EZH1 and EZH2 at different days of MK differentiation (i). Actin was used as loading control. Quantification of EZH1 and EZH2 relative to actin using ImageJ software (ii). (C) Three different cell populations (CD41+CD42+, n = 4; CD41+CD42−, n = 5; and CD41−CD42−, n = 4) were sorted at day 9 of culture (top). Microrarrays were performed on each population. Heatmaps showing gene expression of PRC2 components in each population (n = 4) (bottom). (D) H3K27me3 mean fluorescence intensity relative to immunoglobulin G control for each MK population at day 9 of culture (n = 5) (left). Flow cytometry histograms representative of one experiment (right). Data were compared using a Student t test with Mann-Whitney correction. D, day; MFI , mean fluorescence intensity; PPIA, peptidyl-prolyl cis-trans isomerase. All data represent means ± SEM. *P < .05; **P < .005.
EZH2 inhibition induces an acceleration of MK surface marker acquisition followed by cell-cycle arrest
To study the role of EZH2 during MK differentiation, we used 2 EZH2 catalytic inhibitors, GSK126 and GSK343.20 Both inhibitors profoundly decreased the global level of H3K27me3 in the different MK cell populations (Figure 2A). Using a violet dye cell tracker, we evaluated the expression of CD41 and CD42 according to the number of divisions. No difference in the number of divisions was observed between untreated and treated cells, demonstrating that EZH2 inhibition does not affect proliferation in early MK stages (Figure 2B).
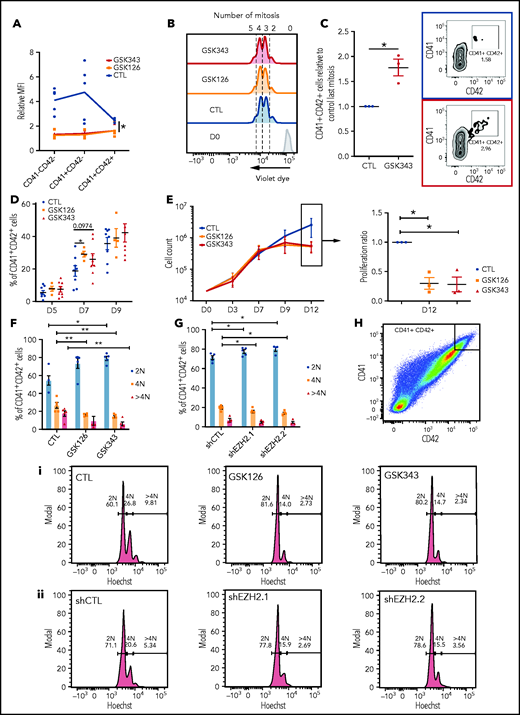
Inhibition of EZH2 accelerates acquisition of the MK surface markers, blocks MK proliferation at later stages, and decreases the mean ploidy of MKs. (A) H3K27me3 mean fluorescence intensity relative to immunoglobulin G control in different MK populations in the presence of GSK343 or GSK126 (n = 5). Data were compared using a Kruskal-Wallis test. (B) Representative flow cytometry plots of a violet dye experiment at day 4 of culture. Blue, dimethyl sulfoxide control (CTL); orange, GSK126; red, GSK343. The number of mitoses is indicated at the top of the figure. (C) Fold increase in the percentage of CD41+CD42+ cells in presence of EZH2 inhibitors. One representative experiment out of 3 experiments of flow cytometry analysis is shown. (D) Percentages of CD41+CD42+ cells at different days of culture. Data were compared using a Student t test with Mann-Whitney correction. CTL, n = 8; GSK126, n = 4; and GSK343, n = 8. (E) Proliferation curve of cord blood cells cultured in presence of TPO, SCF, and GSK343 or GSK126 or dimethyl sulfoxide (CTL) (n = 3) (left). Proliferation of GSK126- and GSK343-treated cells relative to the control at day 12 (right). Data were compared using 1-way analysis of variance with multiple comparison correction. All data represent means ± SEM. *P < .05. Ploidy of MKs treated with inhibitors (n = 5) (F) and transduced by 2 different shRNAs (n = 4) (G). Data were compared using a Student t test with Mann-Whitney correction. (H) Ploidy analyzed in a CD41highCD42high cell population. Flow cytometry of 1 representative experiment for MKs treated with inhibitors (i) and MKs transduced with 2 different shRNAs (ii). All data represent means ± SEM. *P < .05; **P < .005.
Inhibition of EZH2 accelerates acquisition of the MK surface markers, blocks MK proliferation at later stages, and decreases the mean ploidy of MKs. (A) H3K27me3 mean fluorescence intensity relative to immunoglobulin G control in different MK populations in the presence of GSK343 or GSK126 (n = 5). Data were compared using a Kruskal-Wallis test. (B) Representative flow cytometry plots of a violet dye experiment at day 4 of culture. Blue, dimethyl sulfoxide control (CTL); orange, GSK126; red, GSK343. The number of mitoses is indicated at the top of the figure. (C) Fold increase in the percentage of CD41+CD42+ cells in presence of EZH2 inhibitors. One representative experiment out of 3 experiments of flow cytometry analysis is shown. (D) Percentages of CD41+CD42+ cells at different days of culture. Data were compared using a Student t test with Mann-Whitney correction. CTL, n = 8; GSK126, n = 4; and GSK343, n = 8. (E) Proliferation curve of cord blood cells cultured in presence of TPO, SCF, and GSK343 or GSK126 or dimethyl sulfoxide (CTL) (n = 3) (left). Proliferation of GSK126- and GSK343-treated cells relative to the control at day 12 (right). Data were compared using 1-way analysis of variance with multiple comparison correction. All data represent means ± SEM. *P < .05. Ploidy of MKs treated with inhibitors (n = 5) (F) and transduced by 2 different shRNAs (n = 4) (G). Data were compared using a Student t test with Mann-Whitney correction. (H) Ploidy analyzed in a CD41highCD42high cell population. Flow cytometry of 1 representative experiment for MKs treated with inhibitors (i) and MKs transduced with 2 different shRNAs (ii). All data represent means ± SEM. *P < .05; **P < .005.
At 4 divisions, EZH2 inhibition tended to increase the number of CD41+CD42+ cells that still remained a minor cell population (Figure 2C; supplemental Figure 2A). Analysis of CD41+CD42+ cells according to the day of culture showed an increase in their percentages only at day 7, particularly upon GSK126 treatment (Figure 2D). This effect on early differentiation is not specific to the MK lineage, as similar results were observed for the erythroid lineage (supplemental Figure 2B-C). Assay for transposase-accessible chromatin using sequencing analysis was performed on MK differentiated cells sorted according to number of cell divisions. No significant difference in chromatin accessibility of MK genes was observed upon GSK343 treatment, despite the increased percentage of cells with membrane expression of CD41 and CD42 (supplemental Figure 3A-D).
At day 9 of culture, treated cells stopped proliferating (Figure 2E). Cell-cycle status of CD41+CD42+ cells was investigated at different days of culture by Hoechst labeling. A slight G1 increase was observed at days 9 and 13, with a decrease in S phase without any effect on apoptosis (data not shown). Although in control cultures of cord blood CD34+ cells, very few MKs acquire a ploidy over 4N at day 12 of culture, we observed a decreased mean ploidy with both EZH2 inhibitors or the 2 specific EZH2 shRNAs (Figure 2F-G; supplemental Figure 4A-B). Analysis of ploidy level in MKs expressing the highest level of CD41 and CD42 revealed that both EZH2 inhibitors (Figure 2Hi) and shRNAs (Figure 2Hii) induced a significant decrease of the 4N peak and a nearly complete disappearance of the 8N peak.
EZH2 inhibition impairs DNA replication through induction of CDKi’s
To understand why EZH2 inhibition blocks MK proliferation and reduces polyploidization, microarray analysis was performed at day 9 of culture on 3 sorted cell populations (CD41−CD42−, CD41+CD42−, and CD41+CD42+) after sustained GSK343 or shEZH2 treatment. Principal-component analysis (Figure 3A) and supervised clustering (Figure 3B) showed that the main differences were related to CD41 and CD42 expression rather than the type of treatment. The CD41+CD42+ population showed the greatest extent of differentially expressed genes upon treatment, with 167 upregulated and 196 downregulated genes (P < .001; supplemental Table 2; Figure 3C). GO of upregulated genes revealed MHC-1 antigen processing and peptide presentation signatures, as recently reported.21 (supplemental Table 2 and supplemental Figure 5) In contrast, GO analysis of downregulated genes revealed a signature related to DNA replication and cell cycle regulation (Figure 3D). The most downregulated genes were involved in DNA replication and included CDT1, CLSPN as well as genes encoding the MCM complex (Figure 3E). GSEA further showed the downregulation of ATM, DNA replication, and Fanconi pathways upon EZH2 inhibition (Figure 3F). It is noteworthy that all of these genes were downregulated by EZH2 inhibition, suggesting an indirect mechanism of regulation.
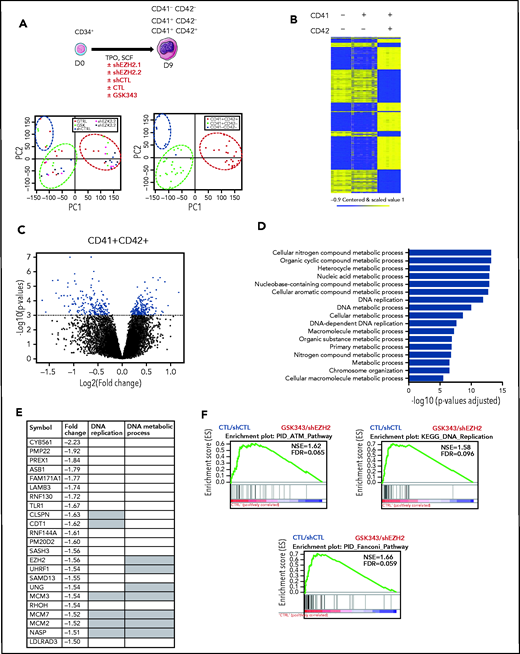
EZH2 inhibition alters cell-cycle regulation in mature MKs. (A) Schematic diagram representing microarray analysis performed at day 9 of culture in presence of 2 different shEZH2 and GSK343 inhibitor (i). Principal-component (PC) analysis of microarrays performed at day 9 of culture (ii). Circles indicate the different cell populations; CD41+CD42+ cells are grouped in the red circle, CD41+CD42− cells are grouped in the green circle; and CD41−CD42− cells are grouped in the blue circle. (B) Heatmap showing genes up- or downregulated during MK differentiation. CD41−CD42−, CD41−CD42+, and CD41+CD42+ cell populations are shown. Missing values are in gray. (C) Volcano plot showing differentially expressed genes in the CD41+CD42+ cell population in CTL vs treated cells. (D) GO terms (biological process) differentially expressed in control cells (untreated and treated with a shCTL vs GSK343 and shEZH2, respectively). Corrected P values were calculated using a modified Fisher’s exact test followed by Bonferroni’s multiple comparison test. (E) List of the most downregulated genes (fold change 1.5) in presence of EZH2 inhibition (GSK343 or shRNA). Gray squares indicate genes that belong to DNA replication pathway or DNA metabolic process according to MSigDB (Broad Institute). (F) GSEA of the CD41+CD42+ cells in presence of GSK343 and 2 shEZH2. FDR, false discovery rate; NES, normalized enrichment score.
EZH2 inhibition alters cell-cycle regulation in mature MKs. (A) Schematic diagram representing microarray analysis performed at day 9 of culture in presence of 2 different shEZH2 and GSK343 inhibitor (i). Principal-component (PC) analysis of microarrays performed at day 9 of culture (ii). Circles indicate the different cell populations; CD41+CD42+ cells are grouped in the red circle, CD41+CD42− cells are grouped in the green circle; and CD41−CD42− cells are grouped in the blue circle. (B) Heatmap showing genes up- or downregulated during MK differentiation. CD41−CD42−, CD41−CD42+, and CD41+CD42+ cell populations are shown. Missing values are in gray. (C) Volcano plot showing differentially expressed genes in the CD41+CD42+ cell population in CTL vs treated cells. (D) GO terms (biological process) differentially expressed in control cells (untreated and treated with a shCTL vs GSK343 and shEZH2, respectively). Corrected P values were calculated using a modified Fisher’s exact test followed by Bonferroni’s multiple comparison test. (E) List of the most downregulated genes (fold change 1.5) in presence of EZH2 inhibition (GSK343 or shRNA). Gray squares indicate genes that belong to DNA replication pathway or DNA metabolic process according to MSigDB (Broad Institute). (F) GSEA of the CD41+CD42+ cells in presence of GSK343 and 2 shEZH2. FDR, false discovery rate; NES, normalized enrichment score.
We observed that EZH2 inhibition led to the upregulation of some CDKi genes in CD41+CD42+ cells (Figure 4A), as previously reported for B cells.16 qRT-PCR confirmed the upregulation of CDKN1A and CDKN2D in CD41+CD42+ cells at day 9 of culture (Figure 4B).
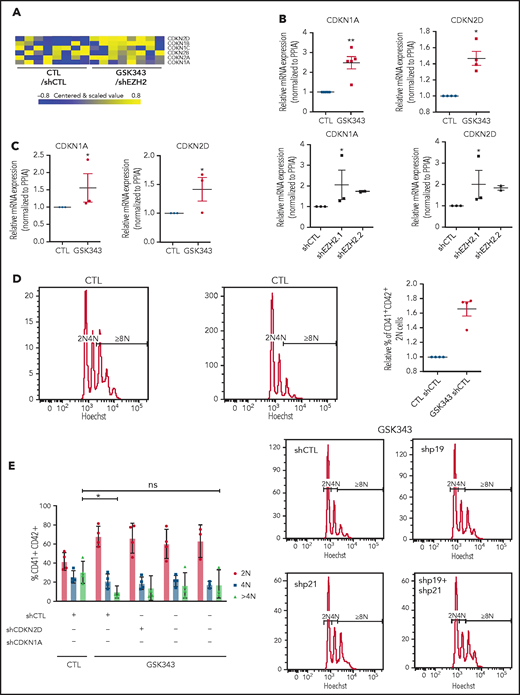
Inhibition of EZH2 alters MK polyploidization though CDKi regulation. (A) Heatmap showing differentially expressed CDKi’s in mature MKs (CD41+CD42+). (B) mRNA expression of CDKN2D (p19) and CDKN1A (p21) in cord blood–derived CD41+CD42+ cells in the presence of GSK343 (n = 5) and shEZH2 (n = 3 for shEZH2.1 and n = 2 for shEZH2.2). Data were compared using a Student t test with Mann-Whitney correction. (C) mRNA expression of CDKN2D (p19) and CDKN1A (p21) in leukapheresis-derived CD41+CD42+ cells in the presence of GSK343 (n = 3) at day 9 of culture. Data were compared using a Student t test with Mann-Whitney correction. (D-E) Ploidy analysis in CD41+CD42+ cells derived from leukapheresis CD34+ cells in the presence of GSK343 (n = 4) (D) and shCDKN1A, shCDKN2D, and shCDKN1A+shCDKN2D (n = 4) (E). Data were compared using a Student t test with Mann-Whitney correction. All data represent means ± SEM. *P < .05; **P < .005; ns, not significant.
Inhibition of EZH2 alters MK polyploidization though CDKi regulation. (A) Heatmap showing differentially expressed CDKi’s in mature MKs (CD41+CD42+). (B) mRNA expression of CDKN2D (p19) and CDKN1A (p21) in cord blood–derived CD41+CD42+ cells in the presence of GSK343 (n = 5) and shEZH2 (n = 3 for shEZH2.1 and n = 2 for shEZH2.2). Data were compared using a Student t test with Mann-Whitney correction. (C) mRNA expression of CDKN2D (p19) and CDKN1A (p21) in leukapheresis-derived CD41+CD42+ cells in the presence of GSK343 (n = 3) at day 9 of culture. Data were compared using a Student t test with Mann-Whitney correction. (D-E) Ploidy analysis in CD41+CD42+ cells derived from leukapheresis CD34+ cells in the presence of GSK343 (n = 4) (D) and shCDKN1A, shCDKN2D, and shCDKN1A+shCDKN2D (n = 4) (E). Data were compared using a Student t test with Mann-Whitney correction. All data represent means ± SEM. *P < .05; **P < .005; ns, not significant.
To study if CDKi knockdown could rescue the polyploidization defect induced by EZH2 inhibition, we employed an RNA interference strategy. Since MK derived from cord blood CD34+ cells do not reach high ploidy level, we used CD34+ cells isolated from adult leukapheresis samples. We first confirmed that also in adult leukapheresis EZH2 inhibition led to the overexpression of CDKi’s (Figure 4C) and a decrease in polyploidization (Figure 4D). We then evaluated the ploidy level in presence of shCDKN1A, shCDKN2D (supplemental Figure 4C), or both upon GSK343 treatment. The highest effect on the >4N population was observed with shCDKN1A, although the decrease in polyploidization induced by EZH2 inhibition was not completely rescued in any condition (Figure 4E).
These results suggest that EZH2 controls MK differentiation through cell-cycle regulation by controlling CDKi expression.
EZH2 inhibition derepresses p21 during MK differentiation
We then investigated the molecular mechanisms underlying EZH2 regulation of MK proliferation and polyploidization. We performed a global analysis including H3K27me3, H3K4me3, and H3K27ac (the latter 2 are associated with promoter and enhancer regions, respectively). We analyzed cells isolated at day 0 (CD34+ cells), day 3 (total population containing mainly CD34+ cells), and day 12 (total population containing mainly CD41+CD42+ cells) upon sustained GSK343 treatment. As expected, the majority of the H3K4me3 was detected on promoter regions (≤1 kb), while H3K27me3 was more distributed on distal intergenic regions. When compared during differentiation, we observed a redistribution of the H3K4me3 on promoters at days 3 and 12, while H3K27me3 and H3K27ac maintained the same distribution across the genome at all time points (Figure 5A). Global chromatin analysis on CD41+CD42+ MKs showed a similar distribution around the transcriptional start site between untreated and treated cells (supplemental Figures 6 and 7). Visual inspection using the Integrative Genomics Viewer showed that at day 12, CDKN1A presented a lower level of H3K27me3 and a concomitant increase in H3K27ac (Figure 5B) upon GSK343 treatment. In contrast, at day 12, H3K27me3 was undetectable on CDKN2D in both control and treated samples (Figure 5C). ChIP-EZH2 qPCR confirmed that EZH2 controls directly the expression of CDKN1A and indirectly that of CDKN2D in CD41+CD42+ MKs (Figure 5B-C).
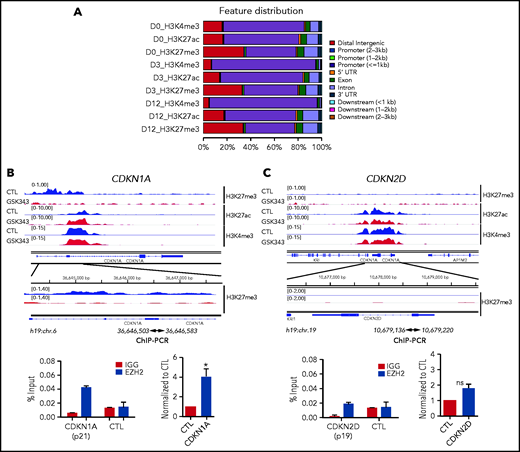
ChIP-seq analyses in the presence of EZH2 inhibition during MK differentiation. (A) Peak distribution along the gene regions as indicated on the right side. (B) ChIP-seq profiles of the 3 histone marks (H3K4me3, H3K27me3, and H3K27ac) across CDKN1A (p21) (blue, control; red, GSK343 treated at day 12 of culture) are shown in the upper panel and ChIP-EZH2 qPCR in the lower panel. (C) ChIP-seq profiles of the 3 histone marks (H3K4me3, H3K27me3, and H3K27ac) across CDKN2D (p19) (blue, control; red, treated with GSK343 at day 12 of culture) are shown in the upper panel and ChIP-EZH2 qPCR in the lower panel. (B-C) In the lower panel, 1 representative ChIP experiment of 3 experiments is shown in duplicate on the left, and the statistical analysis of 3 independent ChIP experiments is shown on the right. Data were compared using a Student t test with Mann-Whitney correction. All data represent means ± SEM. *P < .05.
ChIP-seq analyses in the presence of EZH2 inhibition during MK differentiation. (A) Peak distribution along the gene regions as indicated on the right side. (B) ChIP-seq profiles of the 3 histone marks (H3K4me3, H3K27me3, and H3K27ac) across CDKN1A (p21) (blue, control; red, GSK343 treated at day 12 of culture) are shown in the upper panel and ChIP-EZH2 qPCR in the lower panel. (C) ChIP-seq profiles of the 3 histone marks (H3K4me3, H3K27me3, and H3K27ac) across CDKN2D (p19) (blue, control; red, treated with GSK343 at day 12 of culture) are shown in the upper panel and ChIP-EZH2 qPCR in the lower panel. (B-C) In the lower panel, 1 representative ChIP experiment of 3 experiments is shown in duplicate on the left, and the statistical analysis of 3 independent ChIP experiments is shown on the right. Data were compared using a Student t test with Mann-Whitney correction. All data represent means ± SEM. *P < .05.
EZH2 inhibition affects proplatelet formation
Analysis of the more mature MKs revealed a threefold decrease in the percentage of MK forming proplatelets in presence of GSK343 or shEZH2.2 at day 13 of culture (Figure 6A). Thus, we performed a microarray analysis on CD41+CD42+ sorted cells at day 13 upon continuous treatment of GSK126 or GSK343. The combined analysis of GSK126- and GSK343-treated cells (P < .001) showed 241 upregulated and 15 downregulated genes (supplemental Table 3; Figure 6B). Analysis including only genes with fold change >2 resulted in 59 upregulated genes (supplemental Table 4) involved in cytoskeleton regulation, as shown by GO analysis (Figure 6C; supplemental Table 5). qRT-PCR on CD41+CD42+ cells treated with the 2 inhibitors confirmed the microarray data (supplemental Figure 8). A total of 34 out of the 59 most upregulated genes, exhibited a decreased H3K27me3 mark upon GSK343 treatment in CD41+CD42+ cells, as shown for FSCN1 in Figure 6D and ENAH in supplemental Figure 9A. Among the 59 most upregulated genes, 50% have already been described as an EZH2 target in murine LSK cells,22 and 30% were reported to be regulated by H3K4me2 and H3K27me3 in the brain.23 A direct regulation by EZH2 was confirmed by ChIP-EZH2 qPCR for FSCN1 and ENAH (Figure 6D; supplemental Figure 9A), but not for FGD5 (supplemental Figure 9B), suggesting an indirect mechanism of regulation as for CDKN2D. Finally, confocal microscopy analysis on MKs after sustained EZH2 inhibition showed a large fraction of spread MKs forming filopodia and stress fibers, with some of them harboring podosomes (Figure 6E). This deregulation of actin cytoskeleton may explain the observed defect in proplatelet formation.
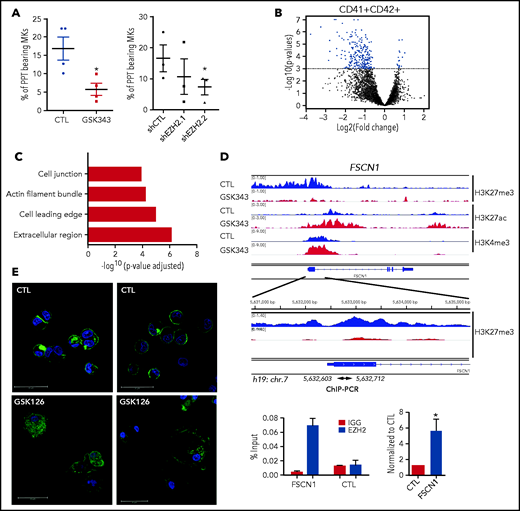
EZH2 inhibition alters proplatelet formation. (A) Proplatelet formation analysis in cells treated with GSK343 or shEZH2 on day 13 of culture. Means of 3 independent experiments are shown. Data were compared using a t test with Mann-Whitney correction. PPT, proplatelet. All data are shown as mean ± SEM. *P < .05. (B-C) Transcriptome analysis performed on CD41+CD42+ MKs cultured either in the presence GSK inhibitors (GSK126 or GSK343) or in their absence (CTL) and sorted on day 13 of culture. (B) Volcano plot showing differentially expressed genes in the CD41+CD42+ cell population in CTL vs treated cells (P < .001). (C) GO analysis of cellular component on the 59 genes common to both inhibitors. Corrected P values were calculated using a modified Fisher’s exact test (P < .001, fold change >2). (D) ChIP-seq profiles of the 3 histone marks (H3K4me3, H3K27me3, and H3K27ac) across FSCN1 on day 12 of MK culture (blue, control; red, GSK343 treated) are shown in the upper panel and ChIP-EZH2 qPCR in the lower panel. One representative ChIP-qPCR experiment of 3 experiments is shown in duplicate on the left, and the statistical analysis of 3 independent ChIP experiments is shown on the right. Data were compared using a Student t test with Mann-Whitney correction. All data represent means ± SEM. *P < .05. (E) Immunofluorescence staining of F-actin (green) and nucleus (blue) in control (CTL) and GSK126-treated MKs on day 13 of culture after adhesion on poly-L-lysine. Scale bars, 30 μm.
EZH2 inhibition alters proplatelet formation. (A) Proplatelet formation analysis in cells treated with GSK343 or shEZH2 on day 13 of culture. Means of 3 independent experiments are shown. Data were compared using a t test with Mann-Whitney correction. PPT, proplatelet. All data are shown as mean ± SEM. *P < .05. (B-C) Transcriptome analysis performed on CD41+CD42+ MKs cultured either in the presence GSK inhibitors (GSK126 or GSK343) or in their absence (CTL) and sorted on day 13 of culture. (B) Volcano plot showing differentially expressed genes in the CD41+CD42+ cell population in CTL vs treated cells (P < .001). (C) GO analysis of cellular component on the 59 genes common to both inhibitors. Corrected P values were calculated using a modified Fisher’s exact test (P < .001, fold change >2). (D) ChIP-seq profiles of the 3 histone marks (H3K4me3, H3K27me3, and H3K27ac) across FSCN1 on day 12 of MK culture (blue, control; red, GSK343 treated) are shown in the upper panel and ChIP-EZH2 qPCR in the lower panel. One representative ChIP-qPCR experiment of 3 experiments is shown in duplicate on the left, and the statistical analysis of 3 independent ChIP experiments is shown on the right. Data were compared using a Student t test with Mann-Whitney correction. All data represent means ± SEM. *P < .05. (E) Immunofluorescence staining of F-actin (green) and nucleus (blue) in control (CTL) and GSK126-treated MKs on day 13 of culture after adhesion on poly-L-lysine. Scale bars, 30 μm.
EZH2 also controls MK polyploidization by regulating CDKi expression in JAK2 V617F MPN
Knowing that in MPN EZH2 mutations are associated with abnormalities in MK differentiation, we investigated the effects of EZH2 inhibition on samples from 7 JAK2V617F patients and one JAK2 exon 12 mutated patient. None of these patients carried an EZH2 or a PRC2 component mutation as shown by next-generation sequencing (supplemental Table 4). We confirmed the significant decrease in polyploid MKs upon EZH2 inhibition (Figure 7A). A similar and even more striking result was observed in 1 patient selected for very high JAK2 V617F variant allele frequency when cultures were started from MK committed progenitors (CD34+CD41+ cells) (Figure 7B; supplemental Table 6). Also in a JAK2V617F background, gene expression analysis by qRT-PCR on MKs at day 9, showed a downregulation of genes involved in DNA replication and repair (MCM5, XRCC2, and PCNA) and an upregulation of CDKN1A (Figure 7C).
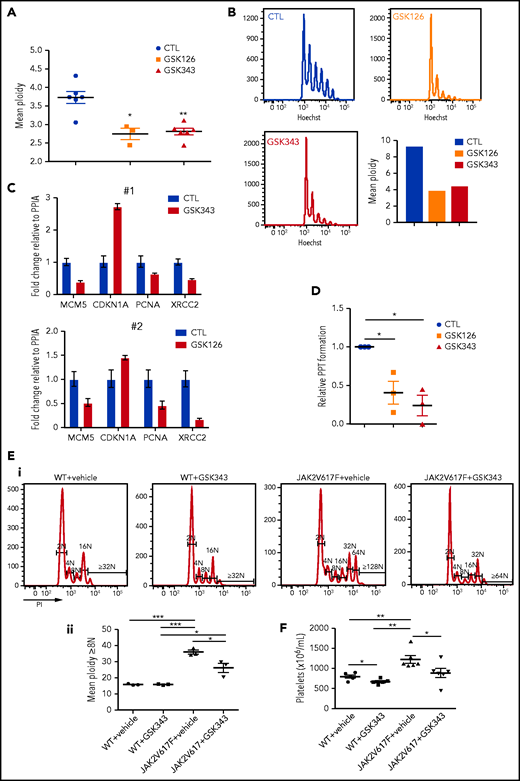
EZH2 inhibition alters differentiation of JAK2V617F MKs. (A-D) Effects of EZH2 inhibition on MK differentiation from JAK2 V617F CD34+ cells. (A) Decrease on day 9 of culture in the mean ploidy of JAK2 V617F MKs derived from patient CD34+ cells treated with 2 EZH2 inhibitors. Data were compared using a t test with Mann-Whitney correction. GSK126, n = 3; GSK343, n = 6. (B) Decrease on day 5 of culture of the mean ploidy of JAK2 V617F MKs derived from CD34+CD41+ cells from 1 patient with a JAK2 V617F variant allele frequency of ∼100%. (C) Gene expression analysis of CD41+CD42+ patient cells on day 10 of culture. Two patients were studied (#1, #2). Error bars represent duplicates of one experiment. (D) Proplatelet (PPT) formation analysis in cells treated with GSK343 or GSK126 inhibitors relative to nontreated samples (n = 3). Data were compared using a t test with Mann-Whitney correction. All data represent means ± SEM. *P < .05; **P < .01. (E-F) Effects of EZH2 inhibition on MK differentiation in vivo in the Jak2V617F context. (E) Representative histograms of ploidy level in mice engrafted with WT or Jak2V617 total bone marrow cells and treated with vehicle or GSK343 (i). Mean ploidy level ≥8N was calculated based on the percentage of MKs (ii). (F) Platelet count. (E-F) Data were compared using an unpaired Student t test. All data represent means ± SEM. ***P < .001; **P < .01; *P < .05.
EZH2 inhibition alters differentiation of JAK2V617F MKs. (A-D) Effects of EZH2 inhibition on MK differentiation from JAK2 V617F CD34+ cells. (A) Decrease on day 9 of culture in the mean ploidy of JAK2 V617F MKs derived from patient CD34+ cells treated with 2 EZH2 inhibitors. Data were compared using a t test with Mann-Whitney correction. GSK126, n = 3; GSK343, n = 6. (B) Decrease on day 5 of culture of the mean ploidy of JAK2 V617F MKs derived from CD34+CD41+ cells from 1 patient with a JAK2 V617F variant allele frequency of ∼100%. (C) Gene expression analysis of CD41+CD42+ patient cells on day 10 of culture. Two patients were studied (#1, #2). Error bars represent duplicates of one experiment. (D) Proplatelet (PPT) formation analysis in cells treated with GSK343 or GSK126 inhibitors relative to nontreated samples (n = 3). Data were compared using a t test with Mann-Whitney correction. All data represent means ± SEM. *P < .05; **P < .01. (E-F) Effects of EZH2 inhibition on MK differentiation in vivo in the Jak2V617F context. (E) Representative histograms of ploidy level in mice engrafted with WT or Jak2V617 total bone marrow cells and treated with vehicle or GSK343 (i). Mean ploidy level ≥8N was calculated based on the percentage of MKs (ii). (F) Platelet count. (E-F) Data were compared using an unpaired Student t test. All data represent means ± SEM. ***P < .001; **P < .01; *P < .05.
Moreover, as observed in cord blood samples (Figure 4F), EZH2 inhibition also led to a decrease in proplatelet formation in a JAK2V617F background (Figure 7D).
To confirm these results in vivo, mice engrafted either with WT or Jak2V617F total bone marrow cells were treated with GSK343 and analyzed at day 18 after the first injection. As shown in Figure 7E, GSK343 did not cause changes in the ploidy level of WT cells, while it led to a significant decrease in polyploid MKs in Jak2V617F engrafted mice (from 35.9N for vehicle-treated mice to 26.2N for GSK343-treated mice). Moreover, platelet count at the end of GSK343 treatment (day 22) showed a significant (1.38-fold) decrease in Jak2V617F engrafted mice and a slight but significant effect in WT engrafted mice (Figure 7F). The percentage and total bone marrow MK number (supplemental Figure 10), as well as the other blood parameters (supplemental Figure 11), were not affected by GSK343 treatment in WT or Jak2V617F engrafted mice.
Altogether, these results suggest that EZH2 inhibition impairs MK differentiation more importantly in a JAK2V617F mutated context than in a WT context.
Discussion
This study demonstrates that EZH2 inhibition has 2 main effects on MK differentiation in vitro: in the early stages, it accelerates MK differentiation from cord blood CD34+ cells, and in the late stages, it inhibits the cell cycle and proplatelet formation.
The PRC2 complex is one of the main regulators of hematopoietic stem cell (HSC) properties as well as their fate.1,2Ezh2 knockout at the embryonic stage induces a profound defect in HSC self-renewal and expansion.11 In contrast, it has no effect or a mild effect on adult HSCs due to redundancy with EZH1.24
Here, we show that during MK differentiation , the EZH2 level is much higher than the EZH1 level but slightly decreases at the end of maturation, resulting in a decline in H3K27me3 levels in mature MKs, together with a decrease in EED. Such decline is also observed in presence of EZH2 catalytic inhibitors or shRNAs that induce important effects on MK differentiation when cord blood CD34+ cells are grown in saturating level of SCF and TPO, mimicking in some way stress conditions. Stronger effects were observed using EZH2 inhibitors than shRNAs, probably due to a higher inhibition of EZH2 trimethylase activity compared with shRNAs, which rather mimic a haploinsufficiency. These similar results suggest that most of the effects of EZH2 on megakaryopoiesis implicate the canonical PRC2 pathway.
At the early stages, EZH2 inhibition facilitates the induction of MK differentiation without modifying the proliferation induced by SCF plus TPO, as shown by the increase CD41 and CD42 expression at 4 divisions. These results are in agreement with data showing that lineage-specific transcription factors, induced by several cytokines (granulocyte colony-stimulating factor, macrophage colony-stimulating factor, and erythropoietin [EPO]), require for binding their target genes an H3K27-unmodified nascent chromatin, a consequence of DNA replication and H3K27 demethylation (UTX1).25,26 Thus, while treatment with UTX1 inhibitors delays differentiation induced by cytokines,26 EZH2 inhibition may have the inverse effect: by decreasing the level of H3K27me3, it facilitates the binding of lineage-restricted genes by transcription factors. Our data show that the acceleration of MK differentiation is not related to a significant increase in the chromatin accessibility of MK genes and may only facilitate transcription. This effect of EZH2 inhibition is not specific to the MK lineage, as a faster acquisition of erythroid surface markers is observed in the presence of EPO only. Similarly, in case of loss-of-function mutations, it may essentially depend on the cell type that has been targeted by the mutation. For example, Ezh2 knockout increases the expression of genes present in normal early T-cell progenitors and cooperates with an NRAS oncogenic mutation to induce a model of early T-cell precursor acute lymphoblastic leukemia.27 How can it be explained that in JAK2V617F MPNs, EZH2 mutations or Ezh2 knockout in mouse models induces a shift from erythroid to MK differentiation, whereas in vitro, it does not favor a specific lineage?12,13,15 It can be hypothesized that JAK2V617F MPN derives from the transformation of an HSC in which the TPO/MPL pathway plays a much more important role than EPO or granulocyte colony-stimulating factor receptors.28 Therefore, the constitutive activation of MPL by JAK2V617F in HSCs may favor MK commitment and induction of MK differentiation after EZH2 loss and therefore a disease shift from a polycythemia vera to an essential thrombocythemia/primary MF.
At later stages of MK differentiation, we observe a premature arrest in proliferation and a defect in MK polyploidization. This last one is only moderate in cultures from cord blood samples displaying a low ploidy level even without treatement29 but more marked in MKs derived from adult CD34+ cells and JAK2V617F samples. Accordingly, Jak2V617F mice treated with GSK343 for 3 weeks show decreased MK ploidy with no significant effect on MK numbers and restore a normal platelet count. In contrast, the effect of EZH2 inhibition is extremely moderate on the MK/platelet lineage in control mice. These results suggest that EZH2 plays a more important role in a stress than in steady-state megakaryopoiesis.
Transcriptomic analysis of CD41+CD42+ MKs at day 9 of culture revealed a significant downregulation of the 6 MCM genes and genes encoding Fanconi and DNA repair pathways. These 2 last pathways are cell-cycle dependent and could be the consequence of a cell-cycle arrest in G1.
Previous work showed that CDKN2A (p16ink4a and p14/p19arf) is a direct target of the canonical PRC2.30 In B cells, CDKN1A (p21Cip1) is also a direct target of EZH2, and its repression plays a central role in the proliferation of germinal center B cells.16 In MKs, the 2 most expressed CDKi’s are CDKN2D and CDKN1A. CDKN2D is involved in the regulation of MK polyploidization;17 the modal ploidy of MKs in Cdkn2d knockout mice is 64N,17 whereas Cdkn1a knockout does not alter ploidy.31 Our transcriptomic data reveal an overexpression of both CDKi’s in CD41+CD42+ after EZH2 inhibition. The increase in CDKN1A may explain the repression of the Fanconi and DNA repair pathways through the DREAM complex.32 The knockdown of CDKN1A and CDKN2D can partially rescue the percentage of MKs >4N, suggesting that EZH2 regulates MK proliferation and polyploidization via these 2 CDKi’s. ChIP-seq analysis and ChIP-EZH2 show that only CDKN1A expression is a direct target of PRC2, while CDKN2D is indirectly regulated.
In addition, EZH2 inhibition also affects pathways involved in actin cytoskeleton reorganization that play a central role in regulation of proplatelet formation. This defect may explain the abnormal proplatelet formation observed in vitro, including for JAK2V617F MKs and in vivo in the Jak2V617F context. Altogether, our results further reinforce the hypothesis that the MK phenotype of Ezh2 KO Jak2V617F mice is essentially related to a MK-biased hematopoiesis and that the development of MF may be favored by the alterations observed in late MK differentiation.
In summary, EZH2 plays an important role in controlling the effect of TPO on MK commitment, and at late stages of differentiation, it permits a normal polyploidization by regulating CDKN1A and CDKN2D. Loss-of-function EZH2 mutations observed in MPNs may partly explain certain MK maturation defects observed in MF, such as the defect in polyploidization and platelet production.
Acknowledgments
The authors thank C. Catelain and Y. Lecluse from the Imaging and Cytometry Platform (PFIC), UMS AMMICA (Gustave Roussy, Villejuif, France) for the expertise in cytometry, as well as the Gustave Roussy genomic platform for performing the microarrays. The authors are grateful to P. de la Grange and A. Jolly (Genosplice, Paris, France) for performing the ChIP-seq analysis and D. Muller and N. Balayn for technical help (INSERM 1287, Gustave Roussy, Villejuif, France).
This work was supported by grants from Ligue Nationale Contre le Cancer (Equipe labellisée 2016 and 2019; H.R.), Institut National du Cancer (PLBIO-2015; W.V.), and Gustave Roussy (Taxe d’Apprentissage; S.M.). S.M. was supported by PhD fellowships from the University Paris-Diderot and la Société Française d’Hématologie.
Authorship
Contribution: W.V., H.R., N.D., and I.P. conceived and designed the study, interpreted the data, and wrote the paper; S.M. designed and performed experiments, analyzed the data, prepared the figures, and wrote the paper; M.V., V.D., M.C., B.A., M.E.K., S.B., I.A.-D., F.B.-V., V.E., and M.W. designed and performed experiments and analyzed the data; P.D. performed the bioinformatics analysis; P.R. performed the flow cytometry analysis; B.C. provided patient samples and discussed results; and R.P. discussed results and contributed to manuscript editing.
Conflict-of-interest disclosure: The authors declare no competing financial interests.
Correspondence: William Vainchenker, INSERM UMR 1287, Gustave Roussy, Université Paris-Saclay, 114 rue Edouard Vaillant, 94805 Villejuif, France; e-mail: william.vainchenker@gustaveroussy.fr.
ChIP-seq data: E-MTAB-8611, transcriptome: E-MTAB-8610 for day 9 and E-MTAB-8609 for day 13 of culture.
The online version of this article contains a data supplement.

This feature is available to Subscribers Only
Sign In or Create an Account Close Modal