

Key Points
HDAC11, the sole class IV HDAC, not HDAC6, is a therapeutic vulnerability for MPNs.
Hdac11 plays a key role in oncogene-induced, but not homeostatic, hematopoiesis.

Abstract
Protein acetylation is an important contributor to cancer initiation. Histone deacetylase 6 (HDAC6) controls JAK2 translation and protein stability and has been implicated in JAK2-driven diseases best exemplified by myeloproliferative neoplasms (MPNs). By using novel classes of highly selective HDAC inhibitors and genetically deficient mouse models, we discovered that HDAC11 rather than HDAC6 is necessary for the proliferation and survival of oncogenic JAK2-driven MPN cells and patient samples. Notably, HDAC11 is variably expressed in primitive stem cells and is expressed largely upon lineage commitment. Although Hdac11is dispensable for normal homeostatic hematopoietic stem and progenitor cell differentiation based on chimeric bone marrow reconstitution, Hdac11 deficiency significantly reduced the abnormal megakaryocyte population, improved splenic architecture, reduced fibrosis, and increased survival in the MPLW515L-MPN mouse model during primary and secondary transplantation. Therefore, inhibitors of HDAC11 are an attractive therapy for treating patients with MPN. Although JAK2 inhibitor therapy provides substantial clinical benefit in MPN patients, the identification of alternative therapeutic targets is needed to reverse MPN pathogenesis and control malignant hematopoiesis. This study establishes HDAC11 as a unique type of target molecule that has therapeutic potential in MPN.
Introduction
Myeloproliferative neoplasms (MPNs) consisting of the JAK2 (JAK2V617F), calreticulin (CALR), and thrombopoietin receptor (MPLW515L)–related chronic myeloid malignancies include the clinicopathologic entities polycythemia vera, essential thrombocythemia, and primary myelofibrosis.1 Patients with MPNs have a range of symptoms, including an increase in 1 or more of their mature hematopoietic cell lineages, severe splenomegaly, and primary or secondary myelofibrosis (MF). The median overall survival in patients with MPNs differs by disease subtype but ranges from 6.5 to 24 years for polycythemia vera, 14.7 years for essential thrombocythemia, and 6 to 10 years for primary myelofibrosis.2-5 Despite sharing genetic features leading directly or indirectly to activation of the JAK-STAT signaling pathways,6-9 randomized open-label phase 3 studies with ruxolitinib (COMFORT I and II) suggested that new therapeutic options are necessary for long-lasting survival benefits in MPN patients with MF.10,11 Although the molecular basis for resistance to ruxolitinib is not fully understood, it is known that malignant stem cells can activate alternative JAK family members to bypass JAK2 inhibitors,12,13 have other mutation events,14,15 and have alternative survival circuits leading to de novo or acquired drug resistance.13,16,17 Given the unmet clinical need in patients with MPNs, new therapies are being investigated to rationally target coexisting or alternative oncogenic signaling pathways.
Four major classes of histone deacetylases (class I-IV HDACs) regulate gene transcription and modulate cellular processes that direct the initiation and progression of cancer by removing the acetyl group from lysine residues on both histones and non-histone proteins.18,19 Pan-HDAC and class I–selective HDAC inhibitors were introduced into the clinic for the treatment of MPNs on the basis of data in MPN cell lines and on their activity in preclinical animal models.20,21 Although these HDAC inhibitors have gained traction, especially in combination with JAK2 inhibitors, they have dose-limiting toxicities such as thrombocytopenia, diarrhea, nausea/vomiting, and cardiovascular complications.22-24 Because the HDAC family comprises 4 classes consisting of 18 distinct proteins with unique and sometimes poorly characterized acetylated protein substrates, we hypothesized that highly selective or class-specific HDAC inhibition would have superior clinical activity in MPNs compared with pan- and class I HDAC inhibitors.
Previous investigations suggested that HDAC6-directed deacetylation of the heat shock protein 90 (HSP90) chaperone compromises JAK2 translation and protein stability.25-27 Therefore, we assessed the effects of HDAC6 selective inhibitors and genetic deficiency on MPNs, and we discovered a previously unidentified role for HDAC11, the sole class IV HDAC,28 as a critical contributor to abnormal hematopoiesis driving MPN pathogenesis.
Methods
Mouse husbandry
Tg-Hdac11-eGFP–, homozygous germline Hdac6-, and Hdac11-deficient mice have been described previously and were genotyped according to established methods.29-31 Use of these mice was governed by a research protocol approved by the Institutional Animal Care and Use Committee (IACUC), and all mice were bred and maintained at the H. Lee Moffitt Cancer Center & Research Institute (IACUC protocols IS00006028 and IS00004986).
Mouse model of MPLW515L-induced MPNs
The MPLW515L-induced MPN mouse model was previously described,7,32 and details of the transplantation model are indicated in supplemental Methods (available on the Blood Web site). Briefly, bone marrow (BM) cells were harvested from donor mice treated with 5-fluorouracil (150 mg/kg) 7 days before BM harvest. Donor cells were then cultured overnight in transplantation medium (RPMI, 10% fetal bovine serum, 6 ng/mL interleukin-3 [IL-3], 10 ng/mL IL-6, and 10 ng/mL stem cell factor) at 37°C and 5% CO2. For 2 consecutive days, donor cells were transduced with recombinant retroviruses overexpressing either MPLW515L or wild-type MPL (MPLWT) in a Gfp-mouse stem cell virus construct using spinfection (2500 rpm for 90 minutes at 30°C). Recipient mice were lethally irradiated (2 × 450 cGy, 24 hours apart) before transplantation (0.8 to 1.0 × 10⁶ cells per mouse intravenously).
For secondary MPN transplantation into lethally irradiated CD45.1 recipients, CD45.2+GFP+ BM cells harvested from either Hdac11+/+MPLW515L or Hdac11−/−MPLW515L primary recipients were pooled after lineage depletion (Miltenyi Biotec Lineage Depletion kit) and injected (3.75 × 10⁵ cells from MPN mice) along with 5.0 × 10⁵ CD45.1 whole BM (WBM) support cells. Survival rate was then assessed in recipient mice.
Assessment of homeostatic hematopoiesis
Donor BM cells were harvested from either Hdac11+/+ or Hdac11−/− C57BL/6j-Ptprcb (CD45.2+) mice and mixed 1:1 with B6.SJL-Ptprca (CD45.1+) BM cells. Adult recipient mice (8-12 weeks old) were lethally irradiated (550 cGy and 500 cGy, ∼3 hours apart) on the day of transplantation. Recipients received 2.0 × 10⁶ cells per mouse intravenously. Peripheral chimerism, hematopoietic reconstitution, and complete blood cell counts were monitored for 75 days from the submandibular vein to evaluate donor cell engraftment. On day 75 after transplantation, recipient BM was harvested, and populations were analyzed via flow cytometry.
Flow cytometry analysis for BM populations
Mouse BM cells were harvested for flow cytometric analysis by using a previously described protocol.33-35 Briefly, BM cells were collected from tibias and femurs, lysed using red blood cell (RBC) lysis buffer (Catalog No. 00-4300-54, eBioscience) and incubated with antibodies for 1 hour on ice. Viability was determined using 4′,6-diamidino-2-phenylindole (DAPI) (Invitrogen, Carlsbad, CA) unless otherwise stated. Mouse peripheral blood was collected from the submandibular vein and was subjected to the same RBC lysis and staining procedures as BM. Flow cytometry was run on a FACS LSRII cytometer (BD Biosciences, San Jose, CA) (details are provided in supplemental Methods) and analyzed with FlowJo software v10.5.0 (FlowJo, Ashland, OR).
Stem and progenitor cell populations from BM were determined after antibody staining (clones, commercial sources, instrument settings, fluorochromes, and filters are described in supplemental Tables 1 and 2). Total Lin–/Sca1+/c-Kit+ (LSK), hematopoietic stem cell (HSC), and multipotent progenitor (MPP) measurements were extrapolated on the basis of the total BM counts and an established surface marker profile as defined in supplemental Figure 5B-C. To analyze mature populations, mouse BM and peripheral blood samples were incubated with Fc Receptor Blocking Reagent (Miltenyi Biotec), anti-CD45, anti-CD3e, anti-B220, anti-CD41, anti-CD11b, anti-F4/80, anti-CD71, and anti-Ter119. In experiments in which green fluorescent protein (GFP) was not analyzed, fluorescein isothiocyanate–conjugated anti-CD3e (clone 145-2C11, BD Biosciences) was used in place of the previously mentioned antibody. The lineage-negative cocktail is defined in supplemental Table 2. To evaluate donor and recipient populations in BM transplantation assays, BM and peripheral blood cells were stained with phycoerythrin-conjugated anti-CD45.1 (clone A20, Tonbo Biosciences) and APC/Cy7-conjugated anti-CD45.2 (clone 104, Tonbo Biosciences). Total LSK, HSC, and MPP measurements were extrapolated on the basis of the total BM counts and an established surface marker profile.
Human and mouse BM colony assays
Colony formation assays of primary human MPN cells were performed, as described previously.36 Additional details are provided in supplemental Methods for both human and mouse colony formation assays.
HDAC biochemical assays
The enzymatic HDAC assays were performed at Nanosyn by using the electrophoretic mobility shift assay. Full-length human recombinant HDAC proteins were expressed in the baculoviral system and purified by affinity chromatography. The human recombinant HDAC3 was co-expressed with Ncor2. The following peptide substrates were used: FAM-RHKK(Ac)-NH2 for HDAC3, HDAC6, and HDAC8; FITC-H3K27(Ac)-NH2 for HDAC1, HDAC2, and HDAC10; and FAM-RHKK(tri-fluor-Ac)-NH2 for HDAC4, HDAC5, HDAC7, HDAC9, and HDAC11. Compound, enzyme, and substrate were combined in reaction buffer (100 mM N-2-hydroxyethylpiperazine-N′-2-ethanesulfonic acid [HEPES; pH 7.5], 25 mM KCl, 0.1% bovine serum albumin, 0.01% Triton X-100) at 25°C and quenched by the addition of termination buffer (100 mM HEPES [pH7.5], 0.01% Triton X-100, 0.05% sodium dodecyl sulfate). The fluorescence intensity of the electrophoretically separated de-acetylated product and substrate peptide were measured and analyzed using the LabChip 3000 microfluidic electrophoresis instrument (Perkin Elmer/Caliper Life Sciences). The 50% inhibitory concentration (IC50) values of inhibitors were determined by fitting the percent inhibition curves with a 4-parameter dose-response model using XLfit 4 software (IDBS).
Statistical analyses
Statistical analyses were conducted using GraphPad Prism software v6.04 (GraphPad Software). Differences between groups were compared by using the unpaired two-tailed Student t test with Welch’s correction in cases in which the variances were not equal. One-way analysis of variance followed by Dunnett’s multiple comparison was performed when comparing multiple groups. Survival statistics were measured using a log-rank (Mantel-Cox) test.37 Statistical significance was established at P < .05.
Results
Inhibition of MPN cell proliferation by pan-HDAC and class I HDAC inhibitors is independent of JAK-STAT signaling
To establish MPN model cell lines for this study and to confirm the activity of HDAC inhibitors, parental IL-3–dependent Ba/F3 cells were transduced with retroviruses expressing MPLW515L or JAK2V617F, which are both well-defined oncogenic drivers in MPNs.1 These 2 cell lines and the JAK2V617F-expressing human erythrocyte cell line HEL92.1.7 and megakaryocytic cell line SET-2 had increased phosphorylated STAT3 (pSTAT3) and pSTAT5 and were sensitive to the JAK2 inhibitor ruxolitinib (supplemental Figure 1A-B; statistical analysis provided in supplemental Table 3). These cell models of MPNs were used to further investigate HDAC inhibitor susceptibility. Notably, at higher doses of ruxolitinib, a plateau was reached in HEL92.1.7 and SET-2 cells showing the expected emergence of drug-resistant cells (supplemental Figure 1A; statistics provided in supplemental Table 3).
To confirm the effects and establish the IC50 for the pan-HDAC inhibitor panobinostat (LBH589) and class I selective HDAC inhibitor entinostat (MS275), survival assays were performed using these 4 MPN cell lines. Proliferation was suppressed by both drugs in a concentration-dependent manner largely independent of effects on JAK-STAT signaling because pSTAT3 and pSTAT5 were active at doses equivalent to and in excess of their IC50 (supplemental Figure 1C-F; statistics provided in supplemental Table 3). The suppressive effects on JAK-STAT signaling were only observed for panobinostat at doses 100-fold greater than the IC50, and they were not observed in cells treated with entinostat (supplemental Figure 1D,F). As expected, both agents increased levels of acetylated histone H3 (ac-H3), consistent with class I HDAC target suppression (supplemental Figure 1D,F),38 as indicated in HEL92.1.7 cells. Thus, the suppressive activity of pan- and class I HDAC inhibitors in cell lines expressing MPN-associated oncogenes is largely independent of effects on JAK-STAT signaling.
MPN cell lines are unaffected by inhibition or loss of HDAC6
It has been suggested that HDAC6 is necessary for JAK2 translation and stabilization.25-27 We therefore treated the MPN cell lines with nexturastat A and FT108, which are reportedly selective for HDAC6 relative to other HDAC family members.39-41 Nexturastat A suppressed the cell lines with an IC50 ranging from 0.11 µM to 4.90 µM, but FT108 lacked activity in all MPN cell lines (Figure 1A-C; statistics provided in supplemental Table 3). α-Tubulin, a well-established target of HDAC6,42,43 showed marked increases in acetylation after treatment with nexturastat A and FT108 in all MPN cell lines (Figure 1D-E), consistent with effective HDAC6 suppression. As shown in HEL92.1.7 cells, nexturastat A treatment suppressed levels of pJAK2 and its downstream targets pSTAT3 and pSTAT5, but again there were no effects on these signaling intermediates after treatment with FT108 (Figure 1D and E, respectively). In tests for specificity, it was revealed that nexturastat A inhibited class I HDAC at the doses tested, because treatment increased levels of ac-H3 (Figure 1D).38 In contrast, FT108 treatment had little to no effect on levels of ac-H3 (Figure 1E), suggesting that it has distinct HDAC-suppressive activity.
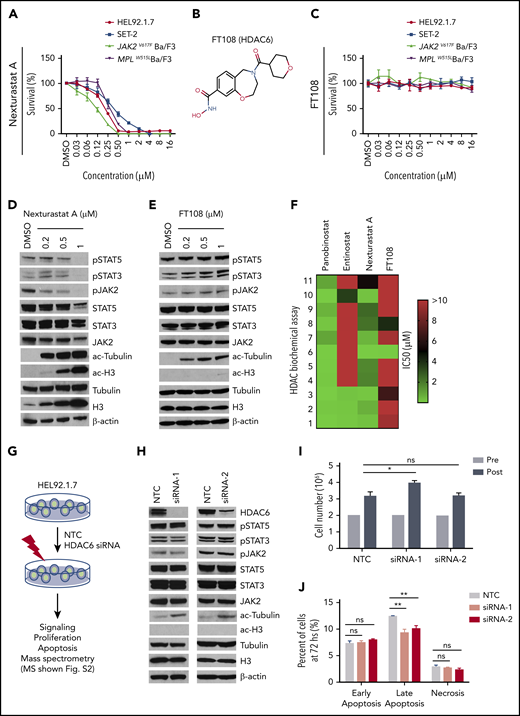
HDAC6 selective inhibitors or siRNA-induced HDAC6 knockdown fails to suppress oncogenic signaling or survival of MPN cells. IC50 for this figure is provided in supplemental Table 3. (A-C) Cell Counting Kit-8 (CCK8) assays were performed similarly throughout in 96-well plates with cells seeded at a density of 0.1 million cells per mL with addition of indicated compounds and incubation at 37°C for 48 hours. CCK8 solution (Dojindo Molecular Technologies, Rockville, MD) was added, and absorbance at 450 nm was measured after 3 hours. Readings were normalized to dimethyl sulfoxide (DMSO)–treated wells. (A) MPN cell lines after treatment with increasing concentrations of nexturastat A. (B) Structure of FT108. (C) Survival after cell lines were treated with FT108 for 48 hours. (D-E) HEL92.1.7 MPN cells with a JAK2V617F mutation were treated with indicated concentrations of (D) nexturastat A and (E) FT108 for 24 hours, and the indicated signaling proteins were assessed by western blot. (F) The IC50 for panobinostat, entinostat, nexturastat A, and FT108 in suppressing each of the indicated HDACs was determined by an enzymatic assay. Color bar indicates concentrations, which ranged from 0 µM (green) to >10 µM (red). (G) Diagram showing experimental design and procedures relevant to panels H-J. (H-J) Signaling pathways, proliferation, and apoptosis were assessed in HEL92.1.7 cells 72 hours after transfection with HDAC6 siRNA or NTC siRNA. Mass spectrometry results are shown in supplemental Figure 2. (H) JAK-STAT pathway, ac-tubulin, and ac-H3 were assessed by western blot in HEL92.1.7 MPN cells treated with HDAC6 siRNA vs cells treated with non-targeting siRNA. (I) HEL92.1.7 MPN cell numbers were counted before and after HDAC6 knockdown. (J) Apoptosis of HEL92.1.7 MPN cells measured by flow cytometry after HDAC6 siRNA-directed knockdown. Statistical analysis was performed using Student t test (comparing NTC in each group). hs, hours; ns, not significant. **P < .01; *P = .01.
HDAC6 selective inhibitors or siRNA-induced HDAC6 knockdown fails to suppress oncogenic signaling or survival of MPN cells. IC50 for this figure is provided in supplemental Table 3. (A-C) Cell Counting Kit-8 (CCK8) assays were performed similarly throughout in 96-well plates with cells seeded at a density of 0.1 million cells per mL with addition of indicated compounds and incubation at 37°C for 48 hours. CCK8 solution (Dojindo Molecular Technologies, Rockville, MD) was added, and absorbance at 450 nm was measured after 3 hours. Readings were normalized to dimethyl sulfoxide (DMSO)–treated wells. (A) MPN cell lines after treatment with increasing concentrations of nexturastat A. (B) Structure of FT108. (C) Survival after cell lines were treated with FT108 for 48 hours. (D-E) HEL92.1.7 MPN cells with a JAK2V617F mutation were treated with indicated concentrations of (D) nexturastat A and (E) FT108 for 24 hours, and the indicated signaling proteins were assessed by western blot. (F) The IC50 for panobinostat, entinostat, nexturastat A, and FT108 in suppressing each of the indicated HDACs was determined by an enzymatic assay. Color bar indicates concentrations, which ranged from 0 µM (green) to >10 µM (red). (G) Diagram showing experimental design and procedures relevant to panels H-J. (H-J) Signaling pathways, proliferation, and apoptosis were assessed in HEL92.1.7 cells 72 hours after transfection with HDAC6 siRNA or NTC siRNA. Mass spectrometry results are shown in supplemental Figure 2. (H) JAK-STAT pathway, ac-tubulin, and ac-H3 were assessed by western blot in HEL92.1.7 MPN cells treated with HDAC6 siRNA vs cells treated with non-targeting siRNA. (I) HEL92.1.7 MPN cell numbers were counted before and after HDAC6 knockdown. (J) Apoptosis of HEL92.1.7 MPN cells measured by flow cytometry after HDAC6 siRNA-directed knockdown. Statistical analysis was performed using Student t test (comparing NTC in each group). hs, hours; ns, not significant. **P < .01; *P = .01.
To define the specificity of these HDAC inhibitors, biochemical assays were performed as described previously44 using fluorescently labeled peptide substrates and electrophoretic mobility shift assay with full-length human recombinant HDAC proteins. As expected, broad suppression of HDACs was observed with panobinostat, whereas entinostat was primarily selective for class I, with activity against the class I HDACs (HDAC1, HDAC2, and HDAC3) but not HDAC8; however, entinostat also suppressed class II HDAC10 (Figure 1F) at high dose levels. In addition, as suggested by its effects on levels of ac-tubulin and ac-H3, nexturastat A displayed broad suppressive activity against several families of HDACs, including class I HDACs. FT108 was far more selective when it had activity against HDAC6 with an IC50 of 0.026 µM, and modest in vitro activity was noted against HDAC3 (IC50, 6.68 µM) and HDAC8 (IC50, 4.07 µM) (Figure 1F).
Given the potential for nonselective activity of these HDAC inhibitors, we tested the specific role of HDAC6 in MPN cells using short interfering RNA (siRNA)–directed knockdown. For these studies, HEL92.1.7 cells were pretreated with non-target control (NTC) siRNA or siRNA specific to HDAC6, as outlined in Figure 1G. Two HDAC6-directed siRNAs reduced HDAC6 expression and led to selective increases in the levels of ac-tubulin (Figure 1H). However, levels of JAK2, pJAK2, pSTAT3, and pSTAT5 (and ac-H3) were not affected by efficient HDAC6 knockdown (Figure 1H). Furthermore, silencing HDAC6 failed to suppress MPN cell proliferation (Figure 1I) or survival (Figure 1J). We conclude that the effects of nexturastat A in HEL92.1.7 MPN cells relates to broader suppression of HDAC family members or off-target effects.
To further investigate the original hypothesis regarding HSP90, we evaluated the impact of HDAC6 silencing on HSP90 acetylation by immunoprecipitation followed by liquid chromatography/tandem mass spectrometry (supplemental Figure 2A).45,46 Unmodified peptides from HSP90α and HSP90β were equally distributed in cells treated with NTC-siRNA or HDAC6-siRNA (NTC:knockdown ratio is 0.84 for HSP90α chain and 1.0 for HSP90β, as shown in supplemental Figure 2A-B), indicating that detected changes in acetylated peptides reflect differences in posttranslational modifications, not only changes in protein expression levels. Unique acetylated peptides (marked with K to denote the modification site) mapped to common sequences in HSP90α and HSP90β proteins at residues K186, K275, and K286 [VILHLK(186)EDQTEYLEER, EK(275)YIDQEELNK, and TK(286)PIWTR/294β], whereas K(624)HLEINPDHPIVETLR mapped to an HSP90β-specific sequence (supplemental Figure 2C-J). HDAC6 knockdown did not modulate the levels of Ac-286/Ac-294, known for its role in binding client proteins, but it did mediate acetylation changes in Ac-K186 and Ac-K624 that play an undefined role in HSP90 function. Therefore, the loss of HDAC6 fails to result in hyperacetylated HSP90 at the only known functional site47,48 regulated by pan and class I HDAC inhibition.48
HDAC11 inhibition or silencing compromises MPN cell survival
On the basis of the results with HDAC6 inhibitor, FT108, and HDAC6 RNA silencing, we then conducted a broader HDAC inhibitor screen with compounds directed toward different HDAC-family proteins. Notably, FT906 and FT234 (structures shown in supplemental Figure 3A and B, respectively) had more narrow selectivity in biochemical assays (supplemental Figure 3C) largely directed at HDAC6, HDAC7, HDAC8 and HDAC11 and suppressed mutant Ba/F3 cell proliferation or survival (supplemental Figure 3D).39,49,50 Transcriptional profiling of patient samples has shown that HDAC11 is expressed in all MPN subtypes, although it is not overexpressed.51 Therefore, the number of compounds with refined specificity for HDAC11 was expanded to include FT743, FT895, and FT383,44 with the latter compound showing highly selective HDAC11 suppressive activity in biochemical assays. FT650 and FT422 are inactive compounds with similar structural backbones, and they had an IC50 >10 µM against all HDAC-family proteins in enzymatic assays (supplemental Figure 3C). IC50 values for growth suppression were determined for the HDAC11 inhibitors with a more refined activity profile (FT234, FT895, FT743, and FT383) in MPN cell lines and, when they were compared with FT422 and FT650 inactive controls, they demonstrated reduced growth of JAK2V617F. All 4 HDAC11 inhibitors effectively suppressed MPN cell survival, whereas there was little to no effect with FT650 or FT422 treatment (Figure 2A-D; statistics provided in supplemental Table 3).

HDAC11 inhibition or silencing suppresses MPN cell survival. (A-D) CCK8 assays were performed to assess survival of mouse and human MPN cell lines, (A) MPLW515L-expressing Ba/F3 cells, (B) JAK2V617F-expressing Ba/F3 cells, and (C) HEL92.1.7 human MPN cells and (D) SET-2 cells treated with several HDAC inhibitors showing various selectivity profiles against HDAC11 (FT234, FT743, FT895, and FT383) or inactive compounds (FT650 and FT422) for 48 hours. Chemical structures not previously published for FT906 (HDAC6/HDAC11) and FT234 (HDAC11) are shown in supplemental Figure 3A-B. Similar experiments described in panels A-D using additional ruxilitinib (Rux) and panobinostat (Pan) treatment of (E) THP-1 and (F) K562 cells. (G) Colony counts from MPLWT or MPLW515L-expressing BM with cytokines to support normal colony growth or without cytokines for expansion of malignant colonies. MPLWT have no colony formation in the absence of cytokines. Supporting data are shown in supplemental Figure 3F for percent GFP and WBC counts of these mice on the day of BM isolation. (H) Inducible non-target control (C) of 2 different HDAC11 shRNAs (Sh1 and Sh2) stably expressed in SET-2 cells was assessed for impact on cell viability using acridine orange (live) and propidium iodine (dead) stain after induction with isopropyl β-D-1 thiogalactopyranoside (IPTG). Western blots conducted to assess HDAC11 protein levels in these cells are shown in the insert. Supplemental Figure 3G shows transient shRNA HDAC11 knockdown in SET2 cells and in JAK2V617F Ba/F3 cells. All experiments were repeated 3 or more times. Statistical analysis was performed using analysis of variance (ANOVA) and P values are indicated. Statistical analysis by two-tailed unpaired Student t test. ****P < .0001; ***P < .001; **P < .01; *P < .05.
HDAC11 inhibition or silencing suppresses MPN cell survival. (A-D) CCK8 assays were performed to assess survival of mouse and human MPN cell lines, (A) MPLW515L-expressing Ba/F3 cells, (B) JAK2V617F-expressing Ba/F3 cells, and (C) HEL92.1.7 human MPN cells and (D) SET-2 cells treated with several HDAC inhibitors showing various selectivity profiles against HDAC11 (FT234, FT743, FT895, and FT383) or inactive compounds (FT650 and FT422) for 48 hours. Chemical structures not previously published for FT906 (HDAC6/HDAC11) and FT234 (HDAC11) are shown in supplemental Figure 3A-B. Similar experiments described in panels A-D using additional ruxilitinib (Rux) and panobinostat (Pan) treatment of (E) THP-1 and (F) K562 cells. (G) Colony counts from MPLWT or MPLW515L-expressing BM with cytokines to support normal colony growth or without cytokines for expansion of malignant colonies. MPLWT have no colony formation in the absence of cytokines. Supporting data are shown in supplemental Figure 3F for percent GFP and WBC counts of these mice on the day of BM isolation. (H) Inducible non-target control (C) of 2 different HDAC11 shRNAs (Sh1 and Sh2) stably expressed in SET-2 cells was assessed for impact on cell viability using acridine orange (live) and propidium iodine (dead) stain after induction with isopropyl β-D-1 thiogalactopyranoside (IPTG). Western blots conducted to assess HDAC11 protein levels in these cells are shown in the insert. Supplemental Figure 3G shows transient shRNA HDAC11 knockdown in SET2 cells and in JAK2V617F Ba/F3 cells. All experiments were repeated 3 or more times. Statistical analysis was performed using analysis of variance (ANOVA) and P values are indicated. Statistical analysis by two-tailed unpaired Student t test. ****P < .0001; ***P < .001; **P < .01; *P < .05.
Cellular specificity of HDAC11 inhibition was expanded to include the myeloid leukemia cell line THP-1 and Bcr-Abl–positive K562 cell line.52 As shown previously, THP-1 and K562 cells were not sensitive to ruxolitinib (Figure 2E-F), but THP-1 cells compared with K562 cells were more sensitive to selective HDAC11 inhibitors, especially FT234, FT895, and FT383 (Figure 2E). On the basis of these findings, additional malignant myeloid and lymphoid cell lines (HL-60, Z138, MEC2, Jurkat, and FcMCL) as well as purified human CD4+ and CD8+ T cells and B cells were studied, and they showed cytotoxicity of HL-60 and 2 of the mantle cell lymphoma cell lines (MEC2 and FcMCL) but no suppression of normal cell populations (supplemental Figure 3E). Collectively, these findings suggest that selective HDAC11 inhibitors preferentially suppress tumor cells compared with normal populations of blood cells from healthy donors.
To further investigate specificity of compound FT234, MPN was generated in mice using the MPLW515L oncogene transplantation model, as described previously.32 Irradiated WT recipient mice transplanted with GFP-MPLW515L retrovirus transduced BM develop leukocytosis, thrombocytosis, enlarged spleens, and MF 2 to 3 weeks after transplantation compared with mice that received GFP-MPLWT retrovirus–expressing BM.7,32 A hallmark of this disease is the expansion of cytokine-independent colonies in short-term assays.53 Interestingly, using GFP-MPLWT BM, cytokine-dependent and -independent colonies showed similar responses to ruxolitinib treatment, consistent with dose-limiting myelosuppression in MPN patients,54 but preferential FT234 activity was observed against growth factor–independent hematopoietic colony formation of mouse BM expanded by GFP-MPLW515L (Figure 2G; supplemental Figure 3F).
Finally, HDAC11-directed short hairpin RNAs (shRNAs) were transiently expressed in JAK2V617F Ba/F3 cells and SET-2 cells or stably expressed in SET-2 cells. Partial knockdown of HDAC11 in JAK2V617F Ba/F3 cells resulted in a decrease in survival (supplemental Figure 3G-H). Both transient (supplemental Figure 3I) and stable overexpression of 2 distinct isopropyl β-D-1 thiogalactopyranoside (IPTG)-inducible HDAC11 shRNA resulted in reduced survival of SET-2 cells vs cells expressing nontargeting shRNA control (Figure 2H) (P < .01 and P < .001).
HDAC11 inhibitors block JAK/STAT signaling and inhibit clonogenic growth of samples from MPN patients
Growth suppression of HEL92.1.7 cells treated with FT234 was accompanied by apoptosis, as indicated by increases in annexin-V and DAPI staining (Figure 3A). Interestingly, FT895 or FT234 treatment of HEL92.1.7 cells (Figure 3B) suppressed JAK2 phosphorylation at lower doses than those required to reduce levels of pSTAT3 and pSTAT5. Although a specific target molecule for HDAC11 is not known, ac-tubulin and ac-H3 were not affected, suggesting that it is unlikely that these compounds have any appreciable cross-reactivity to HDAC6 or class I HDACs, respectively (Figure 3B). Interestingly, there was a significant increase in total H3 expression in response to both compounds.
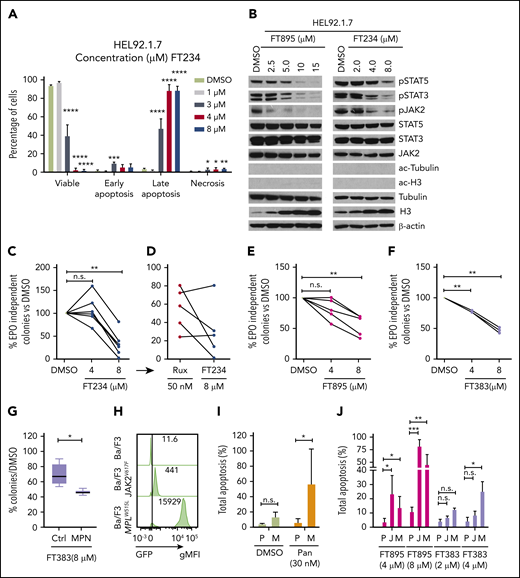
HDAC11-specific inhibitors suppress JAK-STAT signaling, induce apoptosis, and inhibit colony formation in MPN cells and patient samples. (A) HEL92.1.7 MPN cells were treated with FT234 for 16 hours at concentrations of 1, 3, 4, or 8 µM, and the proportion of viable, early apoptotic, late apoptotic, and necrotic cells was measured by flow cytometry. (B) JAK-STAT pathway activation, ac-tubulin, and ac-H3 were detected by western blot in HEL92.1.7 MPN cells treated with the indicated concentrations of FT234 or FT895 for 24 hours. (C-F) EPO-independent colony formation assays were conducted on JAK2V617F-positive MPN patient cells or healthy donor cells treated with FT234, FT895, or FT383 at indicated doses. (C) Treatment with FT234 vs treatment with DMSO vehicle control. (D) Ruxolitinib 50 nM (an established IC50 in similar assays) in a subset of 5 MPN patients treated with FT234 in panel C. (E) FT895 treatment at indicated concentrations vs DMSO control. (F) FT383 treatment at indicated concentrations vs DMSO control. (G) Control (Ctrl) BM cultured in cytokines and BM from MPN patients shown in panel F treated with FT383 (EPO-independent colonies) were compared. Each patient and control sample was analyzed in duplicate. (H) Expression of Gfp-JAK2V617F and Gfp-MPLW515L in transduced Ba/F3 mice was determine by flow cytometry. (I) Total apoptosis of parental Ba/F3 (P) grown in IL-3 and MPLW515L transformed Ba/F3 (M) grown in the absence of IL-3 after 24-hour treatment with DMSO or indicated concentration of panobinostat. Data represent a summary of 2 independent experiments. (J) Apoptosis of parental Ba/F3 (P) grown in IL-3, JAK2V617F transformed Ba/F3 (J), and MPLW515L transformed Ba/F3 (M) grown in the absence of IL-3 after 24-hour treatment relative to DMSO or indicated concentrations of FT895 and FT383. Data represent a summary of 3 independent experiments. Statistical analysis was performed by using ANOVA followed by Dunnett’s multiple comparison test with DMSO group or parental group as control. ****P < .0001; ***P < .001; **P < .01; *P < .05. gMFI, geometric mean fluorescence intensity.
HDAC11-specific inhibitors suppress JAK-STAT signaling, induce apoptosis, and inhibit colony formation in MPN cells and patient samples. (A) HEL92.1.7 MPN cells were treated with FT234 for 16 hours at concentrations of 1, 3, 4, or 8 µM, and the proportion of viable, early apoptotic, late apoptotic, and necrotic cells was measured by flow cytometry. (B) JAK-STAT pathway activation, ac-tubulin, and ac-H3 were detected by western blot in HEL92.1.7 MPN cells treated with the indicated concentrations of FT234 or FT895 for 24 hours. (C-F) EPO-independent colony formation assays were conducted on JAK2V617F-positive MPN patient cells or healthy donor cells treated with FT234, FT895, or FT383 at indicated doses. (C) Treatment with FT234 vs treatment with DMSO vehicle control. (D) Ruxolitinib 50 nM (an established IC50 in similar assays) in a subset of 5 MPN patients treated with FT234 in panel C. (E) FT895 treatment at indicated concentrations vs DMSO control. (F) FT383 treatment at indicated concentrations vs DMSO control. (G) Control (Ctrl) BM cultured in cytokines and BM from MPN patients shown in panel F treated with FT383 (EPO-independent colonies) were compared. Each patient and control sample was analyzed in duplicate. (H) Expression of Gfp-JAK2V617F and Gfp-MPLW515L in transduced Ba/F3 mice was determine by flow cytometry. (I) Total apoptosis of parental Ba/F3 (P) grown in IL-3 and MPLW515L transformed Ba/F3 (M) grown in the absence of IL-3 after 24-hour treatment with DMSO or indicated concentration of panobinostat. Data represent a summary of 2 independent experiments. (J) Apoptosis of parental Ba/F3 (P) grown in IL-3, JAK2V617F transformed Ba/F3 (J), and MPLW515L transformed Ba/F3 (M) grown in the absence of IL-3 after 24-hour treatment relative to DMSO or indicated concentrations of FT895 and FT383. Data represent a summary of 3 independent experiments. Statistical analysis was performed by using ANOVA followed by Dunnett’s multiple comparison test with DMSO group or parental group as control. ****P < .0001; ***P < .001; **P < .01; *P < .05. gMFI, geometric mean fluorescence intensity.
Hematopoietic progenitors from MPN patients can form erythropoietin (EPO)-independent erythroid colonies, a neoplastic characteristic of cells from primary MPN patients. FT234 treatment suppressed this neoplastic colony formation in response to treatment with 8 µM ruxolitinib (Figure 3C), but sensitivity to ruxolitinib was variable (Figure 3D). Although additional testing is required, 3 of 5 samples had greater colony reduction after treatment with FT234 compared with ruxolitinib (Figure 3D). Five donors who exhibited different capacity for EPO-independent colony formation but who harbored a JAK2V617F mutation were then tested for sensitivity to FT895 (activity against HDAC8 and HDAC11), and an additional 3 donors were treated with the highly selective HDAC11 compound FT383. Both compounds similarly suppressed MPN-associated EPO-independent colony formation (Figure 3E and F, respectively). Finally, cytokine-dependent colonies generated from BM of 6 healthy donors were found to be marginally sensitive to the FT383 inhibitor but significantly less sensitive than EPO-independent colonies from MPN patients (P < .05) (Figure 3G).
Next, we directly examined the cellular specificity of HDAC11 inhibitors in transduced GFP-MPLW515L and GFP-JAK2V617F Ba/F3 cells compared with parental Ba/F3 grown in IL-3 (Figure 3H). Panobinostat treatment resulted in selective apoptosis in MPLW515L, as shown previously in JAK2V617F Ba/F3 cells20 (Figure 3I). Interestingly, FT895 was more effective than FT383 in this assay, suggesting that there may be a combinatorial benefit of suppressing both HDAC11 and HDAC8 in oncogene-transformed cells (Figure 3J). Collectively, these results suggest that a possible therapeutic window may be identifiable for HDAC11 inhibitors with further drug development for compound optimization.
HDAC11 inhibitors modulate cell cycle–associated genes and arrest MPN cells in G1 phase
To gain insights into the targets and functions of HDAC11, gene expression profiling was performed in HEL92.1.7 MPN cells with or without FT234 or the inactive compound FT650 (for 6, 12, and 24 hours; supplemental Figure 4A). Principal component analysis mapping showed that technical replicates from cells treated with FT234 generated distinct profiles compared with cells treated with inactive compounds. Moreover, each time point after FT234 treatment was relatively distinct, confirming the quality and reliability of the data (supplemental Figure 4A). Differentially expressed genes induced by FT234 treatment were subjected to gene set enrichment analysis to identify potential transcription factors that act as drivers of the gene signatures based on upstream cis-regulatory motifs.55 Among the top hits, ATF3_Q6, a set of 254 genes with a 3′ untranslated region containing at least 1 copy of the motif CBCTGACGTCANCS for ATF3 (supplemental Table 4; supplemental Figure 4B) was identified as a candidate transcription factor. In addition, pathways enriched among differentially expressed genes in FT234-treated cells were among well-defined biological processes represented in the hallmarks collection56 of MSigDB. E2F TARGETS, a gene set of cell cycle–related targets of the transcription factor E2F (supplemental Table 4; supplemental Figure 4B), and G2M CHECKPOINT, a set of genes involved in the cell cycle G2/M checkpoint (supplemental Table 4; supplemental Figure 4B) were identified. Among the differentially expressed genes, CDKN1A (p21CIP1), ATF3, and JUN expression were markedly increased by eightfold, 29-fold, and 25-fold, respectively, after FT234 treatment (supplemental Figure 4C). In contrast, the expression of AURKA, AURKB, CDC20, CDCA8, and CDCA3 were all reduced by FT234 treatment (supplemental Figure 4C). The induction of p21CIP1 was confirmed by quantitative reverse transcription polymerase chain reaction (Figure 4A). Finally, treatment with HDAC11 inhibitors increased p21CIP1 and reduced levels of cyclin B1 and pAurora-B, consistent with the transcription factor expression (Figure 4B), suggesting that FT234 treatment modified the cell cycle.
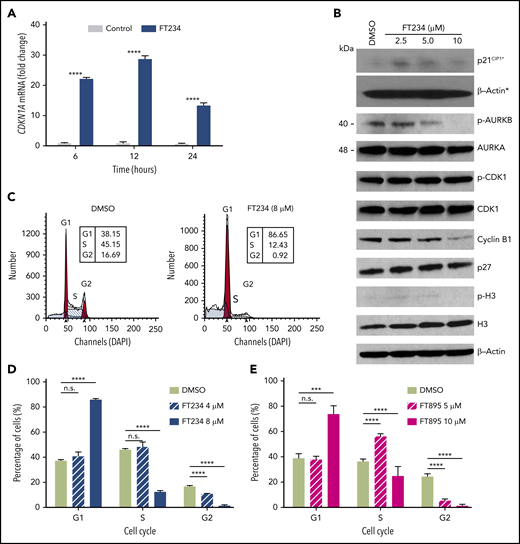
Cell cycle–associated gene expression is modulated by HDAC11 inhibitors that arrest MPN cells in G1. (A) HEL92.1.7 JAK2V617F-positive MPN cell line was treated with 8 μM FT234 or inactive control FT650 for 6, 12, or 24 hours. CDKN1A messenger RNA (mRNA) expression was examined by quantitative reverse transcription polymerase chain reaction. Statistical analysis was performed by using two-tailed unpaired Student t test. (B) Cell cycle–related proteins were measured by western blot in HEL92.1.7 cells treated with FT234 at indicated doses for 12 hours. Asterisks indicate experiments run on a different blot; a β-actin loading control for the blot is provided. (C-D) HEL92.1.7 cells were treated with DMSO (vehicle) or FT234 and (E) FT895 at the indicated doses for 12 hours. Cell cycle was then assessed by flow cytometry, and data were analyzed using ModFit LT software. Multiple Student t tests (compared with DMSO in each group) were performed to assess significant differences. ****P < .0001; ***P < .01.
Cell cycle–associated gene expression is modulated by HDAC11 inhibitors that arrest MPN cells in G1. (A) HEL92.1.7 JAK2V617F-positive MPN cell line was treated with 8 μM FT234 or inactive control FT650 for 6, 12, or 24 hours. CDKN1A messenger RNA (mRNA) expression was examined by quantitative reverse transcription polymerase chain reaction. Statistical analysis was performed by using two-tailed unpaired Student t test. (B) Cell cycle–related proteins were measured by western blot in HEL92.1.7 cells treated with FT234 at indicated doses for 12 hours. Asterisks indicate experiments run on a different blot; a β-actin loading control for the blot is provided. (C-D) HEL92.1.7 cells were treated with DMSO (vehicle) or FT234 and (E) FT895 at the indicated doses for 12 hours. Cell cycle was then assessed by flow cytometry, and data were analyzed using ModFit LT software. Multiple Student t tests (compared with DMSO in each group) were performed to assess significant differences. ****P < .0001; ***P < .01.
To assess whether the cell cycle signature provoked by FT234 treatment led to functional changes, cell cycle analysis was performed in MPN cell lines after treatment with HDAC11 inhibitors of different specificity. G1 arrest and corresponding decreases in the numbers of cells in the S and G2 phases of the cell cycle were evident in FT234- or FT895-treated HEL92.1.7 MPN cells (Figure 4C-E). In contrast, panobinostat treatment did not elicit the same phenotype (supplemental Figure 4D-F), whereas treatment with the CDK1 inhibitor RO3306 specifically blocked HEL92.1.7 MPN cells in G2 phase (supplemental Figure 4G-I). Thus, HDAC11 inhibition alters cell cycle–related genes and results in p21CIP1 induction, G1 arrest, and apoptosis.
HDAC11 is dispensable for normal hematopoiesis
Hdac11−/− mice are viable and exhibit no gross abnormalities (supplemental Figure 5A).29 As shown in Figure 5A, several approaches were used to assess the role of HDAC11 in steady-state hematopoiesis: expression of an enhanced GFP (eGFP) reporter under the control of the Hdac11 promoter in transgenic Hdac11-eGFP mice (Tg-Hdac11-eGFP)30,57 , BM lineage distribution in germline–deficient Hdac11−/− compared with Hdac11+/+ mice, and repopulation dynamics after chimeric BM transplantation.
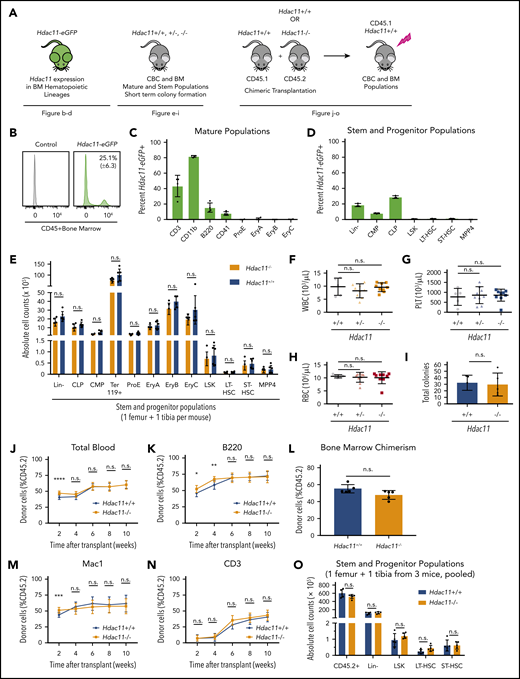
HDAC11 is expressed in mouse BM cell subsets and Hdac11 loss does not interfere with normal hematopoiesis. (A) Schematic of mouse models and experimental design used to assess the role of HDAC11 in normal hematopoiesis. (B-D) eGFP-Hdac11 expression in Tg-Hdac11-eGfp reporter mice53 in BM subpopulation as determined by flow cytometry. (E) Absolute stem and progenitor cell counts from Hdac11−/− and matched Hdac11+/+ from 1 tibia and 1 femur as determined by flow cytometry. The data represent 3 independent experiments with 6 mice per genotype per experiment. (F-H) WBC, platelet (PLT), and RBC counts from Hdac11+/+(n = 5), Hdac11+/− (n = 9), and Hdac11−/− (n = 9) mice (8 weeks old) are shown. (I) In vitro colony formation counts from Hdac11+/+ or Hdac11−/− WBM cells (1 × 10⁴) seeded in methylcellulose media for 7 days. The data represent 2 independent experiments with 2 to 3 mice per genotype per experiment. (J-N) BM cells (1 × 10⁶) from CD45.2 Hdac11+/+ (n = 4) or Hdac11−/− (n = 4) mice transplanted into lethally irradiated recipient mice (n = 15 recipients per genotype) along with CD45.1 recipient BM cells (1 × 10⁶). Donor cell reconstitution in the myeloid (Mac1+ cells), B-cell (B220+), and T-cell (CD3+) lineages from peripheral blood for 2 to 10 weeks after transplantation. (O) BM chimerism and absolute donor cell numbers of lineage-negative (Lin–), LSK, HSPCs (LT-HSCs and ST-HSCs) 10 weeks after transplantation. Flow gating for this experiment and for LT-HSCs and ST-HSCs is shown in supplemental Figure 5B-C). Additional methods for antibodies and instrument settings are provided in supplemental Tables 1 and 2. Additional supporting data are provided in supplemental Figure 5D-L. CLP, committed lymphoid progenitor; CMP, committed myeloid progenitor. Statistical analysis was performed by using multiple two-tailed unpaired Student t test. ****P < .0001; ***P < .001; **P < .01; *P < .05.
HDAC11 is expressed in mouse BM cell subsets and Hdac11 loss does not interfere with normal hematopoiesis. (A) Schematic of mouse models and experimental design used to assess the role of HDAC11 in normal hematopoiesis. (B-D) eGFP-Hdac11 expression in Tg-Hdac11-eGfp reporter mice53 in BM subpopulation as determined by flow cytometry. (E) Absolute stem and progenitor cell counts from Hdac11−/− and matched Hdac11+/+ from 1 tibia and 1 femur as determined by flow cytometry. The data represent 3 independent experiments with 6 mice per genotype per experiment. (F-H) WBC, platelet (PLT), and RBC counts from Hdac11+/+(n = 5), Hdac11+/− (n = 9), and Hdac11−/− (n = 9) mice (8 weeks old) are shown. (I) In vitro colony formation counts from Hdac11+/+ or Hdac11−/− WBM cells (1 × 10⁴) seeded in methylcellulose media for 7 days. The data represent 2 independent experiments with 2 to 3 mice per genotype per experiment. (J-N) BM cells (1 × 10⁶) from CD45.2 Hdac11+/+ (n = 4) or Hdac11−/− (n = 4) mice transplanted into lethally irradiated recipient mice (n = 15 recipients per genotype) along with CD45.1 recipient BM cells (1 × 10⁶). Donor cell reconstitution in the myeloid (Mac1+ cells), B-cell (B220+), and T-cell (CD3+) lineages from peripheral blood for 2 to 10 weeks after transplantation. (O) BM chimerism and absolute donor cell numbers of lineage-negative (Lin–), LSK, HSPCs (LT-HSCs and ST-HSCs) 10 weeks after transplantation. Flow gating for this experiment and for LT-HSCs and ST-HSCs is shown in supplemental Figure 5B-C). Additional methods for antibodies and instrument settings are provided in supplemental Tables 1 and 2. Additional supporting data are provided in supplemental Figure 5D-L. CLP, committed lymphoid progenitor; CMP, committed myeloid progenitor. Statistical analysis was performed by using multiple two-tailed unpaired Student t test. ****P < .0001; ***P < .001; **P < .01; *P < .05.
First, Hdac11-eGFP was expressed by ∼25% of CD45+ hematopoietic cells in the BM (Figure 5B), including a proportion of mature cells that included 43.4% (± 13.9%) CD3+ T cells, 82% (± 1.25%) CD11b+ myeloid cells, 15.4% (± 6.1%) B220+ B cells, and 7.7% (± 6.1%) megakaryocytes. Low expression was detected in CD71+ erythrocytes (≤2%), including pro-erythrocyte subpopulations (ProE), EryA, EryB, and EryC (Figure 5C; supplemental Figure 5B-C). Hdac11-eGFP was also expressed in a small but detectable population of lineage-negative BM cells, which consisted primarily of committed lymphoid progenitor (Lin–/c-Kitlow/Sca1low; 28.8% ± 1.7%) and committed myeloid progenitor (Lin–/c-Kit+/Sca1–; 7.8% ± 0.6%) populations (Figure 5D). Interestingly, hematopoietic stem and progenitor cells (HSPCs), including LSK cells, and subpopulations, including CD34–/CD135– long-term HSCs (LT-HSCs), CD34+/CD135– short-term HSCs (ST-HSCs), and CD34+/CD135+ MPP4 BM cells, displayed rare yet detectable Hdac11 expression, indicating that Hdac11 is manifested primarily in the mature and committed progenitor compartment (Figure 5D), yet is expressed in some primitive populations. Supplemental to Hdac11-eGFP+ reporter mice, an online single-cell RNA sequencing data set was investigated for the expression of both Hdac6 and Hdac11 messenger RNA (http://www.altanalyze.org/hematopoietic.html).58 Hdac6 was found to be homogeneously expressed in HSPCs, whereas, Hdac11 messenger RNA was indeed expressed only in rare HSPC subsets.
Interestingly, BM cell counts of Lin–, committed populations (committed lymphoid progenitor and committed myeloid progenitor), erythrocyte populations (Ter119, ProE, EryA, EryB, and EryC), and stem cell populations (LSK, LT-HSC, ST-HSC, and MPP4) were similar in Hdac11−/− compared with Hdac11+/+ mice (Figure 5E). These results suggest that HDAC11 is largely dispensable for steady-state hematopoiesis, although HDAC11 is expressed in a portion of HSCP cells. Peripheral blood counts from Hdac11−/− mice showed normal white blood cell (WBC), platelet, and RBC counts (Figure 5F-H), as well as normal monocytes and neutrophil counts (supplemental Figure 5D) vs those in Hdac11+/+ littermates. Short-term colony formation in vitro performed with IL-6–, EPO-, IL-3–, and stem cell factor–containing methylcellulose, interestingly showed that there is no impact of Hdac11 deficiency on colony numbers (Figure 5I; supplemental Figure 5E).
Finally, the repopulation potential of Hdac11−/− HSPCs was assessed in vivo by using competitive BM transplantation. Peripheral blood chimerism (performed over time) and BM chimerism (performed after ∼10 weeks) showed no differences in repopulation capabilities between Hdac11−/− and Hdac11+/+ HSPCs (Figure 5J-O; supplemental Figure 5F-K), confirming that HDAC11 is dispensable for homeostatic hematopoiesis. Additional flow gating strategies are shown for CD45.1 and CD45.2 populations in supplemental Figure 5L.
Hdac11 but not Hdac6 deficiency impairs MPN induced by MPLW515L
Given the distinct outcomes of HDAC6 and HDAC11 inhibitors, Hdac6−/− and Hdac11−/− mice were examined for strain-specific effects in the MPLW515L model of MPN. First, to study the role of HDAC6 in MPN in vivo, Hdac6+/+ WT and Hdac6−/− BM (Figure 6A) (C57Bl/6 [CD45.2]) were transduced with MPLW515L-expressing retrovirus and then transplanted into lethally irradiated WT syngeneic (C57Bl/6 [CD45.1]) recipient mice. Disease initiation was evaluated at 2 time points after transplantation in recipients. Markedly increased levels of WBCs, platelets, hemoglobin, and hematocrit were observed in both groups (Figure 6B-F) along with other hallmarks of the disease, including increased spleen size (Figure 6G-H) and reduced total BM cell counts (Figure 6I).32,53

HDAC6 deficiency fails to reduce tumor burden of MPLW515L mice. (A) Schematic showing experiment design. Congenic WT recipient mice received MPLW515L-transduced Hdac6−/− or Hdac6+/+ BM. WT recipients transplanted with MPLWT-transduced BM served as controls. (B) WBC, (C) platelet (PLT) count, (D) RBC counts, (E) hemoglobin (Hgb), and (F) hematocrit (HCT) levels of the indicated transplanted recipient mice were determined on day 18 (the first 2 columns in MPLW515L) and day 25 (the last 2 columns in MPLW515L). (G-H) Mice were euthanized and spleen weights were measured on day 25. (I) BM cells isolated from 2 femurs and 2 tibias from the indicated transplanted recipient mice were counted. Statistical analysis was performed by using multiple two-tailed unpaired Student t test. ***P < .001; **P < .01; *P < .05.
HDAC6 deficiency fails to reduce tumor burden of MPLW515L mice. (A) Schematic showing experiment design. Congenic WT recipient mice received MPLW515L-transduced Hdac6−/− or Hdac6+/+ BM. WT recipients transplanted with MPLWT-transduced BM served as controls. (B) WBC, (C) platelet (PLT) count, (D) RBC counts, (E) hemoglobin (Hgb), and (F) hematocrit (HCT) levels of the indicated transplanted recipient mice were determined on day 18 (the first 2 columns in MPLW515L) and day 25 (the last 2 columns in MPLW515L). (G-H) Mice were euthanized and spleen weights were measured on day 25. (I) BM cells isolated from 2 femurs and 2 tibias from the indicated transplanted recipient mice were counted. Statistical analysis was performed by using multiple two-tailed unpaired Student t test. ***P < .001; **P < .01; *P < .05.
To assess the potential roles of HDAC11 in MPLW515L-induced MPN, Hdac11+/+ and Hdac11−/− BM were transduced with GFP-MPLW515L-expressing retrovirus. First, equal infectivity (indicated by GFP expression) of the MPLW515L-Gfp virus was demonstrated in WBM, Lin–, LSK, LT-HSC, ST-HSC, and MPP4 populations of Hdac11+/+ and Hdac11−/− mice (supplemental Figure 6A-B). In addition, to evaluate the relationship between malignant and normal hematopoietic cells during viral infection and disease progression, a cohort of recipient mice received cells from both genotypes that were mixed at a 1:1 ratio before GFP-MPLW515L viral infection. GFP-MPLW515L-expressing Hdac11−/− donor BM was also transplanted into irradiated Hdac11+/+ or Hdac11−/− recipient mice to assess possible roles of the Hdac11-deficient hematopoietic cells and niche, respectively, in the induction of MPNs. WBCs, platelets, and RBCs were then analyzed at 2 time points posttransplantation (Figure 7A-C; supplemental Figure 6C). Notably, recipient mice receiving GFP-MPLW515L-transduced Hdac11−/− BM had significantly reduced numbers of WBCs and platelets compared with Hdac11+/+ BM donor cells, and this phenotype was dependent on the mixture of the oncogenic MPLW515L driver–expressing Hdac11 cells present in the initial infection (Figure 7A-C). A similar trend in disease was manifested in Hdac11−/− recipient mice transplanted with GFP-MPLW515L-expressing Hdac11−/− BM (Figure 7A-C).

Chimeric transplantation demonstrates a dose-dependent effect of HDAC11 depletion in attenuating MPLW515L-induced disease. (A-C) WT recipients (n = 5 per group) were transplanted with MPLWT- or MPLW515L-expressing BM, or with a 1:1 mixture of MPLW515L-expressing Hdac11+/+ and Hdac11−/− BM. Hdac11−/− recipients also received MPLW515L-transduced Hdac11−/− BM to assess potential effects of HDAC11 deficiency on the BM niche. (A) WBC, (B) platelet, and (C) RBC counts were determined in the indicated transplant recipients (Rec) on day 11 (supplemental Figure 6) and day 18 after transplantation. Statistical analysis was performed by using ANOVA, followed by Dunnett’s multiple comparison test with P < .05. (D) Western blot analyses of pSTAT3 and pSTAT5 were performed with BM cells isolated from the indicated transplant recipient mice. (E-F) Spleen and liver (supplemental Figure 6) weights were measured in the indicated transplant recipient mice on day 20. (G) Colony formation assays were performed with BM cells from indicated groups in methylcellulose media without cytokine addition except in the WT control group, which was supplemented with cytokines. ANOVA was performed followed by multiple comparison test using MPLW515L-transplanted WT donors as control. Two-tailed unpaired Student t test was used to compare WT donors receiving MPLW515L-transduced BM from each group. (H) Histological analysis of spleen and BM harvested at day 20. Hematoxylin and eosin (H&E) staining of the spleen and BM shown at an original magnification of ×10 or ×60 (insert) or reticulin stain shown at an original magnification of ×20 using an Olympus BVC51 microscope fitted with a UPlanFL N lens. (I) Hdac11+/+MPLWT, Hdac11+/+MPLW515L, and Hdac11−/−MPLW515L BM cells were transplanted into recipients (n = 3 to 5 per group). Survival was monitored over 70 days. (J) Lin– cells were enriched from BM of recipient mice that received either Hdac11+/+MPLW515L (n = 9) or Hdac11−/−MPLW515L (n = 10) cells after disease was established to similar levels on the basis of GFP expression (supplemental Figure 7B). Enriched Lin– cells were transplanted into lethally irradiated secondary recipients (n = 6 to 8 per group) and survival was monitored. KO, knockout. Survival statistics were performed by using log-rank (Mantel-Cox) test with P value indicated.37 ****P < .0001; ***P < .001; *P < .05.
Chimeric transplantation demonstrates a dose-dependent effect of HDAC11 depletion in attenuating MPLW515L-induced disease. (A-C) WT recipients (n = 5 per group) were transplanted with MPLWT- or MPLW515L-expressing BM, or with a 1:1 mixture of MPLW515L-expressing Hdac11+/+ and Hdac11−/− BM. Hdac11−/− recipients also received MPLW515L-transduced Hdac11−/− BM to assess potential effects of HDAC11 deficiency on the BM niche. (A) WBC, (B) platelet, and (C) RBC counts were determined in the indicated transplant recipients (Rec) on day 11 (supplemental Figure 6) and day 18 after transplantation. Statistical analysis was performed by using ANOVA, followed by Dunnett’s multiple comparison test with P < .05. (D) Western blot analyses of pSTAT3 and pSTAT5 were performed with BM cells isolated from the indicated transplant recipient mice. (E-F) Spleen and liver (supplemental Figure 6) weights were measured in the indicated transplant recipient mice on day 20. (G) Colony formation assays were performed with BM cells from indicated groups in methylcellulose media without cytokine addition except in the WT control group, which was supplemented with cytokines. ANOVA was performed followed by multiple comparison test using MPLW515L-transplanted WT donors as control. Two-tailed unpaired Student t test was used to compare WT donors receiving MPLW515L-transduced BM from each group. (H) Histological analysis of spleen and BM harvested at day 20. Hematoxylin and eosin (H&E) staining of the spleen and BM shown at an original magnification of ×10 or ×60 (insert) or reticulin stain shown at an original magnification of ×20 using an Olympus BVC51 microscope fitted with a UPlanFL N lens. (I) Hdac11+/+MPLWT, Hdac11+/+MPLW515L, and Hdac11−/−MPLW515L BM cells were transplanted into recipients (n = 3 to 5 per group). Survival was monitored over 70 days. (J) Lin– cells were enriched from BM of recipient mice that received either Hdac11+/+MPLW515L (n = 9) or Hdac11−/−MPLW515L (n = 10) cells after disease was established to similar levels on the basis of GFP expression (supplemental Figure 7B). Enriched Lin– cells were transplanted into lethally irradiated secondary recipients (n = 6 to 8 per group) and survival was monitored. KO, knockout. Survival statistics were performed by using log-rank (Mantel-Cox) test with P value indicated.37 ****P < .0001; ***P < .001; *P < .05.
Regarding signaling, western blot analyses of BM from recipient mice revealed that Hdac11 deficiency lowered MPLW515L-induced pSTAT3 and pSTAT5, consistent with results of HDAC11 inhibitor-treated cell lines (Figure 7D). Splenomegaly (summarized in Figure 7E; pictured in supplemental Figure 6D) had some reduction with significance in the knockout into knockout group (P < .05). Furthermore, liver weights (Figure 7F) were positively impacted by GFP-MPLW515L-Hdac11−/− mice compared with those receiving GFP-MPLW515L-Hdac11+/+ BM. Notably, BM from recipient mice receiving GFP-MPLW515L-Hdac11−/− BM failed to form cytokine-independent colonies, whereas these were obvious in BM from GFP-MPLW515L-Hdac11+/+ mice (Figure 7G). Importantly, in this experiment, a similar pretransplantation infection rate (8% to 10% GFP+ in WBM; supplemental Figure 6E) was observed in all groups. The percentage of GFP+ cells in WBM is shown posttransplantation in supplemental Figure 6E. Although the proportions of GFP+CD71+ cells are similar, the proportion of GFP+CD11b+ and GFP+CD41+ were significantly reduced in mice transplanted with Hdac11−/−MPLW515L BM (supplemental Figure 6F-H). Hdac11+/+ BM transduced with MPLWT virus used as a control resulted in normal hematopoietic reconstitution (supplemental Figure 6I-K) on day 38 after transplantation.
Histology was then assessed in the mice described in Figure 7A-G. Transplantation with MPLWT into WT recipients resulted in normal trilineage hematopoiesis with an average of 90% BM cellularity, normal splenic parenchyma with essentially normal white-pulp:red pulp ratios, and no BM reticulin fibrosis (Figure 7Hi-iii). In contrast, GFP-MPLW515L-transduced WT BM into WT recipients showed the expected MPN phenotype characterized by hypercellularity (nearly 100%) with markedly atypical megakaryocytic proliferation, prominent extramedullary hematopoiesis in the spleen with increased myeloid islands, and a number of atypical megakaryocytes with diffuse bizarre morphology (Figure 7Hiv-v). Moreover, these mice displayed severe reticulin fibrosis (average MF-3+ grade) according to the European Consensus System (Figure 7Hvi). Importantly, GFP-MPLW515L-Hdac11−/− transplant recipients had similar cellularity but significantly reduced megakaryocyte numbers, fewer atypical features present in the megakaryocyte population, fewer myeloid islands, and significantly reduced reticulin fibrosis, further demonstrating the role of Hdac11 in MPLW515L-induced MPN. The reduction in disease manifestations was further reduced by the transplantation of knockout bone marrow into knockout recipients (Figure 7Hx-xii). Finally, a survival benefit was found in mice receiving Hdac11−/−MPLW515L-transplanted BM (P = .01; Figure 7I). Thus, Hdac11 loss markedly suppressed the disease-specific phenotype of MPLW515L-induced MPN.
The role of Hdac11 in self-renewal potential and fitness of oncogene-stressed HSPCs was assessed by serially transplanting 3.75 × 10⁵ lineage depleted (Lin–) BM cells pooled from 6 to 8 primary recipients per treatment into 6 to 8 lethally irradiated recipient mice supplemented with 5 × 10⁵ nontransduced WBM cells (supplemental Figure 7). Here, congenic recipient mice expressing CD45.1 were used to define lineage reconstitution (supplemental Figure 7A). Similar percentages of GFP+ BM cells were present in all 4 transplantation groups at the time of secondary transplantation (supplemental Figure 7B). Survival was then monitored, and interestingly, secondary transplantation of Hdac11+/+MPLW515L Lin– BM with support cells resulted in rapid lethality in all mice (Figure 7J) compared with those that received Hdac11−/−MPLW515L (P = .01) (Figure 7J), suggesting that the impact of HDAC11 deficiency occurs within the oncogene-driven HSPC population.
Discussion
MPNs are chronic myeloid malignancies characterized by clonal expansion of mature myeloid precursors, resulting in excessive production of peripheral blood cells, extramedullary hematopoiesis, and BM fibrosis.59 Pathogenesis of MPN is caused by constitutive activation of the JAK-STAT pathway induced by driver mutations in JAK2 (JAK2V617F), CALR, or the thrombopoietin receptor (MPLW515L), as well as by mutations in epigenetic modifiers (eg, ASXL1, TET2, EZH2, DNMT3A) and transcription regulators (eg, TP53, IKZF1).59 Current drug therapies in MPNs are not curative. Germane to our studies, JAK2 inhibitors show efficacy in reducing spleen size and ameliorating constitutional symptoms of MF patients,60,61 yet they fail to reduce JAK2V617F allele burden, reverse fibrosis, or induce complete long-term remissions.62,63 Given the fact that MPN pathogenesis involves several molecular aberrations such as epigenetic dysregulation, megakaryocyte abnormalities, and downstream activation of the JAK-STAT pathway,16,64 which may partially account for the limitations of JAK2 inhibition therapy, several other agents, including HDAC inhibitors,22,23,65-67 hypomethylating drugs,68,69 and other drugs targeting megakaryocytic abnormalities70 are being investigated in MPN.
Pan-HDAC and class I HDAC inhibitors have been tested in MPN clinical trials and have shown efficacy in reducing spleen size and inducing remissions.22,23 However, adverse effects have limited their use.22,65-67 It has been hypothesized that the efficacy of these inhibitors is the result of HDAC6 inhibition, given the reported interplay between HDAC6, HSP90, and JAK2 translation and stability,25,26,71 which suggests that HDAC6 inhibitors should be studied clinically in MPN.25,26,71 HDAC6 belongs to the class II HDAC family and was the first HDAC identified to be active in the cytoplasm,72 where it deacetylates α-tubulin42,43,73 and HSP90.26,71,74 Acetylation of HSP90 could have a large effect on the stability of its many client proteins, including JAK2, that play a critical role in cell survival.75,76 On the basis of these connections, our initial goal was to assess the efficacy of HDAC6 selective inhibitors in MPN. Interestingly, neither a highly selective HDAC6 inhibitor nor silencing of HDAC6 suppressed MPN cells, although clear effects on α-tubulin acetylation were observed, which suggests that HDAC6 is not a therapeutic target in MPN. HDAC6 has been shown to deacetylate a number of cellular targets, including K-Ras, HIF-1α,77 p53,78 Ku70,79 and β-catenin,80 although the specific acetylation site of most of these proteins (including HSP90) is unknown. The primary acetylation site of HSP90 (K294α75 ), important in the recruitment of epidermal growth factor receptor (EGFR), was unchanged by Hdac6 RNA silencing in HEL92.1.7. Association between HSP90 and JAK2 was not assessed,48 but the number of copies of an individual substrate may be low because numerous proteins compete for HSP90 binding, which makes these interactions difficult to detect. Although additional investigation is warranted, our data suggest that oncogenic driver mutations in MPN may overcome the requirement for HDAC6-associated HSP90 regulation, which would make them resistant to HDAC6 inhibition. Additional studies are required to investigate the relationship between HDAC6 and HSP90 in JAK2-mutant MPN.
HDAC11 has a small molecular mass of 39 kDa and exhibits only slight sequence similarity to the other HDAC members but retains the conserved domains required for deacetylase activity.28 HDAC11 was initially reported to be expressed in kidney, heart, brain, skeletal muscle, and testis tissue,28 but was later reported to be expressed in hematopoietic cells, including erythroblasts and eosinophils.30,81 Studies reported herein are the first to show that HDAC11 contributes to MPN pathology. The Tg-Hdac11-eGFP reporter mouse model showed differential HDAC11 expression in the BM compartment and confirmed HDAC11 in cell types such as CD11b+ myeloid cells containing the macrophage population that has recently been shown to be a critical mediator of MPN pathogenesis and in a relatively low proportion of CD41+ megakaryocytes.70,82 Regarding function in normal steady-state hematopoiesis, our findings that recipient mice transplanted with Hdac11−/− or Hdac11+/+MPLWT BM had comparable transplantation chimerism indicates that HDAC11 does not participate in homeostatic hematopoiesis or posttransplantation reconstitution. Furthermore, normal BM HSPCs in Hdac11−/− mice indicate that HDAC11 is dispensable for normal hematopoiesis.
HDAC11 is the most recently identified HDAC and has the least understood biological functions.28 To date, the identified functions of HDAC11 include immune regulation81,83,84 and metabolism,29,85 and it is considered a target with selectivity to carcinoma cells vs normal cells.86 Specifically, HDAC11 has been shown to modulate the functions of effector T cells, OX40- expressing regulatory T cells, neutrophils, and myeloid-derived suppressor cells, and has been shown to suppress IL-10 transcription.30,31,81,83,84,87 Recent studies have also suggested that HDAC11 functions as a fatty acid deacylase that regulates metabolic homeostasis.29,88 Regarding its potential roles in cancer, HDAC11 inhibition has been shown to provoke growth arrest in N-MYC-driven neuroblastoma,89 and HDAC11 overexpression and cell death after HDAC11 depletion has been reported in several cancer cell lines, including HCT-116 colon, PC-3 prostate, breast, and ovarian cancer cell lines.86 By using Hdac11−/− mice, an aggressive transplantation MPN mouse model driven by oncogenic MPL, we determined that HDAC11 loss significantly decreased disease burden and markedly impaired cytokine-independent, colony-forming capacity of malignant BM cells. Moreover, a survival benefit after primary and secondary transplantation suggests that HDAC11 plays a role in regulating the Lin– HSPC population during oncogene-driven hematopoiesis.
Notably, our broad screen of HDAC inhibitors in MPN cells first indicated the potential for HDAC11 to be a potential candidate target, although FT234 also had activity against HDAC7 and HDAC8, which may have contributed to cell suppression. Intriguingly, HDAC11 selective inhibitors downregulated the JAK-STAT pathway in a concentration-dependent manner, induced apoptosis, and suppressed growth of colonies from JAK2V617F-positive MPN patient samples. Here, using highly selective HDAC11 inhibitors, we observed suppressive activity in MPN tumor cell lines, but not healthy T cells, B cells, and mouse BM populations. Interestingly, selective apoptosis was observed in MPLW515L-Ba/F3 vs parental Ba/F3 similar to panobinostat.20 FT895, a compound with HDAC11 and weak HDAC8 suppressive activity, proved more active in this assay, which makes it impossible to rule out the potential combinatorial benefit of targeting HDAC8 and HDAC11 to generate the optimal pharmacological response. However, RNA-mediated gene knockdown compromised the growth and survival of MPN cell lines ex vivo, which is associated with inactivation of the JAK-STAT pathway by an unknown mechanism. Whether there are direct or indirect effects of HDAC11 on regulating the JAK-STAT signaling pathway remains to be determined.
Mechanistically, gene expression profiling and gene set enrichment analysis establish that the G1 arrest in MPN cells induced by HDAC11 inhibitors is associated with repression of genes involved in mitosis or the G2/M transition, including AURKA, AURKB, PLK1, CDC20, and CDCA8 that were significantly downregulated, as well as to the induction of the CDK inhibitor CDKN1A (p21CIP1) that play direct roles in suppression of the G1-to-S transition.90 Cell cycle arrest via the induction of p21CIP1 has also been observed in other cells types treated with class I or pan-HDAC inhibitors,91,92 and this control seems to be direct, because HDAC inhibitors enhance histone acetylation at the CDKN1A promoter, release the repressor HDAC11, and/or augment Sp1 binding to the promoter.90-93
Our study implicates HDAC11 in the pathophysiology of MPN using the MPLW515L transplantation model, human and mouse MPN cell lines, and MPN patient samples. This represents a new therapeutic vulnerability that warrants further investigation. However, a recognized limitation of the study is the aggressive nature of the transplantation mouse model, which could be addressed by studying the impact of Hdac11 deficiency in another genetically engineered, nontransplant MPN mouse model (such as the JAK2V617F transgenic mouse94 ). Moreover, additional structure-based drug design of selective HDAC11 inhibitors may result in therapeutic advances in MPN.
The publication costs of this article were defrayed in part by page charge payment. Therefore, and solely to indicate this fact, this article is hereby marked “advertisement” in accordance with 18 USC section 1734.
All data and materials will be shared according to the journal’s guidelines; contact the corresponding author Pearlie K. Epling-Burnette (pearlie.burnette@moffit.org).
The online version of this article contains a data supplement.
Acknowledgments
The authors thank the staff of the Proteomics and Metabolomics, Flow Cytometry, Molecular Genomics, and Cancer Informatics Cores of the Moffitt Cancer Center, the Moffitt/University of South Florida (USF) Comparative Medicine Program, and USF Health; John Cleveland from the H. Lee Moffitt Cancer Center & Research Institute (Tampa, FL) for reviewing the data, suggesting additional experiments, and editing the manuscript; and the MPN Research Foundation and Leukemia & Lymphoma Society for their past support, which was critical for development of the animal model used in this project.
This work was supported in part by a Sponsored Research Agreement between Forma Therapeutics and the H. Lee Moffitt Cancer Center & Research Institute (P.K.E.-B.), and by funds from the National Institutes of Health, National Cancer Institute (NCI) Center Core Support Grant P30-CA076292, NCI grant 5PO1CA108671-11, and by core facilities supported by NCI grant P0-CA008748.
Authorship
Contribution: P.K.E.-B., L.Y., and V.S. conceived and designed the study; J.M.R.B., C.M., A.A.A., V.S., N.P.H., N.E.A., H.L.G., J.M.K., and M.S.B. developed the methodology; L.Y., J.M.R.B., A.A.A., V.S., W.E.G., E.S., J.J.P., G.W.R., K.L.W., J.Y.L., X.Z., P.Y.N., M.W.M., C.G.M., R.L.L., E.M.S., Z.S., N.P.H., L.N.D., J.M.K., M.S.B., C. Colin, and Q.T.L.-S. acquired the data (provided animals, acquired and managed patients, provided facilities); L.Y., A.A.A., V.S., G.W.R., K.L.W., N.P.H., H.L.G., L.Z., L.N.D., J.M.K., M.S.B., and C. Conti analyzed and interpreted the data (statistical analysis, biostatistics, computational analyses); L.Y., V.S., P.K.E.-B., A.A.A., N.P.H., G.W.R., A.V., and H.L.G. wrote, reviewed, and/or revised the manuscript; all authors reviewed the manuscript; L.Y., V.S., J.M.R.B., A.A.A., N.P.H., V.S., W.E.G., E.S., and M.S.B. provided administrative, technical, or material support (reporting or organizing data, constructing databases); P.K.E.-B., G.W.R., K.L.W., J.Y.L., X.Z., P.Y.N., M.W.M., C.G.M., C. Conti, and J.P.-I. supervised the study; and J.Y.L., X.Z., P.Y.N., M.W.M., and C.G.M. designed and synthesized compounds.
Conflict-of-interest disclosure: J.Y.L., C. Conti, X.Z., P.Y.N., M.W.M., and C.G.M. were or currently are employees of Forma Therapeutics. R.L.L. is on the supervisory boards of QIAGEN, Imago, Mana, Auron, C4 Therapeutics, and Isoplexis and was on the advisory board of Loxo until 2019. He received research support from and consulted for Celgene and Roche and consults for Incyte, Eli Lilly, Janssen, Astellas, Morphosys, and Novartis; receives research support from Prelude; received honoraria from Astra Zeneca, Roche, Eli Lilly, and Amgen for invited lectures and from Gilead for grant reviews. P.K.E.-B. and the H. Lee Moffitt Cancer Center & Research Institute have received payment from licensing unrelated technology to Celgene and have a conflict of interest management plan and a research agreement with Incyte. The remaining authors declare no competing financial interests.
Correspondence: Pearlie K. Epling-Burnette, Department of Immunology, H. Lee Moffitt Cancer Center & Research Institute, Tampa, FL 33612; e-mail: pearlie.burnette@moffit.org.
