

Key Points
Development of a robust GE signature discriminating localized-stage and advanced-stage FL.
The genetic signature may be responsible for the superior outcome of localized-stage FL.

Abstract
The genetic background of follicular lymphomas (FLs) diagnosed in advanced clinical stages III/IV, and which are frequently characterized by t(14;18), has been substantially unraveled. Molecular features, as exemplified in the clinicogenetic risk model m7FLIPI, are important tools in risk stratification. In contrast, little information is available concerning localized-stage FL (clinical stages I/II), which accounts for ∼20% of newly diagnosed FL in which the detection rate of t(14;18) is only ∼50%. To investigate the genetic background of localized-stage FL, patient cohorts with advanced-stage FL or localized-stage FL, uniformly treated within phase 3 trials of the German Low-Grade Lymphoma Study Group, were comparatively analyzed. Targeted gene expression (GE) profiling of 184 genes using nCounter technology was performed in 110 localized-stage and 556 advanced-stage FL patients. By penalized Cox regression, a prognostic GE signature could not be identified in patients with advanced-stage FL, consistent with results from global tests and univariate regression. In contrast, it was possible to define robust GE signatures discriminating localized-stage and advanced-stage FL (area under the curve, 0.98) by penalized logistic regression. Of note, 3% of samples harboring an “advanced-stage signature” in the localized-stage cohort exhibited inferior failure-free survival (hazard ratio [HR], 7.1; P = .0003). Likewise, in the advanced-stage cohort, 7% of samples with a “localized-stage signature” had prolonged failure-free survival (HR, 2.3; P = .017) and overall survival (HR, 3.4; P = .072). These data support the concept of a biological difference between localized-stage and advanced-stage FL that might contribute to the superior outcome of localized FL.
Introduction
Follicular lymphomas (FLs) represent the most frequent subtype of indolent malignant lymphomas in Western countries. FL epitomizes the neoplastic equivalent of the physiological germinal center reaction, recapitulating the cellular composition of reactive lymphoid follicles. The constitutive overexpression of antiapoptotic BCL2 inferred by t(14;18)(q32;q21) leads to an accumulation of inappropriately rescued germinal center B cells with a prolonged life span, allowing for the occurrence of additional genetic hits required for the establishment of overt lymphoma. The clinical course of FL is highly variable. Some patients with aggressive disease die within a few years of diagnosis,1,2 whereas other patients have a median overall survival (OS) >20 years.3 Despite these facts, current guidelines recommend uniform therapeutic approaches in the vast majority of cases.4 Many attempts have been made, among them gene expression (GE) profiling, to establish molecular markers, allowing for a prognostic stratification of patients.5-7 The seminal paper by Dave et al described 2 immune response (IR) signatures, IR-1 and IR-2, that reflect features of the microenvironment and provide prognostic information.5 However, these approaches remained unvalidated or were inconclusive when validated (eg, with immunohistochemical approaches).8,9 More recently, m7FLIPI, which integrates clinical variables and somatic mutations, turned out to be a highly promising tool for tailored risk stratification of patients.10 The m7FLIPI algorithm was established in a cohort of advanced-stage FL patients (clinical stages III/IV, according to the Ann Arbor classification). In contrast, ∼20% of patients are diagnosed in localized stages of the disease (clinical stages I/II).11 Molecular characterization of these localized-stage FLs has not been accomplished, particularly in uniformly treated patient cohorts. Radiation therapy is frequently implemented with a curative approach because, in contrast to their systemic counterparts, ∼50% and 45% of patients with localized-stage FLs remain relapse-free at 10 and 15 years, respectively.12 Therefore, it needs to be elucidated whether localized FL should be categorized as an independent disease that fundamentally differs from systemic FL. Very recently, this hypothesis was fueled by the finding that only 53% of localized-stage FLs harbored the translocation t(14;18), whereas it is present in 85% of advanced-stage FLs.13 Moreover, t(14;18)-positive and -negative FL differ significantly in their mutational spectrum and in their GE profile, reflecting the activation of distinct pathways in BCL2-rearranged and nonrearranged FL.14,15 In addition, t(14;18)-negative FLs show an enrichment of IR-associated signaling,14 obviously reflecting their dependence on nonmalignant bystander cells of their microenvironment.5,6,16,17 This suggests that at least a proportion of localized and advanced-stage FLs use different molecular circuits. Given the fact that t(14;18)-positive and -negative FLs harbor distinct GE profiles and that the frequency of t(14;18) differs in localized- and advanced-stage FLs,13 we hypothesized that localized and advanced-stage FLs should differ in their GE profile. NanoString technology can be robustly and reliably used in formalin-fixed paraffin-embedded (FFPE) tissues. The present study had 2 main goals. Because the prognostic impact of the IR-1 and IR-2 signatures5 had not been validated until now, our intent was to establish a prognostic signature for advanced-stage FLs, to reconstruct this signature with NanoString technology, and to use it on FL tissue samples from patients enrolled into prospective clinical trials. Our second goal was to develop a GE-based model to differentiate early- and advanced-stage FLs.
Patients and methods
Patient cohorts
All patients (adults older than 18 years) had been enrolled in randomized multicenter clinical trials of the German Low-Grade Lymphoma Study Group (GLSG) treating patients with FL grades 1, 2, and 3A according to the World Health Organization classification.3 The diagnosis of FL was confirmed by the pathology reference panel of the GLSG. Altogether, 1223 previously untreated advanced-stage patients in need of therapy were treated within the GLSG1996 and GLSG2000 clinical trials and were assigned to CHOP (cyclophosphamide, doxorubicin, vincristine, prednisone) or MCP (mitoxantrone, chlorambucil, prednisone)18 or to CHOP with or without rituximab (R),19 respectively. Patients responding to induction were assigned to receive autologous stem cell transplantation or maintenance with interferon-α. A total of 286 patients with newly diagnosed localized-stage FL I/II and limited-stage FL III recruited between 2000 and 2006 was treated with a radiotherapy protocol comparing standardized techniques.20 All trials were conducted in accordance with the Declaration of Helsinki. The protocols were approved by the ethics review committee of each participating center.
GE profiling
Digital GE profiling was performed on cell lysates from FFPE specimens using NanoString nCounter technology for research use (NanoString Technologies, Seattle, WA) (supplemental Methods, available on the Blood Web site). Seven hundred and ten samples from patients with advanced-stage FL and 160 samples from patients with localized-stage FL were available for GE profiling (Figure 1). One hundred and eighty-four target genes that were described to be associated with prognosis and/or pathogenesis in FL, including IR-1 (n = 40) and IR-2 (n = 24) signature genes5 and 7 reference genes were investigated (supplemental Table 1). Normalization steps and quality control criteria for the NanoString data are described in supplemental Methods.
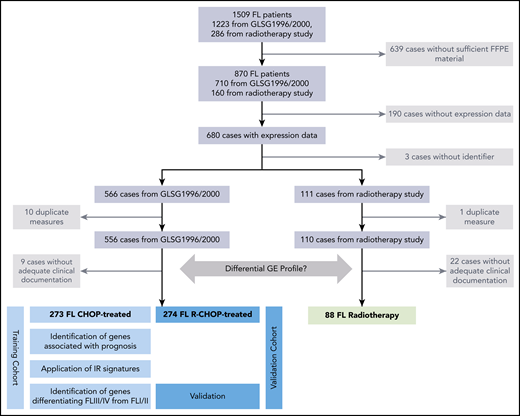
Overview of the study design and patient flow. FFPE tissue samples of 870 FL specimens were subjected to NanoString-based GE measurements. Following quality control and normalization, 680 of 870 tumor samples (78%) remained and were subsequently analyzed to develop a prognostic model in advanced-stage FL (n = 556; separated into training and validation cohorts) or to investigate for the differential GE of localized-stage FL (n = 110) and advanced-stage FL.
Overview of the study design and patient flow. FFPE tissue samples of 870 FL specimens were subjected to NanoString-based GE measurements. Following quality control and normalization, 680 of 870 tumor samples (78%) remained and were subsequently analyzed to develop a prognostic model in advanced-stage FL (n = 556; separated into training and validation cohorts) or to investigate for the differential GE of localized-stage FL (n = 110) and advanced-stage FL.
Statistical methods
Clinical outcome was measured by the time-to-event data failure-free survival (FFS) from treatment start to stable disease, progression or death from any cause, and OS from study registration to death from any cause. FFS was censored at the latest tumor assessment when no progression or death had been reported. OS was censored at the last contact data when no death had been reported. To compare the distribution of variables between 2 groups, the Mann-Whitney U test was used for quantitative data, Fisher’s exact test was used for categorical data, and the log-rank test was used for time-to-event data. Cox regression was used to validate and develop prognostic models, whereas logistic regression was used to develop a signature discriminating early- and advanced-stage FL. To judge the prospects of being able to derive new signatures, global tests for the association of the expression of the 184 genes with stage or clinical outcome were performed using the R package globaltest (version 5.16.0; https://www.bioconductor.org), adjusting for the Follicular Lymphoma International Prognostic Index (FLIPI) prognostic factors in case of prognostic models. We corrected univariate analyses of GE associations with clinical data for multiple testing using the Bonferroni-Holm procedure, adjusting the global significance level of 5% to every local test. To derive novel GE signatures, we applied penalized elastic net regression with parameter α ranging from 1 (Lasso) to 0 (Ridge regression) in steps of 0.1 using R package glmnet (version 1.9-5) with R version 3.0.2 (https://www.r-project.org). To derive a prognostic signature, the established FLIPI risk factors were included in the regression models and were not penalized. The model with the smallest cross-validated deviance was selected. Model derivation used only the patients treated with chemotherapy without R (CHOP or MCP in GLSG1996 or GLSG2000) to allow a potential validation in patients treated with R-CHOP in GLSG2000. With this split into training and validation cohorts, we maximized the statistical power for training to avoid overfitting with the high number of predictors in comparison with a lower number of outcome events. Furthermore, we used homogeneously treated cohorts to separate prognostic effects from treatment effects.
Results
A total of 710 advanced-stage and 160 localized-stage samples from the entire trial cohorts was available for analysis. After quality control measurements and normalization, as well as exclusion of cases because of duplicate measurements and missing clinical data, 666 samples were available for analysis. Of those, 556 samples (83%) were advanced-stage FL, and 110 specimens (17%) were localized-stage FL (Figure 1). Clinical data for advanced-stage and localized-stage FL cohorts amenable to GE profiling closely matched the entire study population (supplemental Table 2). To establish an optimized risk stratification model and to ideally reconstruct the prognostic impact of the IR-1 and IR-2 signatures developed by Dave et al5 in FFPE-derived FL, samples of advanced-stage FL with GE profiles were separated into a training cohort treated with CHOP/MCP without R (n = 273, 181 FFS and 84 OS events) and a validation cohort (n = 274, 104 FFS and 49 OS events; Figure 1) treated with R. No significant differences between the training and the validation sets were observed with respect to clinical parameters, including the FLIPI score (Table 1). As expected, FFS was significantly longer in the R-CHOP cohort compared with the MCP and CHOP cohorts (supplemental Figure 1). Median follow-up was 13 years for the early-stages cohort, 10.4 years for the training cohort of advanced-stage FL, and 7.6 years for the validation cohort of advanced-stage FL. The impact of GE on treatment resistance or disease progression within 24 months (FFS24) was investigated in a global test using logistic regression in the training cohort of advanced-stage FL patients. Of 269 patients, 10 patients were excluded because of an observation time <2 years without an FFS event. A total of 106 of the remaining 259 patients (41%) had an FFS event within the first 24 months after initiation of chemotherapy. The global test did not reveal a prognostic relevance of the expression data of the whole group of 184 genes for FFS24, either alone (P = .47) or adjusted for clinical variables (P = .19), whereas the clinical features alone were of significant prognostic impact for FFS24 (P < .0001).
Comparison of clinical features in the training and validation cohorts of patients with advanced-stage FL
| Validation cohort (R-CHOP) | Training cohort (MCP/CHOP) | P | |||||
|---|---|---|---|---|---|---|---|
| Count | % | n | Count | % | n | ||
| GLSG1996 Trial | 0 | 0 | 274 | 141 | 52 | 273 | |
| GLSG2000 Trial | 274 | 100 | 132 | 48 | <.001 | ||
| Males | 130 | 47 | 274 | 136 | 50 | 273 | .61 |
| Stage IV disease | 180 | 66 | 271 | 179 | 66 | 273 | .86 |
| BM involved | 165 | 63 | 261 | 167 | 61 | 272 | .72 |
| Affected LN regions >4 | 181 | 69 | 261 | 183 | 67 | 272 | .64 |
| B symptoms present | 113 | 42 | 271 | 119 | 44 | 272 | .66 |
| ECOG score | |||||||
| 0 | 91 | 35 | 266 | 85 | 32 | 268 | .73 |
| 1 | 149 | 58 | 160 | 60 | |||
| 2 | 18 | 7 | 21 | 8 | |||
| 3 | 0 | 0 | 1 | 0 | |||
| 4 | 0 | 0 | 1 | 0 | |||
| Elevated LDH | 78 | 30 | 261 | 72 | 27 | 271 | .44 |
| Hb <120 g/L | 52 | 19 | 267 | 53 | 19 | 272 | >.99 |
| FLIPI | |||||||
| Low | 34 | 14 | 248 | 40 | 15 | 269 | .93 |
| Intermediate | 106 | 43 | 112 | 42 | |||
| High | 108 | 44 | 117 | 43 | |||
| Underwent first-line ASCT | 73 | 27 | 274 | 65 | 24 | 273 | |
ASCT, autologous stem cell transplantation; BM, bone marrow; ECOG, Eastern Cooperative Oncology Group; FLIPI, FL International Prognostic Index; Hb, hemoglobin; LDH, lactate dehydrogenase; LN, lymph node.
The prognostic impact of the IR-1 and IR-2 signature model could not be validated in advanced-stage FL
A global test adjusted for clinical variables argued against a multivariate association between GE profiles and survival in the whole group of 184 genes (P = .35 for OS; P = .75 for FFA). In contrast, clinical variables alone were associated with outcome (P < .0001 for OS, P = .011 for FFS). Of the 184 candidate genes tested in the training cohort, none had an expression level that was associated with OS or FFS in univariate Cox regression or in penalized Cox models. Using these statistical procedures, which gave consistent results, a novel prognostic GE signature could not be established for chemotherapy-treated advanced-stage FL patients. Because the genes of the IR-1 and IR-2 signatures5 were included in the gene set, these signatures and the resultant survival predictor score (SPS) could be calculated within the training cohort as previously described (SPS = 2.71 × IR-2 signature average − 2.36 × IR-1 signature average).5 The median signature score was 10.1 (range, 9.2-11.0) for IR-1 and 9.4 (range, 8.2-10.7) for IR-2, resulting in a median SPS of 1.7 (range, −0.7 to 3.5) (supplemental Figure 2). Neither IR-1 and IR-2 nor SPS was associated with FFS or OS, with or without adjustment for FLIPI prognostic factors and performance status. Therefore, a prognostic relevance for the published IR signatures could not be validated in our clinical trial cohort. Similar results were obtained in the validation cohort (data not shown).
The GE profile of localized-stage FL differs significantly from that of advanced-stage FL
The global test indicated a significant association of GE with stage (localized, n = 110 vs advanced, n = 269; P = .0003; 3 patients with missing clinical follow-up were excluded). Twelve genes were differentially expressed in univariate analysis. Of those, 10 genes (BIN2, TNFRSF13B, CD69, SLP1, C9ORF52, TNFSRF25, STAT4, IL7R, LEF1, GZMB) were overexpressed in localized-stage FL, and 2 genes (BCL2 and C4A) were overexpressed in advanced-stage FL (Figure 2A; supplemental Table 3). Subsequently, we created models for the discrimination of localized-stage and advanced-stage FL in the training cohort using penalized logistic regression. Ridge regression (α = 0) enabled a robust class prediction and showed the smallest cross-validated deviance, whereas Lasso regression (α = 1) created a model with the lowest input of genes (n = 63; supplemental Table 4). Of these 63 genes, 21 (33%) were part of the IR signature code set.5 Using either of the 2 regression models, the GE differed significantly between localized-stage FL and advanced-stage FL (Figure 2B-C). Predictive capability using receiver operating characteristic curves for both signatures revealed high areas under the curves, with counts of 0.9742 and 0.9795 in Lasso and Ridge regression, respectively, indicating a high predictive power of the models. Signature counts with the highest sum of sensitivity and specificity were used to define the cutoff between localized-stage FL and advanced-stage FL (signature score STS1 = 13.672: Lasso and signature score STS0 = 2.932: Ridge regression), respectively (Figure 2D-E).
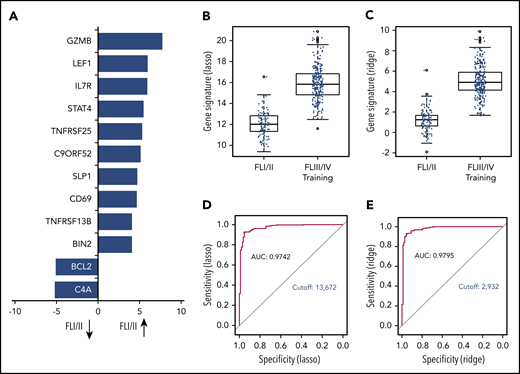
GE profile differs significantly in localized-stage and advanced-stage FL. (A) Z-scores of significant genes that are differentially expressed between localized-stage (I/II) FL and advanced-stage (III/IV) FL in the training cohort. Distribution of the gene signatures with the Lasso model (B) and Ridge regression (C) within the tumors of localized-stage FL (n = 110; median, 12.0; minimum, 9.4; maximum, 16.6 respectively; and median, 1.2; minimum, −1.9, maximum, 6.1) and advanced-stage FL (n = 269; median, 15.8; minimum, 11.6; maximum, 20.9 respectively; and median, 4.9; minimum, 1.7; maximum, 9.9). The predictive capability of the signatures was determined using receiver operating characteristic curves. Signature counts with the highest sum of sensitivity and specificity, defining the cutoff between early- and advanced-stage FL, with 13.672 (Lasso; D) and 2.932 (Ridge regression; E), respectively. AUC, area under the curve.
GE profile differs significantly in localized-stage and advanced-stage FL. (A) Z-scores of significant genes that are differentially expressed between localized-stage (I/II) FL and advanced-stage (III/IV) FL in the training cohort. Distribution of the gene signatures with the Lasso model (B) and Ridge regression (C) within the tumors of localized-stage FL (n = 110; median, 12.0; minimum, 9.4; maximum, 16.6 respectively; and median, 1.2; minimum, −1.9, maximum, 6.1) and advanced-stage FL (n = 269; median, 15.8; minimum, 11.6; maximum, 20.9 respectively; and median, 4.9; minimum, 1.7; maximum, 9.9). The predictive capability of the signatures was determined using receiver operating characteristic curves. Signature counts with the highest sum of sensitivity and specificity, defining the cutoff between early- and advanced-stage FL, with 13.672 (Lasso; D) and 2.932 (Ridge regression; E), respectively. AUC, area under the curve.
Expression of the “localized-stage signature” is independent of the BCL2 translocation status
Based on our previous results showing an enrichment of t(14;18)-negative tumors in localized-stage FL (47% in localized-stage FL vs 14% in advanced-stage FL)13 and differential GE profiles in t(14;18)-positive and -negative FL,14 we wanted to clarify whether the signature differentially expressed between localized-stage FL and advanced-stage FL merely reflected a different t(14;18) translocation status. Although the gene signatures were highly discriminative of localized-stage and advanced-stage status (Lasso: odds ratio [OR], 3.58; 95% confidence interval [CI], 2.71-4.99; P < 2 × 10⁻¹⁶ and Ridge: OR, 5.16; 95% CI, 3.60-7.96; P = 3.4 × 10⁻¹⁶), they remained significantly different in t(14;18)-positive samples (Lasso: OR, 3.39; 95% CI, 2.48-4.96; P = 3.69 × 10⁻¹² and Ridge: OR, 4.68; 95% CI, 3.17-7.56; P = 2.24 × 10⁻¹²; supplemental Figure 4) and t(14;18)-negative samples (Lasso: OR, 4.20; 95% CI, 2.44-8.88; P = 9.21 × 10⁻⁶ and Ridge: OR, 7.34; 95% CI, 3.35-23.30; P = 3.93 × 10⁻⁵; supplemental Figure 3). This indicates that the signatures were associated with stage, independent of the underlying t(14;18) status.
GE signatures discriminating localized-stage and advanced-stage FL have prognostic significance
Based on the calculated signature cutoffs by Lasso and Ridge regression, 21 of 269 (8%) and 20 of 269 (7%) cases with a GE corresponding to the localized-stage profile (“localized-stage signature”) were identified in the training cohort of advanced-stage FL. The profile observed in the discrepant cases clearly discriminated those samples from the remaining concordant cases (Figure 2B-C). This phenomenon is underscored by the fact that, in these alternatively staged tumors, the median number of affected lymph nodes was significantly lower compared with FL with an advanced-stage GE profiling (3 vs 7; Lasso: P = .0028; Ridge: P = .0006). More than 4 affected lymph node regions were observed in 43% (localized-stage signature) vs 70% (advanced-stage signature; Lasso: P = .015) and in 30% vs 71% (Ridge: P = .0007), respectively (supplemental Table 5A). No difference in other FLIPI factors (lactate dehydrogenase, hemoglobin, age) or Eastern Cooperative Oncology Group performance status was observed. Because advanced stage is an adverse prognostic factor in FL,3 the prognostic relevance of the gene signatures was explored with log-rank tests for FFS and OS as a proof of principle. Interestingly, advanced-stage FL with a localized-stage FL GE profile had longer FFS and OS in the training set compared with advanced-stage FL with advanced-stage GE profiling (Lasso regression: FFS: hazard ratio [HR], 1.7, P = .085 and OS: HR, 1.2; P = .65; Figure 3A-B; Ridge regression: FFS: HR, 2.3; P = .017 and OS: HR, 3.4; P = .072; Figure 3C-D). A similar effect was seen in the validation cohort: 35 of 237 (15%) and 36 of 237 (15%) advanced-stage FLs were classified as localized-stage FL by GE profiling in Lasso and Ridge regression, respectively. In a similar fashion, stage III/IV patients with a localized-stage FL GE profile exhibited a significantly lower number of affected lymph nodes (median, 5) compared with their advanced-stage–like GE counterparts (Lasso: median, 7.5; P = .0006; Ridge: median, 8; P = .0002). Likewise, in the validation cohort, >4 affected lymph node regions were observed in 54% (localized-stage signature) vs 73% (advanced-stage signature; Lasso: P = .044) and in 50% vs 74% (Ridge: P = .0092), respectively (supplemental Table 5B). As seen in the training set, patients with an advanced-stage FL harboring a GE profile of localized-stage FL exhibited a superior clinical course compared with advanced-stage “advanced GE profile” FL [Lasso regression: FFS: HR, 1.2; P = .61 and OS: HR, 2.3; P = .15; Figure 4A-B; Ridge regression: FFS: HR, 2.2; P = .028 and OS: HR, 8.1; P = .013; Figure 4C-D). In keeping with these findings, 3 of 88 patients (3%) with clinical data identified in the localized-FL cohort, but harboring a GE profile resembling advanced-stage FL (“advanced-stage signature”), had an inferior clinical course compared with their localized-stage GE profile counterparts in Lasso regression (HR, 7.5; P = .0002) and in Ridge regression (HR, 7.1; P = .0003; Figure 5).
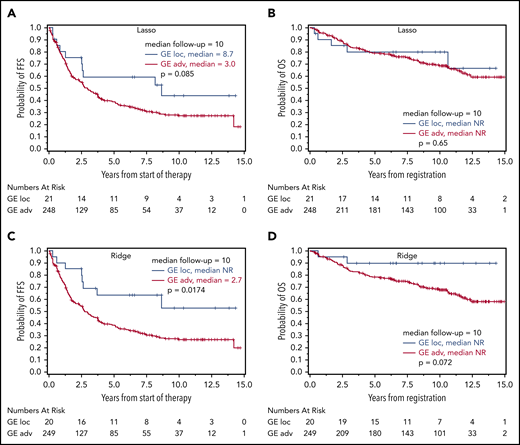
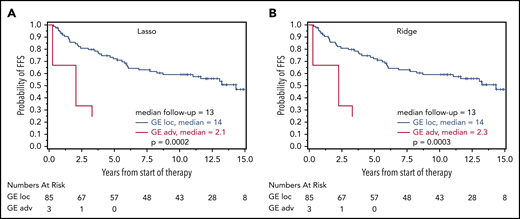
Prognostic relevance of correct GE-classification in the training cohort. Kaplan-Meier plots with log-rank P values for FFS (A,C) and OS (B,D) in patients with a GE profile for localized-stage FL (I/II) identified by the Lasso model (A-B) and Ridge regression (C-D) in the training cohort of advanced-stage FL (III/IV) treated without R. FFS and OS for patients with Lasso-based signature STS1 ≥ 13.672 (n = 248; 169 and 78 events for FFS and OS, respectively) and STS1 < 13.672 (n = 21; 10 and 5 events for FFS and OS, respectively) (A-B). FFS (C) and OS (D) for patients with Ridge-based signature STS0 ≥ 2.932 (n = 249; 171 and 81 events for FFS and OS, respectively) and STS0 < 2.932 (n = 20; 8 and 2 events for FFS and OS, respectively).
Prognostic relevance of correct GE-classification in the training cohort. Kaplan-Meier plots with log-rank P values for FFS (A,C) and OS (B,D) in patients with a GE profile for localized-stage FL (I/II) identified by the Lasso model (A-B) and Ridge regression (C-D) in the training cohort of advanced-stage FL (III/IV) treated without R. FFS and OS for patients with Lasso-based signature STS1 ≥ 13.672 (n = 248; 169 and 78 events for FFS and OS, respectively) and STS1 < 13.672 (n = 21; 10 and 5 events for FFS and OS, respectively) (A-B). FFS (C) and OS (D) for patients with Ridge-based signature STS0 ≥ 2.932 (n = 249; 171 and 81 events for FFS and OS, respectively) and STS0 < 2.932 (n = 20; 8 and 2 events for FFS and OS, respectively).
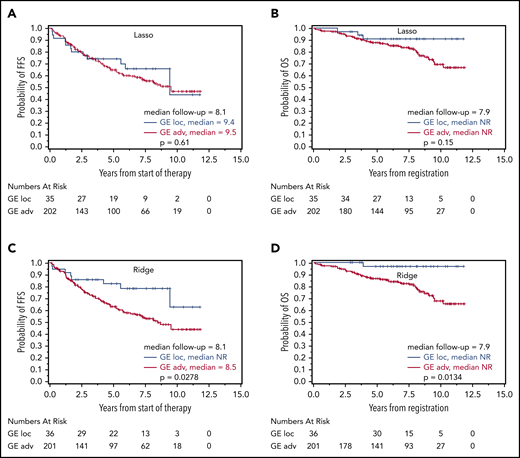
Prognostic relevance of correct GE-classification in the validation cohort. Kaplan-Meier plots with log-rank P values for FFS (A,C) and OS (B,D) in patients with a GE profile for localized-stage FL (I/II) identified by the Lasso model (A-B) and Ridge regression (C-D) in the validation cohort of advanced-stage FL (III/IV) treated with R-CHOP. FFS (A) and OS (B) for patients with Lasso-based signature STS1 ≥ 13.672 (n = 202; 84 and 41 events for FFS and OS, respectively) and STS1 < 13.672 (n = 35; 12 and 3 events for FFS and OS, respectively). FFS (C) and OS (D) for patients with Ridge-based signature STS0 ≥ 2.932 (n = 201; 88 and 43 events for FFS and OS, respectively) and STS0 < 2.932 (n = 36; 8 and 1 event for FFS and OS, respectively). Thirty-seven patients with missing clinical follow-up were excluded.
Prognostic relevance of correct GE-classification in the validation cohort. Kaplan-Meier plots with log-rank P values for FFS (A,C) and OS (B,D) in patients with a GE profile for localized-stage FL (I/II) identified by the Lasso model (A-B) and Ridge regression (C-D) in the validation cohort of advanced-stage FL (III/IV) treated with R-CHOP. FFS (A) and OS (B) for patients with Lasso-based signature STS1 ≥ 13.672 (n = 202; 84 and 41 events for FFS and OS, respectively) and STS1 < 13.672 (n = 35; 12 and 3 events for FFS and OS, respectively). FFS (C) and OS (D) for patients with Ridge-based signature STS0 ≥ 2.932 (n = 201; 88 and 43 events for FFS and OS, respectively) and STS0 < 2.932 (n = 36; 8 and 1 event for FFS and OS, respectively). Thirty-seven patients with missing clinical follow-up were excluded.
Prognostic relevance of correct GE-classification in the cohort of localized-stage FL. Kaplan-Meier plots with log-rank P values for FFS for patients with a GE signature of advanced-stage FL (III/IV) identified by the Lasso model (A) and Ridge regression (B) in 88 patients from the localized-stage FL (I/II) cohort with clinical data. (A) FFS for patients with Lasso-based signature STS1 ≥ 13.672 (n = 85; 39 events) and STS1 < 13.672 (n = 3; 3 events) (B) FFS for patients with Ridge-based signature STS0 ≥ 2.932 (n = 85; 39 events) and STS0 < 2.932 (n = 3;3 events). There were too few events for an OS evaluation.
Prognostic relevance of correct GE-classification in the cohort of localized-stage FL. Kaplan-Meier plots with log-rank P values for FFS for patients with a GE signature of advanced-stage FL (III/IV) identified by the Lasso model (A) and Ridge regression (B) in 88 patients from the localized-stage FL (I/II) cohort with clinical data. (A) FFS for patients with Lasso-based signature STS1 ≥ 13.672 (n = 85; 39 events) and STS1 < 13.672 (n = 3; 3 events) (B) FFS for patients with Ridge-based signature STS0 ≥ 2.932 (n = 85; 39 events) and STS0 < 2.932 (n = 3;3 events). There were too few events for an OS evaluation.
Discussion
GE profiling of tumor samples has led to a tremendous increase in our understanding of the basic principles of cancer pathogenesis; moreover, it also facilitates the recognition of tumor subtypes and the risk stratification of patients.21,22 With the introduction of digital GE platforms (eg, NanoString technology), based on the multiplexed measurement of GE with small color-coded probe sets, FFPE tissue samples are now reliably accessible to GE analysis.23-25
Our knowledge obtained from GE profiling in FL is not very homogeneous. In the landmark study by Dave et al, analysis of GE in FL was used to establish a prognostic model at the time of diagnosis.5 Using Affymetrix-based GE profiling of fresh-frozen FL samples, 2 IR signatures (IR-1 and IR-2) were identified. Expression of IR-1 was associated with a more favorable prognosis, whereas expression of IR-2 indicated an inferior outcome. Until now, these IR signatures had not been validated in independent patient cohorts, although efforts have been undertaken to transfer the prognostic information of the signatures to targeted approaches using reverse-transcription polymerase chain reaction or immunohistochemistry. However, the resulting data were quite controversial and, importantly, could not be validated in the R era.8,9,26,27 The major limitations of these studies apparently were small patient cohorts and that the patients were not uniformly treated. Other studies were hampered by the limited availability of clinical follow-up. In addition, it has now become clear that different treatment protocols target the tumor cells and/or the microenvironment to different degrees.28 The microenvironment, especially, is of major importance for the survival of tumor cells.29 In an effort to avoid these shortcomings, all samples analyzed within the present study (N = 666) were from patients treated within clinical trials of the GLSG.18-20 For data analysis, patient samples were subgrouped according to treatment to achieve uniform treatment conditions in the training and validation cohorts, as well as to avoid overfitting. Because only FFPE-derived tumor samples were available in the present study, GE profiling was performed using NanoString technology. In the current approach, we determined the expression of 184 genes related to prognosis and/or pathogenesis of FL, also including IR-1 and IR-2 signature genes.5 The prognostic significance of the IR signatures and the sum score could not be ascertained in the advanced-stage FL cohorts. Likewise, with our model-development strategy, including global tests and univariate and multivariate penalized Cox regression, it was not possible to build a GE-based prognostic model using these 184 genes tested in the training cohort of CHOP/MCP-treated patients. However, our results do not preclude that a prognostic model for R-CHOP–treated patients could be derived. With longer follow-up and a larger number of events, we might be able to investigate this question in a future study. A recently published study by Huet et al also failed to validate the negative prognostic impact of the IR-2 signature in a patient cohort from prospective clinical trials.30 Nonetheless, in their study, using global GE profiling, they were able to construct a signature of 23 genes that robustly predicted progression-free survival in advanced-stage FL independent of the FLIPI score. They also identified an independent gene signature (ICA13) that was strongly correlated with dismal outcome; it contained 19 genes, 9 of which were also part of the 23-gene signature.30 In our study, none of the genes, nor the entire group of genes tested, seemed to reflect biological features that vary with clinical outcome. However, it should be kept in mind that the expression of only 184 genes was analyzed in-depth; therefore, our gene set did not represent the entire genetic backbone of advanced-stage FL. Furthermore, only 1 of the genes analyzed within the present study was also part of the 23-gene or the ICA13 predictor. Consequently, rebuilding of the 23-gene predictor of Huet et al was not possible. An interesting point with serious impact on the IR signature data is the quality of the Affymetrix probes that had been used to establish the IR signatures in Dave et al’s Lymphoma/Leukemia Molecular Profiling Project study.5 Following the publication of the probe set gene sequences by Affymetrix in 2003, several publications have clearly shown that many probes included in the gene chip indeed did not bind to their assigned transcript and, therefore, were prone to mismatch hybridization.31-34 We checked the Affymetrix probe sets of 61 IR signature genes from the study by Dave et al5 in the present work (data not shown) and found that as many as 11 of 61 (18%) failed to target their respective gene segment but were located in the intronic gene region. With this knowledge, a diligent check of the probe sets is highly recommended with the use of Affymetrix chips.35 In addition to this technical aspect, the study cohort in the Dave et al5 dataset was highly heterogeneous with respect to stage and treatment modalities, including different chemotherapy and/or radiotherapy protocols or even no therapy administered at all. In particular, the clinical stage of the patient cohort had not been clearly documented.5 In contrast, the cohorts investigated in the present study were part of prospective clinical trials of the GLSG; the training cohort was treated with MCP/CHOP, and the validation cohort received R-CHOP.
Although the genetic background of typical systemic FL has been unraveled to a substantial degree, comparatively little is known about the genetic landscape of nodal localized-stage (I/II) tumors that make up ∼20% of newly diagnosed FL. More recent data have suggested biological differences between localized and systemic FL, reporting the occurrence of the translocation t(14;18) in ∼85% of cases of advanced-stage FL but in only ∼50% of cases of localized-stage FL.13 In a similar fashion, pediatric-type FLs are characterized by limited-stage presentation and, by definition, an absence of the BCL2 rearrangement.36 Furthermore, preliminary data indicate that the cytological composition of the microenvironment in limited-stage disease is different from that of advanced-stage FL.8,37 Therefore, it can be debated whether localized-stage FL should be considered a separate disease. Although recent data suggest a hierarchical model for the evolution of FL, with in situ follicular neoplasia and partial involvement-FL representing the earliest and early disease stages of overt FL (for a review see Huet et al38 ), the assignment of localized-stage FL in this ontogenetic model remains to be determined. Therefore, it was highly interesting to perform GE profiling in a large FL study cohort consisting of advanced-stage FL and localized-stage FL, especially considering the fact that the numbers of follicular helper T cells and regulatory T cells differ; advanced-stage FL harbors a higher proportion of regulatory T cells and a decreased number of follicular helper T cells.37 In a similar fashion, Alvaro et al noticed different amounts of CD68+ macrophages in limited-stage and advanced-stage FL,8 thus suggesting a possible interdependence between tumor–host interaction and the clinical stage. On the basis of GE profiling, we were able to show, for the first time to our knowledge, that localized-stage FL can be distinguished from advanced-stage FL. In univariate analysis, the expression of 12 genes differed significantly between the groups. Although the expression of 10 genes (BIN2, TNFRSF13B, CD69, SLP1, C9ORF52, TNFSRF25, STAT4, IL7R, LEF1, GZMB) was significantly enhanced in localized-stage FL, C4A and BCL2 were overexpressed in advanced-stage FL, with the latter finding obviously reflecting the higher frequency of t(14;18) in advanced-stage FL.13 For the first time, to the best of our knowledge, our data provide insights into the expression of a large number of immune-regulative genes in localized- and advanced-stage FL; they emphasize the interplay of T cells and tumor cells (as reported previously8,37 ), as well as provide evidence for further interactions between FL cells and nonmalignant bystander cells, which have different proportions, in localized-stage and advanced-stage FLs.
Applying a penalized-regression model, 20 of 269 (7%) and 36 of 237 (15%) cases of advanced-stage FL in the training and independent cohorts, respectively, of patients treated with immunochemotherapy (R-CHOP) were identified as harboring a GE profile corresponding to localized-stage FL. On the other hand, when applying the GE classifier to localized-stage FL, 3 of 88 (3%) tumors harbored a GE profile that was more similar to that of advanced-stage FL. Intriguingly, advanced-stage FL patients with a GE profile of localized-stage FL (“localized-stage signature”) had a superior clinical course compared with those having a GE profile of advanced-stage FL. Moreover, the clinical outcome of localized-stage FL with a GE profile similar to that of advanced-stage FL (“advanced-stage signature”) was worse compared with a GE profile of localized-stage FL. These observations are consistent with the known prognostic impact of stage in FL.3 Of importance, although the gene signatures of localized- and advanced-stage FL were highly discriminative and differed significantly from each other, they were independent of the t(14;18) status.
The main clinical need to differentiate between localized-stage and advanced-stage disease in FL is the potential curability of the former with radiotherapy, whereas advanced-stage FL is considered an incurable disease with conventional therapy. With the development of a robust classifier that, upon further validation, allows for the categorization of advanced-stage and localized-stage FL by GE, our results suggest that the underlying genetic signature may contribute to the outcome of FL patients, next to its implication in the biological categorization of disease. However, these signatures are primarily aimed at stage identification not risk stratification. Therefore, future therapeutic algorithms may also differ in early- and advanced-stage FLs because of different genetic features. Clearly, however, individualized therapeutic concepts need to be validated in a prospective manner.
The publication costs of this article were defrayed in part by page charge payment. Therefore, and solely to indicate this fact, this article is hereby marked “advertisement” in accordance with 18 USC section 1734.
For original data, please contact german.ott@rbk.de.
The online version of this article contains a data supplement.
Acknowledgments
The authors thank Katja Bräutigam and Petra Hitschke (Stuttgart) and Theodora Nedeva (Würzburg) for excellent technical assistance.
This work was supported by the German José Carreras Leukämie-Stiftung (DJCLS R 10/28) and the Robert Bosch-Stiftung (project O3) (Stuttgart, Germany).
Authorship
Contribution: A.M.S., A.R., G.O., and H.H. designed research and wrote the manuscript; A.M.S, E.L., C.K., and H.H. performed experiments; A.M.S., E.H., V.J., S.W., E.L., and H.H. analyzed results and produced the figures; P.M., H.-W.B., A.C.F., W.K., K.K., H.S., M.-L.H., S.H., and O.W. provided material; and M.D., W.H., K.H., and M.E. conducted clinical trials for GLSG.
Conflict-of-interest disclosure: The authors declare no competing financial interests.
A complete list of the members of the German Low Grade Lymphoma Study Group (GLSG) and their associated study centers appears in the supplemental appendix.
Correspondence: German Ott, Department of Clinical Pathology, Robert Bosch Hospital, Auerbachstr 110, 70376 Stuttgart, Germany; e-mail: german.ott@rbk.de.

This feature is available to Subscribers Only
Sign In or Create an Account Close Modal