

Key Points
Defective maturation of NK effector cells leads to accumulation of less cytotoxic hyperactivated cytokine-producing NK cells in patients with B/T-ALL.
Increased frequency of activated cytokine-producing NK cells independently predicts poor clinical outcome in patients with ALL.

Abstract
B- and T-cell acute lymphoblastic leukemia (B/T-ALL) may be refractory or recur after therapy by suppressing host anticancer immune surveillance mediated specifically by natural killer (NK) cells. We delineated the phenotypic and functional defects in NK cells from high-risk patients with B/T-ALL using mass cytometry, flow cytometry, and in silico cytometry, with the goal of further elucidating the role of NK cells in sustaining acute lymphoblastic leukemia (ALL) regression. We found that, compared with their normal counterparts, NK cells from patients with B/T-ALL are less cytotoxic but exhibit an activated signature that is characterized by high CD56, high CD69, production of activated NK cell–origin cytokines, and calcium (Ca2+) signaling. We demonstrated that defective maturation of NK cells into cytotoxic effectors prevents NK cells from ALL from lysing NK cell–sensitive targets as efficiently as do normal NK cells. Additionally, we showed that NK cells in ALL are exhausted, which is likely caused by their chronic activation. We found that increased frequencies of activated cytokine-producing NK cells are associated with increased disease severity and independently predict poor clinical outcome in patients with ALL. Our studies highlight the benefits of developing NK cell profiling as a diagnostic tool to predict clinical outcome in patients with ALL and underscore the clinical potential of allogeneic NK cell infusions to prevent ALL recurrence.
Introduction
B- and T-cell acute lymphoblastic leukemia (B/T-ALL) is refractory and often recurs after therapy.1-3 ALL occurs in children, in young adults between 15 and 39 years old,4 and in individuals >50 years old.5 Most acute patients with lymphoblastic leukemia (ALL) are initially treated with multiagent chemotherapy, although the recent success of antibody-based and chimeric antigen receptor (CAR) T-cell–based immunotherapies have markedly improved clinical outcomes.6-14 Despite treatment advances, because of resistance to existing therapies,15,16 the 5-year relative survival is only 68.8%.4 Hence, safe treatments to overcome therapeutic resistance remain an urgent clinical need.
Therapeutic resistance is often caused by suppression of antileukemia host immunity.17,18 Studying immune surveillance in transgenic ALL mice, we showed that specific subversion of antileukemia natural killer (NK) cell–mediated surveillance drives ALL development and recurrence.19 Our findings underscore the importance of developing the therapeutic potential of NK cells for sustained B/T-ALL regression.
As effector cytotoxic lymphocytes,20,21 NK cells are attractive immune cell–based therapy candidates.22-27 NK cells have been explored for treatment of acute myeloid leukemia and ALL even prior to CAR T cells.22,28-32 NK cells have advantages over CAR T cells. Development of allogeneic CAR T-cell immunotherapies is complex as a result of the required disruption of mechanisms that cause graft-versus-host disease in recipients.33,34 However, NK cells, being less haplotype restricted,35 can be developed as “off-the-shelf” immunotherapies.22,24,25,28,36-41 Treating T-cell ALL (T-ALL) using CAR T cells is difficult because of the reduced numbers of healthy T lymphocytes in patients and the on-target effects on normal T cells.33,34 B-cell ALL (B-ALL) may become resistant to CAR T cells by losing target antigen expression.42-45 Engineering autologous CAR T cells to treat infant B-ALL can be challenging because of difficulties associated with obtaining peripheral blood from these patients.38 Reduced cytokine release syndrome and neurotoxicity make NK cells safer than CAR T cells46,47; therefore, NK cell therapies are potentially attractive to treat ALL.
To develop NK cell–based ALL therapies, we must delineate the phenotypic and functional differences between NK cells in healthy individuals and in patients with B/T-ALL. NK cell profiling in ALL mouse models has improved our understanding of how NK cell surveillance is suppressed in ALL.19 However, differences in murine and human NK cells impede the translation of our murine findings19 to the development of NK cell therapies for patients with ALL. Therefore, in this study, we contrast NK cells from patients with B/T-ALL and healthy individuals using mass cytometry (cytometry by time of flight; CyTOF),48 flow cytometry, and in silico cytometry (CIBERSORT).49 We demonstrate that the NK cell phenotype in patinets with ALL predicts disease severity and clinical outcome. Our work lends insights into harnessing NK cells for diagnosing and treating B/T-ALL.
Methods
Patient samples
After providing consent, bone marrow mononuclear cells (BMMCs) and peripheral blood mononuclear cells (PBMCs) were collected and processed from patients with B/T-ALL and healthy donors according to Institutional Review Board policies. Healthy BMMCs were purchased from AllCells (Alameda, CA). Healthy PBMCs were isolated from buffy coats procured from Stanford Blood Center, City of Hope Michael Amini Transfusion Medicine Center, and influenza vaccine studies50 of Stanford Biobank. Deidentified B/T-ALL patient specimens were used. This study is classified as nonhuman subjects research under City of Hope IRB19373.
CyTOF
Samples were processed as previously described.51 After thawing, cells were classified as unstimulated and stimulated. After an overnight rest, stimulated cells were incubated with phorbol myristate acetate (PMA)+ionomycin; during incubation, anti-CD107a, brefeldin A, and monensin were added to all samples. Dead cells were identified using Cell-ID Cisplatin-195Pt (Fluidigm) prior to surface staining and fixed with 2% paraformaldehyde, followed by intracellular and DNA staining with Cell-ID Intercalator-Ir (Fluidigm) (antibodies are provided in supplemental Tables 2 and 3, available on the Blood Web site). Prior to acquisition (CyTOF Helios; Fluidigm), cells were washed with Milli-Q water and resuspended in a 1× solution of EQ Four Element Calibration Beads (Fluidigm). Data were normalized using MATLAB normalizer before analyzing with Cytobank.52
NK cell isolation and cytotoxicity
CD56+ cells, enriched using REAlease CD56 MicroBeads (Miltenyi Biotec), were stained with anti-CD3, anti-CD56, and DAPI (supplemental Table 4). DAPI−CD3−CD56+ NK cells were sorted using a BD FACSAria Fusion cytometer and used for cytotoxicity assays. Targets were labeled with 2.5 μM carboxyfluorescein succinimidyl ester–violet dye (CellTrace Violet Cell Proliferation Kit; Invitrogen) and cocultured with NK cells at an effector-to-target ratio of 10:1 in complete RPMI medium (10% fetal bovine serum, 100 U/mL penicillin, 100 μg/mL streptomycin). After 5 hours, cells were stained with 7-aminoactinomycin D (7-AAD) and NK cell–mediated cytotoxicity was measured on a BD Fortessa X20 cytometer. Data were analyzed using FlowJo 10.7.1. Specific cytotoxicity = ([7-AAD+ target cell frequency in coculture with effector cells − 7-AAD+ target cell frequency alone]/[100 − 7-AAD+ target cell frequency alone]) × 100.
Flow cytometry
PBMCs were thawed in complete RPMI medium containing Pierce Universal Nuclease (25 U/mL; ThermoFisher Scientific) and stained with fluorochrome-tagged surface antibodies (supplemental Table 4) and Ghost Dye UV 450 for 30 minutes on ice. Cells were fixed with 1% paraformaldehyde (BioLegend), followed by acquisition on a BD FACSymphony flow cytometer. FCS files were analyzed using FlowJo 10.7.1. Supplemental Table 5 shows analyzed NK cell numbers per patient.
Calcium mobilization
Samples wer e stained with anti-CD45, anti-CD3, and anti-CD56 antibodies (supplemental Table 4). Cells were resuspended in RPMI 1640 medium containing 2% fetal bovine serum and stained with Indo-1/AM (1.5 μM; ThermoFisher Scientific), a UV light–excitable radiometric Ca2+ indicator, for 30 minutes at 37°C. Cells were stained with 7-AAD and equilibrated at 37°C for 10 minutes for hydrolysis of AM moieties of Indo-AM dye. Ca2+ flux was measured on a BD Fortessa-X20. Baseline Indo-1 fluorescence was measured for 22 seconds, followed by ionomycin treatment (1 μg/mL); measurement was continued for 3 to 4 minutes. Ratios of fluorescence detected at 405/20 BandPass (Ca2+bound) to 515/20 BandPass (Ca2+-free) channels over time were calculated using derived parameters in FlowJo 10.7.1, followed by normalization of fluorescence kinetics with baseline fluorescence ratio. Area under the curve was calculated using GraphPad.
CIBERSORT
CIBERSORT was carried out using https://cibersort.stanford.edu.49 LM22 reference was used to estimate resting and activated NK cell frequencies within total NK cells. To estimate NK cell frequencies with CD56bright and CD56dim molecular signatures by CIBERSORT, we used GSE2177453,54 to construct reference and phenotype classes files.
Visualization of differentially regulated genes
Relative signal intensities for each probeset/gene were calculated by log transforming the data and centering them on the average value calculated for each gene across the immune cell types, using Gene Cluster 3.0, and then visualizing the data as heat maps in TreeView.
Gene set enrichment analysis
Genes were ranked by maximum enrichment scores to identify significantly differentially regulated gene expression signatures between 100% resting and 100% activated NK cell groups from the hallmark gene sets provided in the molecular signatures database from Broad Institute.55-57
Statistics and reproducibility
Exact P values are provided; they are considered significant (P < .05) or trending toward significance (.05 < P < .1). Survival was estimated by the Kaplan-Meier method. The P values were calculated using the log-rank test for survival, the Bonferroni method for survival analyses with multiple comparisons, gene set enrichment analyses55-57 for pathway analysis, and the Mann-Whitney U test for all other analyses. Sample size was calculated using the “cpower” function in the R package. Reproducibility in CyTOF was ensured by using ≥8 independent biological samples per group for the ALL cohort and ≥4 samples for the healthy controls.
Results
NK cell frequency and cytotoxicity are reduced in patients with B/T-ALL
To understand the mechanisms underlying the suppression of NK cell surveillance in human ALL, using CyTOF,48 we immunophenotyped NK cells in BMMCs and PBMCs from 13 B-ALL and 7 patients with T-ALL (supplemental Table 1), as well as in 22 tissue-matched samples (BMMCs or PBMCs) from healthy donors. We selected patients with ALL for whom therapies targeting the driver oncogene are unavailable, including those driven by rearrangements of KMT2A (5/20), CRLF2 (4/20), MYC (2/20), NOTCH1 point mutations (4/20), and CDKN2A deletions (1/20) (supplemental Table 1).
We first compared the frequencies of CD56+ NK cells between patients with B/T-ALL and healthy donors after gating out CD14+ and/or CD33+ myeloid cells, CD3+ T/NK T cells, and CD19+ and/or CD20+ B cells (supplemental Figure 1). Consistent with reduced NK cell numbers that we reported previously in murine ALL,19 NK cell frequencies were significantly reduced within the nonmalignant immune fraction of patients with ALL compared with healthy donors (Figure 1A-B). An absence of differences in NK cell viability and proliferation between patients and healthy donors (supplemental Figure 2A-F) suggested that NK cell frequencies in B/T-ALL are likely reduced by other mechanisms.
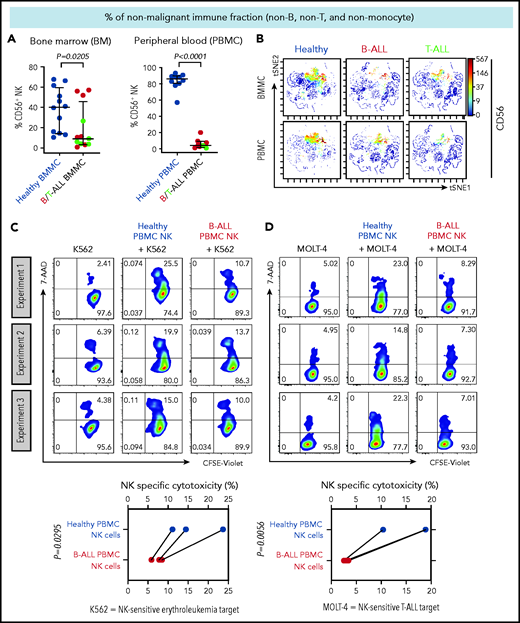
NK cell frequency and cytotoxicity are reduced in high-risk B/T-ALL patients. (A) CyTOF analysis depicting frequencies of total CD56+ HLA-DR− NK cells (after gating out CD14+ and/or CD33+ monocytes, and then CD3+ T cells, and then CD19+ and/or CD20+ B cells, referred to as nonmonocyte non-T non-B gate) in BMMCs and PBMCs of patients with B/T-ALL (n = 12 BMMC; n = 8 PBMC) and healthy donors (n = 12 BMMC; n = 10 PBMC). Data are median ± interquartile range. (B) Representative viSNE plots showing surface CD56 expression in the non–T-cell, non–B-cell, nonmonocyte, HLA-DR− population in BMMCs and PBMCs from healthy donors and patients with B/T-ALL. The color scale represents the intensity of CD56 expression on each cell. Flow cytometry density plots and comparison of NK cell–specific cytotoxicity of sorted CD3−CD56+ NK effector cells from PBMCs of healthy donors (n = 3) and patients with B-ALL (n = 3) after coculture with the commonly used K562 erythroleukemia NK cell–sensitive target for measuring NK cell function (C) or NK cell–sensitive MOLT-4 T-ALL target cells (D) for 5 hours at an effector-to-target ratio of 10:1. Data are shown from 3 independent experiments; each experiment was conducted using the same number of NK cells sorted from 1 patients with B-ALL and 1 healthy donor. Each experimental pair is connected by a line. The exact P value was calculated using the paired Student t test.
NK cell frequency and cytotoxicity are reduced in high-risk B/T-ALL patients. (A) CyTOF analysis depicting frequencies of total CD56+ HLA-DR− NK cells (after gating out CD14+ and/or CD33+ monocytes, and then CD3+ T cells, and then CD19+ and/or CD20+ B cells, referred to as nonmonocyte non-T non-B gate) in BMMCs and PBMCs of patients with B/T-ALL (n = 12 BMMC; n = 8 PBMC) and healthy donors (n = 12 BMMC; n = 10 PBMC). Data are median ± interquartile range. (B) Representative viSNE plots showing surface CD56 expression in the non–T-cell, non–B-cell, nonmonocyte, HLA-DR− population in BMMCs and PBMCs from healthy donors and patients with B/T-ALL. The color scale represents the intensity of CD56 expression on each cell. Flow cytometry density plots and comparison of NK cell–specific cytotoxicity of sorted CD3−CD56+ NK effector cells from PBMCs of healthy donors (n = 3) and patients with B-ALL (n = 3) after coculture with the commonly used K562 erythroleukemia NK cell–sensitive target for measuring NK cell function (C) or NK cell–sensitive MOLT-4 T-ALL target cells (D) for 5 hours at an effector-to-target ratio of 10:1. Data are shown from 3 independent experiments; each experiment was conducted using the same number of NK cells sorted from 1 patients with B-ALL and 1 healthy donor. Each experimental pair is connected by a line. The exact P value was calculated using the paired Student t test.
We then examined whether the cytotoxicity of residual NK cells is impaired in ALL patients by comparing the abilities of sorted PBMC NK cells (supplemental Figure 3) from B-ALL patients and healthy donors to lyse allogeneic NK cell–sensitive erythroleukemia and T-ALL targets in vitro. ALL NK cells exhibited a significantly lower specific cytotoxicity toward leukemia targets compared with healthy donor NK cells (Figure 1C-D). Therefore, reduced NK cells and suppressed NK cell cytotoxicity block NK cell surveillance in ALL patients.
NK cells with a less cytotoxic CD56bright molecular signature are expanded in B/T-ALL
Reduced cytotoxicity of ALL NK cells suggests that production of cytolytic NK effectorcells is perturbed in ALL patients. Human NK cells mature from a less cytotoxic CD56brightCD16− stage to a highly cytotoxic CD56dimCD16+ stage.58-62 Therefore, we postulated that frequencies of CD56bright and CD56dim NK cells are perturbed in ALL.
Using CIBERSORT, we compared the relative frequencies of NK cells with CD56bright and CD56dim molecular signatures (GSE21774;53 supplemental Figure 4) from 94 healthy donors (GSE65136,49 GSE1315963), 207 B-ALL patients from the P9906 Children’s Oncology Group (COG) clinical trial (GSE1187764-66), and 576 patients with B-ALL and 174 T-ALL patients from the Microarray Innovations in Leukemia (MILE; GSE1315963,67) banking study (Figure 2A). Transcriptomes of patient samples from COG and MILE were measured at diagnosis (pretreatment). Concordant with reduced NK cell cytotoxicity in ALL, we found that the frequencies of NK cells with a CD56bright molecular signature were increased, whereas those with a CD56dim signature were decreased, in B/T-ALL (Figure 2B). Of note, we chose CIBERSORT49 over methods like xCell,68 because estimating relative frequencies of CD56bright and CD56dim NK cell fractions within total NK cells was not possible with xCell.69
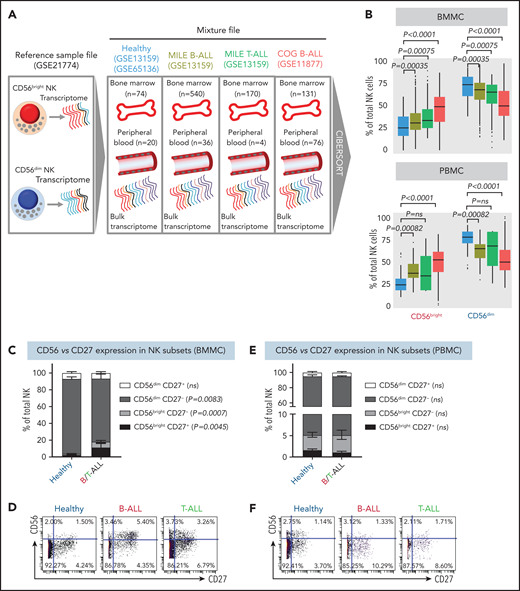
NK cells with a less cytotoxic CD56bright molecular signature are expanded in B/T-ALL. (A) Schematic diagram depicting the steps to estimate the relative proportions of CD56bright NK cells and CD56dim NK cells in healthy donors (GSE13159, GSE65136), in patients with B/T-ALL from the MILE study (GSE13159), and in patients with B-ALL from the COG P9906 clinical trial (GSE11877) using CIBERSORT. Using GSE21774, which contains the transcriptomic profile of CD56bright and CD56dim NK cell subsets as the reference file, we deconvoluted the bulk transcriptomic profiles of healthy donors, MILE patients with B/T-ALL, and COG P9906 patients with B-ALL. (B) Comparison of CD56bright NK cell and CD56dim NK cell frequencies in BMMCs from healthy donors (blue; n = 74), MILE patients with B-ALL (olive; n = 540), MILE patients with T-ALL (green; n = 170), and B-ALL COG P9906 patients (red; n = 131) (upper panel) and in PBMCs from healthy donors (blue; n = 20), MILE patients with B-ALL (olive; n = 36), T-ALL MILE patients (green; n = 4), and B-ALL COG P9906 patients (red; n = 76) (lower panel). Data are median ± interquartile range. Frequencies (C) and representative dot plots (D) of CD56brightCD27+, CD56brightCD27−, CD56dimCD27+, and CD56dimCD27− NK cell subsets defined by CyTOF analysis of BMMCs from healthy donors (n = 12) and B/T-ALL patients (n = 12). Frequencies (E) and representative dot plots (F) of CD56brightCD27+, CD56brightCD27−, CD56dimCD27+, and CD56dimCD27− NK cell subsets defined by CyTOF analysis of PBMCs from healthy donors (n = 10) and patients with B/T-ALL (n = 8). Data are mean ± standard error of the mean for each subset. Exact P values were calculated using the Mann-Whitney U test. ns, nonsignificant.
NK cells with a less cytotoxic CD56bright molecular signature are expanded in B/T-ALL. (A) Schematic diagram depicting the steps to estimate the relative proportions of CD56bright NK cells and CD56dim NK cells in healthy donors (GSE13159, GSE65136), in patients with B/T-ALL from the MILE study (GSE13159), and in patients with B-ALL from the COG P9906 clinical trial (GSE11877) using CIBERSORT. Using GSE21774, which contains the transcriptomic profile of CD56bright and CD56dim NK cell subsets as the reference file, we deconvoluted the bulk transcriptomic profiles of healthy donors, MILE patients with B/T-ALL, and COG P9906 patients with B-ALL. (B) Comparison of CD56bright NK cell and CD56dim NK cell frequencies in BMMCs from healthy donors (blue; n = 74), MILE patients with B-ALL (olive; n = 540), MILE patients with T-ALL (green; n = 170), and B-ALL COG P9906 patients (red; n = 131) (upper panel) and in PBMCs from healthy donors (blue; n = 20), MILE patients with B-ALL (olive; n = 36), T-ALL MILE patients (green; n = 4), and B-ALL COG P9906 patients (red; n = 76) (lower panel). Data are median ± interquartile range. Frequencies (C) and representative dot plots (D) of CD56brightCD27+, CD56brightCD27−, CD56dimCD27+, and CD56dimCD27− NK cell subsets defined by CyTOF analysis of BMMCs from healthy donors (n = 12) and B/T-ALL patients (n = 12). Frequencies (E) and representative dot plots (F) of CD56brightCD27+, CD56brightCD27−, CD56dimCD27+, and CD56dimCD27− NK cell subsets defined by CyTOF analysis of PBMCs from healthy donors (n = 10) and patients with B/T-ALL (n = 8). Data are mean ± standard error of the mean for each subset. Exact P values were calculated using the Mann-Whitney U test. ns, nonsignificant.
Consistent with CIBERSORT, we observed a significant increase in the CD56bright NK cell fraction in BMMCs from patients with B/T-ALL using CyTOF (supplemental Figure 5A-B). Surprisingly, CD56bright and CD56dim NK cell frequencies were unchanged in PBMCs from B/T-ALL patients compared with healthy donors (supplemental Figure 5C-D), although CIBERSORT showed that cells with a CD56bright NK cell transcriptome were enriched in ALL (Figure 2B). Although CIBERSORT considers a comprehensive molecular signature for the CD56bright and CD56dim NK cell fractions (supplemental Figure 4), CyTOF discriminates between CD56bright and CD56dim subsets based on CD56 expression, which could explain the discrepancy between the 2 methods. We infer that ALL NK cells, irrespective of their surface CD56 expression, have the molecular makeup of less mature and less cytotoxic CD56bright NK cells. Proliferation and viability of CD56bright and CD56dim NK cell subsets are unaffected in ALL (supplemental Figure 2A-F). Hence, their perturbed turnover does not lead to the expansion of NK cells with the CD56bright molecular phenotype in ALL patients.
Next, we examined coexpression of CD27 and CD56. The majority of CD56bright NK cells are CD27+, and differentiation into CD56dim cytotoxic effectors results in CD27 loss.70,71 We found a significant increase in the least cytotoxic CD56brightCD27+ NK cell fraction and a concomitant decrease in the cytotoxic CD56dimCD27− NK cell subset in BMMCs, but not in PBMCs, from patients (Figure 2C-F).
Less cytolytic CD56brightCD27+ NK cells express more natural cytotoxicity receptor NKp46 than do their CD56dimCD27− counterparts.59 Comparing the expression of NKp46 in patient and healthy donor NK cells, we observed significantly increased CD27+NKp46+ NK cell frequencies in BMMCs from ALL patients compared with healthy donors, whereas no differences were observed in PBMCs (supplemental Figure 6A-D). Low expression of NK cell maturation marker CD5771 confirmed that CD27+NKp46+ NK cells were immature (supplemental Figure 6E-F).
The increase in immature CD56brightCD27+ and CD27+NKp46+ NK cells in BMMCs corroborated the expansion of less cytotoxic CD56bright NK cells in BMMCs from ALL patients (Figure 2C-D; supplemental Figures 5A-B, 6A,C). For PBMCs, despite no perturbations in CD56, CD27, or NKp46 in ALL NK cells (Figure 2E-F; supplemental Figures 5C-D and 6B,D), we observed that NK cell cytotoxicity was reduced, and NK cells with a CD56bright transcriptome were enriched (Figures 1C-D, 2B). Therefore, we infer that NK cells in PBMCs from patients with ALL exhibit CD56bright-like characteristics.
Maturation of NK cells into cytotoxic effectors is perturbed in PBMCs from patients with B/T-ALL
To determine why NK cells in PBMCs from patients with ALL are less cytotoxic, despite the absence of perturbations in CD56 and CD27, we further characterized the CD56bright to CD56dim NK cell transition by comparing CD94, KIR2DL1, NKG2A, and CD62L on PBMC NK cells from 9 healthy donors and 9 patients with ALL using flow cytometry (supplemental Figure 7).
CD94 is reduced in a stepwise fashion as NK cells differentiate from CD56bright to CD56dim stages: less cytotoxic CD56brightCD94High cells transition into a more cytotoxic CD56dimCD94High intermediary before finally maturing into the most cytotoxic CD56dimCD94Low subset.72 We observed significantly decreased frequencies of the most cytotoxic CD56dimCD94Low subset in B/T-ALL patients (Figure 3A-B). The inhibitory receptor KIR2DL1, which is expressed more by CD56dim NK cells than by CD56bright NK cells,59 was also reduced in total and CD56dim ALL NK cells (Figure 3C-D). No differences were observed for NKG2A and CD62L between ALL and healthy PBMCs (data not shown).
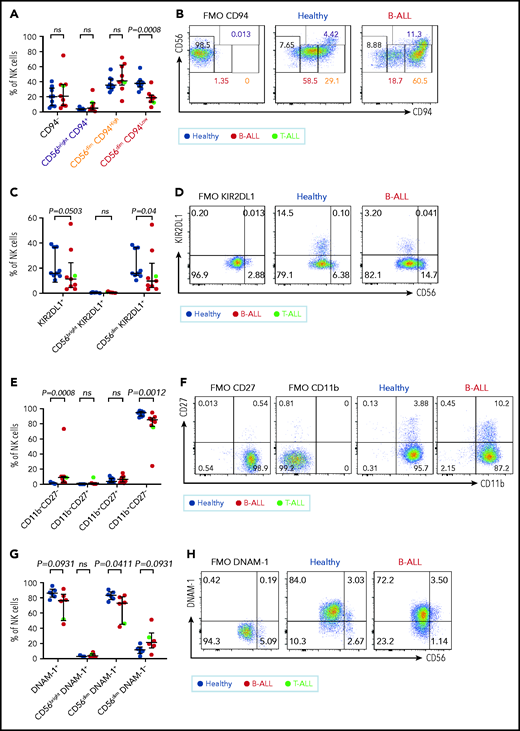
Maturation of NK cells into cytotoxic effectors is perturbed in PBMCs from patients with B/T-ALL. Flow cytometry analysis of NK cells showing the percentages of CD94−, CD56brightCD94+, CD56dimCD94High, and CD56dimCD94Low NK cells (A-B), KIR2DL1+ total NK cells and CD56brightKIR2DL1+ and CD56dimKIR2DL1+ NK cells (C-D), CD11b−CD27−, CD11b−CD27+, CD11b+CD27+, and CD11b+CD27− NK cells (E-F) in PBMCs from healthy donors (n = 9) and B/T-ALL patients (n = 9). (G-H) Flow cytometry analysis of NK cells showing the percentages of DNAM-1+ total NK cells and CD56brightDNAM-1+, CD56dimDNAM-1+, and CD56dimDNAM-1−NK cells in PBMCs from healthy donors (n = 6) and B/T-ALL patients (n = 6). Graphs show median ± interquartile range. Gates for each marker were set using fluorescence − 1 (FMO) controls. Exact P values were calculated using the Mann-Whitney U test. ns, nonsignificant.
Maturation of NK cells into cytotoxic effectors is perturbed in PBMCs from patients with B/T-ALL. Flow cytometry analysis of NK cells showing the percentages of CD94−, CD56brightCD94+, CD56dimCD94High, and CD56dimCD94Low NK cells (A-B), KIR2DL1+ total NK cells and CD56brightKIR2DL1+ and CD56dimKIR2DL1+ NK cells (C-D), CD11b−CD27−, CD11b−CD27+, CD11b+CD27+, and CD11b+CD27− NK cells (E-F) in PBMCs from healthy donors (n = 9) and B/T-ALL patients (n = 9). (G-H) Flow cytometry analysis of NK cells showing the percentages of DNAM-1+ total NK cells and CD56brightDNAM-1+, CD56dimDNAM-1+, and CD56dimDNAM-1−NK cells in PBMCs from healthy donors (n = 6) and B/T-ALL patients (n = 6). Graphs show median ± interquartile range. Gates for each marker were set using fluorescence − 1 (FMO) controls. Exact P values were calculated using the Mann-Whitney U test. ns, nonsignificant.
Our data suggested that the pathway producing cytotoxic NK effectorcells is perturbed in ALL. NK effector maturation is a 4-stage process with progressive acquisition of cytotoxicity: CD11b−CD27− double negative → CD11b−CD27+ single positive (SP) → CD11b+CD27+ double positive → CD11b+CD27− SP.73 We observed significantly increased frequencies of immature and least cytotoxic CD11b−CD27− double-negative NK cells and reduced frequencies of cytotoxic CD11b+CD27− SP NK effector cells (Figure 3E-F). The CD11b+CD27− fraction resembles the CD56dim NK cell subset, whereas the other fractions resemble CD56bright NK cells,73 further supporting our observations that NK cells with the CD56bright molecular phenotype are enriched in ALL patients.
Finally, comparing the expression of the cytotoxicity-inducing activating receptor DNAM-1 in ALL patients and healthy donors,74 we observed a trend toward reduced DNAM-1+ total NK cells, significantly reduced frequencies of the most cytotoxic CD56dimDNAM1+ NK cells, and a trend toward an increased CD56dimDNAM-1− less cytotoxic fraction in patients compared with healthy donors (Figure 3G-H). Because CD56dimDNAM-1+ NK cells are the most cytotoxic NK cell fraction,74,75 our findings demonstrate defective NK cell maturation in patients with ALL.
We conclude that perturbations in NK effector maturation from the CD56bright to the CD56dim NK subset result in accumulation of dysfunctional NK cells in patients with B/T-ALL.
Stimulated ALL NK cells produce more cytokines than their healthy counterparts
CD56bright NK cells, when stimulated with PMA+ionomycin or monokines, express higher levels of the cytokines interferon-γ (IFN-γ), tumor necrosis factor (TNF), and granulocyte macrophage colony-stimulating factor (GM-CSF) than do their CD56dim counterparts.60,76 Because CD56bright-like NK cells are increased in B/T-ALL (Figures 2 and 3; supplemental Figures 5 and 6), we predicted that stimulated ALL NK cells will produce more cytokines than their normal counterparts. Therefore, we compared frequencies of PMA+ionomycin-stimulated NK cell subsets expressing intracellular cytokines in B/T-ALL patients and healthy controls. We found increases in the frequencies of GM-CSF+ and TNF-α+ NK cells in BMMCs and PBMCs from B/T-ALL patients compared with healthy donors. IFN-γ+ NK cells were significantly increased in PBMCs, but were unchanged in BMMCs, from patients with B/T-ALL compared with healthy individuals (Figure 4). We found significant increases in MIP-1β+ and interleukin-2 (IL-2)+ cells within the CD56bright NK cell fraction of PBMCs and BMMCs, respectively, in patients with ALL (supplemental Figure 8). Hence, stimulated ALL NK cells produce more cytokines than do their healthy counterparts, further corroborating the expansion of immature, cytokine-producing, and poorly cytotoxic CD56bright-like NK cells in ALL patients.
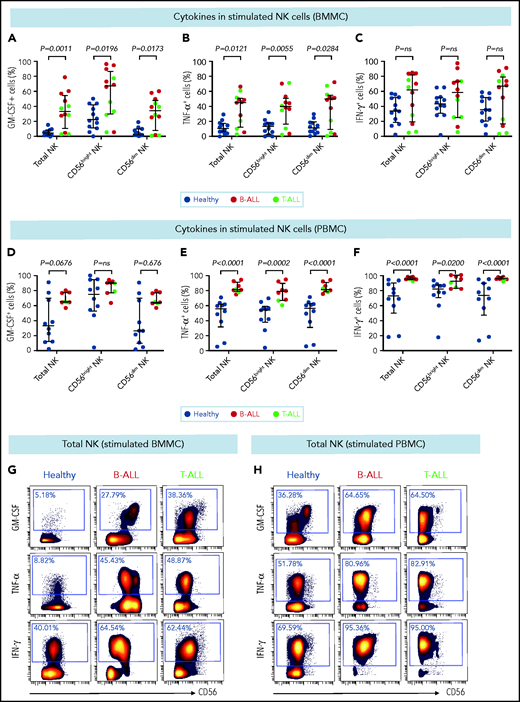
Stimulated NK cells in patients with B/T-ALL produce more cytokines than do their healthy counterparts. CyTOF analysis of the frequencies of PMA+ionomycin-stimulated NK cell subsets expressing GM-CSF (A), TNF-α (B), and IFN-γ (C) in BMMCs from healthy donors (n = 12) and patients with B/T-ALL (n = 12). CyTOF analysis of the frequencies of PMA+ionomycin-stimulated NK cell subsets expressing GM-CSF (D), TNF-α (E), and IFN-γ (F) in PBMCs from healthy donors (n = 10) and patients with B/T-ALL (n = 8). Representative dot plots showing the expression of GM-CSF, TNF-α, and IFN-γ in PMA+ionomycin-stimulated NK cells in BMMCs (G) and PBMCs (H) from ALL patients and healthy donors. Graphs show median ± interquartile range. Exact Pvalues were calculated using the Mann-Whitney U test. ns, not significant.
Stimulated NK cells in patients with B/T-ALL produce more cytokines than do their healthy counterparts. CyTOF analysis of the frequencies of PMA+ionomycin-stimulated NK cell subsets expressing GM-CSF (A), TNF-α (B), and IFN-γ (C) in BMMCs from healthy donors (n = 12) and patients with B/T-ALL (n = 12). CyTOF analysis of the frequencies of PMA+ionomycin-stimulated NK cell subsets expressing GM-CSF (D), TNF-α (E), and IFN-γ (F) in PBMCs from healthy donors (n = 10) and patients with B/T-ALL (n = 8). Representative dot plots showing the expression of GM-CSF, TNF-α, and IFN-γ in PMA+ionomycin-stimulated NK cells in BMMCs (G) and PBMCs (H) from ALL patients and healthy donors. Graphs show median ± interquartile range. Exact Pvalues were calculated using the Mann-Whitney U test. ns, not significant.
Peripheral blood ALL NK cells degranulate more than healthy NK cells
Because CD56bright NK cells express fewer cytotoxic granules (perforin [PRF], granzyme B) than do their CD56dim counterparts,77 we compared granule expression between ALL and healthy NK cells. Surprisingly, we observed a trend toward increased PRF+CD56bright NK cells in BMMCs and PRF+ total NK cells in PBMCs, as well as significant increases in the frequencies of PRF+ NK cell subsets in ALL PBMCs (supplemental Figure 9A-F).
Stimulated CD56bright NK cells degranulate more and express more CD107a than do CD56dim NK cells.76 Therefore, we compared the frequencies of CD107a+-stimulated NK cells between patients with ALL and healthy donors. Although we did not observe any significant changes in the frequencies of CD107a+ BMMC NK cells, we found a striking increase in CD107a+ cells in the stimulated PBMC NK cell fractions of patients with ALL compared with healthy donors (supplemental Figure 9G-J), corroborating the enrichment of CD56bright-like NK cells in ALL.
Hyperactivated and exhausted NK cells accumulate in peripheral blood of patients with ALL
Increased expressions of cytokines, lytic granules, and CD107a (Figure 4; supplemental Figure 9) suggest that PBMC NK cells in patients with ALL are hyperactivated. Comparing levels of the activation marker CD6978 and Ca2+ mobilization in NK cells of patients with ALL and healthy donors by flow cytometry, we observed significant increases in CD69+ cells in the total NK cell and NK cell subsets of ALL patients (Figure 5A-B) and found that ALL NK cells exhibited a higher calcium flux (Figure 5C-D). Therefore, ALL NK cells are more activated than are their healthy counterparts.

Hyperactivated and exhausted NK cells accumulate in peripheral blood of patients with ALL. Flow cytometry analysis depicting frequencies of CD69+ total NK cells and CD56brightCD69+ and CD56dimCD69+ NK cells in PBMCs from healthy donors and B-ALL and T-ALL patients (A; n = 9), as well as in healthy donors and patients with B-ALL (n = 9). (C) Comparison of Ca2+ flux in ionomycin-stimulated CD3−CD56+-gated NK cells in PBMCs from healthy donors (n = 6) and patients with B-ALL (n = 5). (D) Normalized Ca2+ flux in 1 representative sample (left panel); area under the curve is shown for 6 healthy donors and 5 patients with B-ALL (right panel). (E) Flow cytometry analysis depicting frequencies of CD69+CD94+ NK cells in PBMCs from healthy donors and B/T-ALL patients (n = 9 each). (F) CyTOF analysis of the frequencies of cells expressing LAG-3, KLRG1, PD-L2, and Siglec-7 in total NK cells and in the CD56bright and CD56dim NK cell subsets in PBMCs from healthy donors (n = 4) and patients with B/T-ALL (n = 9). (G) Representative dot plots of the expression of LAG-3, KLRG1, PD-L2, and Siglec-7 in total NK cell and NK cell subsets in PBMCs from healthy controls and patients with B-ALL and T-ALL. Data are median ± interquartile range. Exact P values were calculated using the Mann-Whitney U test.
Hyperactivated and exhausted NK cells accumulate in peripheral blood of patients with ALL. Flow cytometry analysis depicting frequencies of CD69+ total NK cells and CD56brightCD69+ and CD56dimCD69+ NK cells in PBMCs from healthy donors and B-ALL and T-ALL patients (A; n = 9), as well as in healthy donors and patients with B-ALL (n = 9). (C) Comparison of Ca2+ flux in ionomycin-stimulated CD3−CD56+-gated NK cells in PBMCs from healthy donors (n = 6) and patients with B-ALL (n = 5). (D) Normalized Ca2+ flux in 1 representative sample (left panel); area under the curve is shown for 6 healthy donors and 5 patients with B-ALL (right panel). (E) Flow cytometry analysis depicting frequencies of CD69+CD94+ NK cells in PBMCs from healthy donors and B/T-ALL patients (n = 9 each). (F) CyTOF analysis of the frequencies of cells expressing LAG-3, KLRG1, PD-L2, and Siglec-7 in total NK cells and in the CD56bright and CD56dim NK cell subsets in PBMCs from healthy donors (n = 4) and patients with B/T-ALL (n = 9). (G) Representative dot plots of the expression of LAG-3, KLRG1, PD-L2, and Siglec-7 in total NK cell and NK cell subsets in PBMCs from healthy controls and patients with B-ALL and T-ALL. Data are median ± interquartile range. Exact P values were calculated using the Mann-Whitney U test.
Despite their increased activation, PBMC ALL NK cells cannot lyse NK cell–sensitive leukemia targets. We investigated 2 mechanisms to explain the dysfunctionality of hyperactivated ALL NK cells.
First, we compared the expression of CD94 on CD69+ NK cells in patients with ALL and healthy donors, because CD94 inhibits CD69-mediated NK cell cytotoxicity,78 and CD94 is perturbed in ALL NK cells (Figure 3A-B). We observed significantly increased CD69+CD94+ NK cells in ALL patients (Figure 5E). Our observations, together with other studies showing that excessive Ca2+ signaling impedes NK cell–mediated lysis of cancers,79 explain, at least in part, why NK cells in ALL are dysfunctional, despite being highly activated.
Next, using CyTOF, we investigated whether chronic activation and impaired cytotoxicity of ALL NK cells are associated with upregulation of checkpoint markers80-82 that indicate NK cell exhaustion, including CTLA-4, PD-1, programmed death ligand 1 (PD-L1), PD-L2, lymphocyte-activation gene-3 (LAG-3), T-cell immunoglobulin and mucin domain-containing protein 3, T-cell immunoreceptor with Ig and ITIM domains, killer cell lectin like receptor G1 (KLRG1), and Ig-like transcript 2.80,82 Immune checkpoints were unaffected in BMMC NK cells, with the exception of a decrease in PD-L1 in the CD56bright subset (supplemental Figure 10). In PBMCs, we observed significantly increased LAG-3+ total NK cells and CD56dim NK cells and increased KLRG1+ and PD-L2+ CD56bright NK cells in patients with ALL (Figure 5F-G). Hence, chronic NK cell activation in ALL could lead to their exhaustion and further impair their functions.
Among other checkpoints, we found significantly reduced sialic acid-binding immunoglobulin-type lectin 7 (Siglec‐7) in total and CD56dim PBMC ALL NK cell subsets (Figure 5F-G). Reduced Siglec‐7 on NK cells is associated with the loss of NK effector functions.83-85 Siglec-7 increases during NK effector maturation, with the highest frequency of Siglec-7+ NK cells occurring in the most cytotoxic CD11b+CD27− NK cell fraction and the lowest frequency of Siglec-7+ NK cells in the least cytotoxic and most immature CD11b−CD27− subset.86 Reduced Siglec-7 in ALL NK cells validates our observations of increased frequencies of CD11b−CD27− immature NK cells and reduced frequencies of mature cytotoxic CD11b+CD27− NK cells in ALL (Figure 3E-F). Overall, we demonstrate the accumulation of dysfunctional and exhausted NK cells with an activated phenotype in B/T-ALL.
High frequencies of activated NK cells predict poor clinical prognosis in high-risk B-ALL
We investigated whether the frequencies of activated NK cells predict clinical prognosis in ALL patients. Using CIBERSORT,49 we estimated the relative frequencies of activated and resting NK cells in 207 children with B-ALL enrolled in the COG P9906 trial (GSE11877).64-66 To estimate activated and resting NK cell frequencies, we used the CIBERSORT LM22 reference file,49 which assigns pan-NK cells into resting NK cell and IL-2/IL-15–activated NK cell subsets (Figure 6A; supplemental Figure 12). We confirmed that activated and resting NK cell signatures designated in CIBERSORT include classic NK cell activation markers and that CIBERSORT is comparable to flow cytometry and CyTOF because it uses the expression of lineage markers to distinguish NK cells from other related immune subsets, including T cells (supplemental Figure 12A-B).
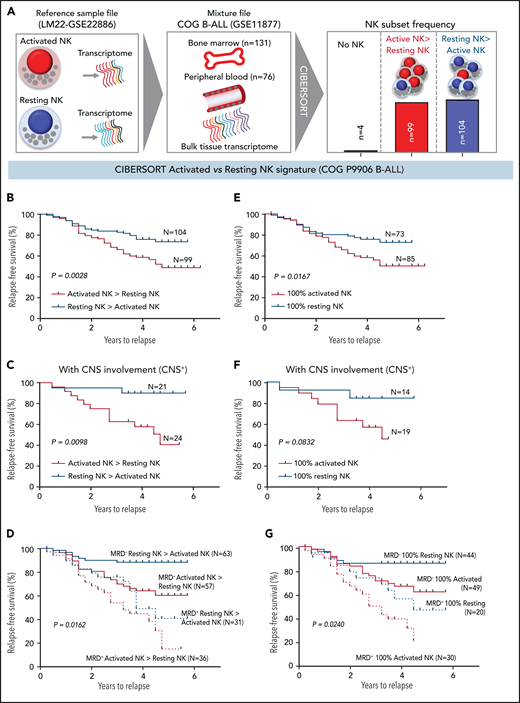
High frequencies of activated NK cells predict poor clinical prognosis in high-risk B-ALL. (A) Schematic diagram depicting the steps to estimate the relative proportions of activated and resting NK cells in patients with B-ALL from the COG P9906 clinical trial (GSE11877) using CIBERSORT. The LM22 signature matrix (GSE22886), which contains the transcriptomic profile of resting NK cells and cytokine (IL-2, IL-15)–activated NK cells, was used to deconvolute the bulk transcriptomic profiles of COG P9906 patients with B-ALL. After excluding 4 patients who lacked NK cells, the remaining patients were assigned to 2 cohorts: resting NK > activated NK (n = 104) and activated NK > resting NK (n = 99). Comparison of RFS probabilities of COG P9906 patients with B-ALL divided into resting NK > activated NK and activated NK > resting NK groups (B), resting NK > activated NK CNS+ and activated NK > resting NK CNS+ groups (C), resting NK > activated NK MRD+, activated NK > resting NK MRD+, resting NK > activated NK MRD−, and activated NK > resting NK MRD− groups (D), 100% activated NK and 100% resting NK groups (E), 100% activated NK CNS+ and 100% resting NK CNS+ groups (F), and 100% activated NK MRD+, 100% resting NK MRD+, 100% activated NK MRD−, and 100% resting NK MRD− groups (G). Survival curves were calculated using the Kaplan-Meier method. Exact P values were calculated using the log-rank test.
High frequencies of activated NK cells predict poor clinical prognosis in high-risk B-ALL. (A) Schematic diagram depicting the steps to estimate the relative proportions of activated and resting NK cells in patients with B-ALL from the COG P9906 clinical trial (GSE11877) using CIBERSORT. The LM22 signature matrix (GSE22886), which contains the transcriptomic profile of resting NK cells and cytokine (IL-2, IL-15)–activated NK cells, was used to deconvolute the bulk transcriptomic profiles of COG P9906 patients with B-ALL. After excluding 4 patients who lacked NK cells, the remaining patients were assigned to 2 cohorts: resting NK > activated NK (n = 104) and activated NK > resting NK (n = 99). Comparison of RFS probabilities of COG P9906 patients with B-ALL divided into resting NK > activated NK and activated NK > resting NK groups (B), resting NK > activated NK CNS+ and activated NK > resting NK CNS+ groups (C), resting NK > activated NK MRD+, activated NK > resting NK MRD+, resting NK > activated NK MRD−, and activated NK > resting NK MRD− groups (D), 100% activated NK and 100% resting NK groups (E), 100% activated NK CNS+ and 100% resting NK CNS+ groups (F), and 100% activated NK MRD+, 100% resting NK MRD+, 100% activated NK MRD−, and 100% resting NK MRD− groups (G). Survival curves were calculated using the Kaplan-Meier method. Exact P values were calculated using the log-rank test.
After excluding 4 patients with B-ALL with no detectable NK cells, we assigned the remaining patients to 2 groups based on their relative proportions of resting and activated cells within the total NK cell fraction as resting NK > activated NK (n = 104) and activated NK > resting NK (n = 99) and compared relapse-free survival (RFS) probabilities between these cohorts. We observed that patients who had more activated NK cells than resting NK cells had shorter RFS (Figure 6B).
Analyzing poorly prognostic B-ALL with central nervous system (CNS) involvement (CNS+, CNS2, or CNS3), we found that greater activated NK cell frequencies significantly shortened RFS (Figure 6C). We then investigated whether frequencies of activated and resting NK cells can independently predict clinical outcome in patients who are classified, based on minimal residual disease (MRD), as MRD+ or MRD− at the end of induction therapy (day 29). We observed that a higher relative proportion of activated NK cells predicts a significantly worse outcome and shortens RFS in poorly prognostic MRD+ and better prognostic MRD− patients (Figure 6D).
Comparing patients with only activated NK cells and no resting NK cells (100% activated NK, n = 85) against those with no activated NK cells and only resting NK cells (100% resting NK, n = 73), we found that patients with 100% activated NK cells had a worse prognosis than did those with 100% resting NK cells (Figure 6E). Finally, we found that the absence of activated NK cells independently predicts favorable clinical outcome in CNS+, MRD−, and MRD+ patients with B-ALL (Figure 6F-G). Therefore, enrichment of the activated NK cell molecular signature predicts a poor clinical outcome in ALL, independently of CNS involvement or MRD status.
CD56, CD69, calcium signaling, and cytokines are increased in ALL patients with a poor prognosis
We confirmed that COG B-ALL patients with only activated NK cells express higher levels of NK cell activation markers, that we find to be increased in ALL, compared with their counterparts with 100% resting NK cells and a better prognosis. First, we showed significantly increased CD56 and CD69 transcripts in patients with 100% activated NK cells than in patients with 100% resting NK cells (supplemental Figure 13A-B). Next, using gene set enrichment analysis,55-57 we showed that Ca2+ signaling is significantly upregulated in the 100% activated NK cell group (supplemental Figure 13C-D). Therefore, the poor prognosis for ALL patients with 100% activated NK cells could stem from the repeated failure of immature chronically activated NK cells to lyse lymphoblasts (Figures 3-5).
Because ALL NK cells can produce more cytokines upon stimulation (Figure 4), we hypothesized that high expression of GM-CSF, TNF, and IFN-γ coincides with the molecular signature of activated NK cells in CIBERSORT. To test this, (1) we compared transcript levels of GM-CSF/CSF2, TNF-β/LTA, TNF-C/LTB, and IFN-γ/IFNG in COG B-ALL patients with 100% activated NK cells or 100% resting NK cells. Because expression of TNF-α was not available in COG, we used TNF-β and TNF-C, which are also induced in stimulated CD56bright NK cells.60 We observed significantly increased GM-CSF and TNF messenger RNA, as well as a trend toward increased IFN-γ, in patients with 100% activated NK cells vs 100% resting NK cells (Figure 7A). (2) We divided COG B-ALL patients into 2 groups, based on median messenger RNA expression of GM-CSF, TNF, and IFN-γ, as GM-CSFHighTNFHighIFN-γHigh (n = 22) and GM-CSFLowTNFLowIFN-γLow (n = 19) and estimated the relative frequencies of activated and resting NK cells in these groups using CIBERSORT.49 Patients in the GM-CSFHighTNFHighIFN-γHigh group had greater frequencies of activated NK cells compared with those in the GM-CSFLowTNFLowIFN-γLow group (Figure 7B). Therefore, the molecular signature of activated NK cells in CIBERSORT coincides with classic NK cell activation markers, including increased production of cytokines.
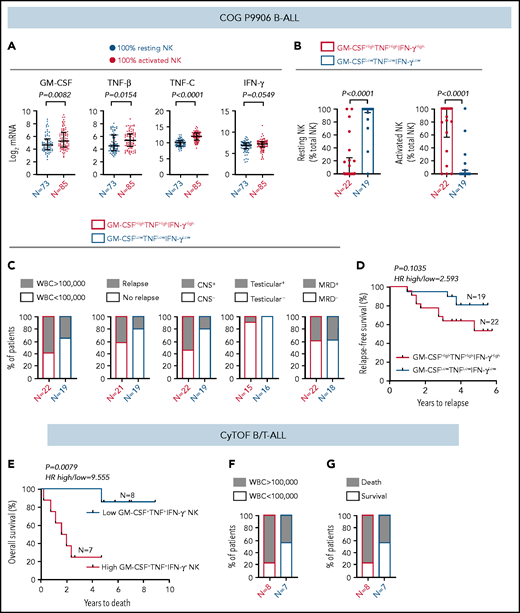
High frequency of cytokine-producing NK cells predicts increased severity and poor prognosis for ALL. (A) Comparison of transcript levels of GM-CSF (CSF2), TNF-β (LTA), TNF-C (LTB), and IFN-γ between COG P9906 B-ALL patients (GSE11877), assigned to 2 groups using CIBERSORT, as 100% resting NK cells (n = 73) or 100% activated NK cells (n = 85). Data are shown as median ± interquartile range. (B) CIBERSORT was used to compare the estimated relative proportions of resting and activated NK cells within total NK cells in GM-CSFHighTNFHighIFN-γHigh (n = 22) and GM-CSFLowTNFLowIFN-γLow (n = 19) B-ALL patients from COG P9906 (GSE11877). Patients were assigned to high and low groups based on the median expression of each transcript. The LM22 signature matrix (GSE22886), which contains the transcriptomic profile of resting NK cells and cytokine (IL-2, IL-15)–activated NK cells, was used to deconvolute the bulk transcriptomic profiles of COG P9906 B-ALL patients. Data are median ± interquartile range. (C) Stacked bar charts comparing the proportions of GM-CSFHighTNFHighIFN-γHigh and GM-CSFLowTNFLowIFN-γLow COG P9906 B-ALL patients (GSE11877) with WBC count >100 000, relapse, CNS involvement (CNS+), testicular involvement in male patients (Testicular+), and positive MRD on day 29 (MRD+). (D) Comparison of RFS probabilities of GM-CSFHighTNFHighIFN-γHigh and GM-CSFLowTNFLowIFN-γLow COG P9906 patients with B-ALL (GSE11877). (E) Comparison of overall survival probabilities of CyTOF patients with B/T-ALL (n = 20) divided into 2 groups based on the median frequencies of GM-CSF+, TNF+, and IFN-γ+ NK cells as High GM-CSF+TNF+IFN-γ+ NK cells and Low GM-CSF+TNF+IFN-γ+ NK cells. Stacked bar charts comparing the proportions of High GM-CSF+TNF+IFN-γ+ NK cells and Low GM-CSF+TNF+IFN-γ+NK cells using CyTOF in B/T-ALL patients based on WBC count (F) and survival (G). Survival curves were produced using the Kaplan-Meier method. For survival curves, exact P values were calculated using the log-rank test. For all other analyses, the exact P values were calculated using the Mann-Whitney U test, HR, hazard ratio.
High frequency of cytokine-producing NK cells predicts increased severity and poor prognosis for ALL. (A) Comparison of transcript levels of GM-CSF (CSF2), TNF-β (LTA), TNF-C (LTB), and IFN-γ between COG P9906 B-ALL patients (GSE11877), assigned to 2 groups using CIBERSORT, as 100% resting NK cells (n = 73) or 100% activated NK cells (n = 85). Data are shown as median ± interquartile range. (B) CIBERSORT was used to compare the estimated relative proportions of resting and activated NK cells within total NK cells in GM-CSFHighTNFHighIFN-γHigh (n = 22) and GM-CSFLowTNFLowIFN-γLow (n = 19) B-ALL patients from COG P9906 (GSE11877). Patients were assigned to high and low groups based on the median expression of each transcript. The LM22 signature matrix (GSE22886), which contains the transcriptomic profile of resting NK cells and cytokine (IL-2, IL-15)–activated NK cells, was used to deconvolute the bulk transcriptomic profiles of COG P9906 B-ALL patients. Data are median ± interquartile range. (C) Stacked bar charts comparing the proportions of GM-CSFHighTNFHighIFN-γHigh and GM-CSFLowTNFLowIFN-γLow COG P9906 B-ALL patients (GSE11877) with WBC count >100 000, relapse, CNS involvement (CNS+), testicular involvement in male patients (Testicular+), and positive MRD on day 29 (MRD+). (D) Comparison of RFS probabilities of GM-CSFHighTNFHighIFN-γHigh and GM-CSFLowTNFLowIFN-γLow COG P9906 patients with B-ALL (GSE11877). (E) Comparison of overall survival probabilities of CyTOF patients with B/T-ALL (n = 20) divided into 2 groups based on the median frequencies of GM-CSF+, TNF+, and IFN-γ+ NK cells as High GM-CSF+TNF+IFN-γ+ NK cells and Low GM-CSF+TNF+IFN-γ+ NK cells. Stacked bar charts comparing the proportions of High GM-CSF+TNF+IFN-γ+ NK cells and Low GM-CSF+TNF+IFN-γ+NK cells using CyTOF in B/T-ALL patients based on WBC count (F) and survival (G). Survival curves were produced using the Kaplan-Meier method. For survival curves, exact P values were calculated using the log-rank test. For all other analyses, the exact P values were calculated using the Mann-Whitney U test, HR, hazard ratio.
High frequency of cytokine-producing NK cells predicts poor ALL prognosis
We investigated whether increased cytokine production may be responsible, at least in part, for the poor prognosis of COG patients with B-ALL with more activated NK cells than resting NK cells. Among NK cell activation markers, we chose cytokines to perform clinical correlations because only cytokines were identically regulated in BMMCs and PBMCs from patients with B-ALL in in vitro studies (Figure 4), and cytokines were differentially regulated between COG patients with B-ALL with 100% resting and 100% activated NK cells (Figure 7A-B).
First, we compared the proportions of COG patients with B-ALL in GM-CSFHighTNFHighIFN-γHigh and GM-CSFLowTNFLowIFN-γLow groups with 5 high-risk pediatric ALL features: white blood cell (WBC) count at diagnosis >100 000, relapse, CNS+, testicular involvement, and MRD. We found that GM-CSFHighTNFHighIFN-γHigh patients were more likely to have all 5 high-risk features compared with their GM-CSFLowTNFLowIFN-γLow counterparts (Figure 7C). Furthermore, B-ALL patients in the GM-CSFHighTNFHighIFN-γHigh cohort trended toward shorter RFSs compared with patients in the GM-CSFLowTNFLowIFN-γLow cohort (Figure 7D).
Finally, we determined whether high cytokine production specifically by NK cells correlates with poor clinical prognosis by interrogating whether high frequencies of GM-CSF+TNF+IFN-γ+ NK cells predict poor prognosis in patients with B/T-ALL using CyTOF (supplemental Table 1). We divided ALL patients into High GM-CSF+TNF+IFN-γ+ NK cell (n = 8) and Low GM-CSF+TNF+IFN-γ+ NK cell (n = 7) groups based on the median frequencies of stimulated NK cells expressing these proteins. We found that patients in the high GM-CSF+TNF+IFN-γ+ NK cell group had lower overall survival probability than did those in the low GM-CSF+TNF+IFN-γ+ NK cell group (Figure 7E). We also observed that higher proportion of patients in the high GM- CSF+TNF+IFN-γ+ NK cell group had WBC counts >100 000 and did not survive postinduction therapy compared with patients in the low GM-CSF+TNF+IFN-γ+ NK cell group (Figure 7F-G). Therefore, accumulation of cytokine-producing NK cells may contribute to increased ALL severity and poor outcomes for patients with high frequencies of activated NK cells.
Discussion
Studies showing that NK cells promote ALL regression in bone marrow transplant recipients28,37 underscore the role of NK cells in antileukemia immune surveillance. However, the mechanisms by which NK cell surveillance is perturbed in human ALL, as well as whether these perturbations in NK cell surveillance predict clinical outcome in patients, were unknown. We address these clinically relevant questions.
To delineate how NK cell surveillance is subverted in human ALL, we immunophenotyped NK cells in B/T-ALL patients using CyTOF48 and flow cytometry. We found that ALL NK cells are less cytotoxic but exhibit a more activated and immature CD56bright-like signature than do their healthy counterparts. Because NK cell homeostasis in B/T-ALL patients are identically perturbed, we infer that identical molecular mechanisms suppress NK cell surveillance in both ALL lineages.
We find that, despite their increased activation and high cytokine production, ALL NK cells do not lyse NK cell–sensitive targets as efficiently as do their healthy counterparts. We show that decreased production of cytotoxic NK effector cells in patients with ALL may reduce NK cell cytotoxicity. Reports show that initial failed NK cell–mediated lysis of targets leads to continuous engagement of activation receptors on NK cells87 and promotes Ca2+ signaling,88-90 ultimately causing NK cell exhaustion.91 Therefore, our observations demonstrating increased frequencies of CD94+CD69+ NK cells, reduced frequencies of KIR2DL1+ NK cells, enhanced Ca2+ signaling, and increased NK cell exhaustion markers in patients prove that dysfunctional hyperactivated NK cells accumulate in ALL. Other reasons for ALL NK cell dysfunctionality that were not interrogated here include perturbations in homeostasis of lytic granules.92,93
Resistance of cancer cells to NK cell–mediated lysis and/or defects in NK cell homeostasis93 cause NK cell suppression in cancer. We focused on the latter because ALL NK cells are unable to kill NK cell–sensitive leukemia. We did not exclude lymphoblast resistance as a contributor of poor NK cell cytotoxicity in B/T-ALL and will explore this in future studies.
Our findings are clinically relevant; hyperactivated cytokine-producing NK cells predict poor outcome in B/T-ALL patients, independent of prognostic factors, including MRD and CNS involvement. We find that activated cytokine-producing NK cells predict poor clinical outcome in childhood and adult ALL. We anticipate translating our findings to develop flow cytometry–based NK cell profiling of blood or bone marrow aspirates to predict the outcome of ALL patients at diagnosis and to identify patients who could benefit from NK cell therapies.
Our studies underscore the therapeutic potential of allogeneic NK cell–based therapies. First, reduced NK cell frequencies in patients make it challenging to obtain sufficient autologous NK cells for engineering therapies.38 Second, the inability of NK cells from patients with B/T-ALL to lyse NK cell–sensitive targets may explain, in part, why autologous hematopoietic transplants fail to induce ALL regression as effectively as do allogeneic haploidentical transplants.28,37-41,94,95 Therefore, engineering NK cell therapies from dysfunctional autologous NK cells from ALL patients would be tedious.
Our studies have limitations; 75% of BMMC B/T-ALL samples that we used are from pediatric subjects. It is difficult to obtain healthy pediatric bone marrow controls. Despite this apparent pitfall, we find that pediatric and adult ALL have the same perturbations in NK cell surveillance compared with healthy donors (supplemental Figure 14). Hence, the ages of patients with do not determine the presence or absence of NK cell dysfunction. However, the extent of NK cell dysfunction in ALL may be associated with age, because adult ALL has a worse clinical prognosis than does childhood ALL.5 Reduced NK cell frequencies in ALL patients and difficulty manipulating NK cells using viral vectors precluded us from conducting knockdown or rescue experiments showing that modulating the CD56bright to CD56dim NK cell transition restores the cytotoxicity of NK cells from patients with ALL. We will conduct these studies in the future using humanized mice.
Our future studies will include single-cell RNA sequencing96 to delineate the molecular events leading to the suppression of NK effector maturation in ALL patients, determining whether leukemia inside-out signaling suppresses NK cell surveillance, and identifying mechanisms of lymphoblast resistance that block NK cell cytotoxicity in patients with ALL.
Acknowledgments
The authors thank the Bass Center for Childhood Cancer and Blood Diseases at Stanford University, the Stem Cell and Xenograft Core at the University of Pennsylvania, and the Hematopoietic Tissue Biorepository of City of Hope for providing primary specimens from . They thank the staff at the Human Immune Monitoring Center at Stanford University and the Analytical Cytometry Core of the City of Hope. The authors also thank Mark Davis (Stanford University) for access to PBMCs from an influenza vaccine study, Eleanora Heisterkamp for providing K562 cells for conducting in vitro cytotoxicity experiments, and Markus Müschen and Teresa Sadras (Yale University) for providing guidance on Ca2+-release assays.
This work was supported by a Special Fellow Award from The Leukemia and Lymphoma Society (LLS 3366-17), an American Society of Hematology Scholar Award, a Junior Investigator Research Development Award from the Circle of Service Foundation, the Research Start-Up Budget from the Beckman Research Institute of the City of Hope, and a PhRMA Foundation Research Starter Grant in Drug Discovery (S.S.). C.D. was supported by National Institutes of Health (NIH) National Cancer Institute (NCI) grant 1U24CA224309 (H.T.M.). A.K., A.T.K., and S.J.L. were supported by the Research Start-Up Budget from the Beckman Research Institute of the City of Hope (S.S.). M.A.C. is an Outstanding Investigator of the NIH/NCI (R35CA210087). C.H. was supported by a Young Investigator Award from the Alex’s Lemonade Stand Foundation and a Scholar Award from the American Society of Hematology. The Hematopoietic Tissue Biorepository and Analytical Cytometry Core at the City of Hope are Shared Resource Cores supported by NIH/NCI grant P30CA033572. Finally, the authors thank the NIH/NCI for their support through the CIMAC-CIDC (Cancer Immune Monitoring and Analysis Center–Cancer Immunologic Data Commons) Network, as well as the Leukemia and Lymphoma Society and the American Society of Hematology for funding these studies.
The content is solely the responsibility of the authors and does not necessarily represent the official views of the National Institutes of Health.
Authorship
Contribution: C.D. planned and conducted CyTOF-based studies, analyzed data, and interpreted results; A.K. planned and conducted flow cytometry–based experiments, analyzed data, and interpreted results; A.T.K. analyzed clinical data from publicly available ALL data sets and CyTOF patients; A.K. and S.J.L. collected mononuclear cells from peripheral blood of healthy donors obtained from the City of Hope Michael Amini Transfusion Medicine Center; L.Y. provided guidance for all computational analyses; M.H., B.M., L.G., and T.M. collected, processed, and curated samples from B/T-ALL patients used for CyTOF; K.M.S., N.J.L., M.C., and G.M. approved the collection of samples from ALL patients after informed consent and provided access to deidentified samples with associated clinical annotation; K.M.S., N.J.L., M.C., S.K.T., G.M., L.G., and C.H. provided guidance on ALL biology; J.Y. and M.A.C provided guidance on NK cell biology; S.S. and H.T.M. provided scientific guidance and administrative, technical, and material support; S.S. conceived the study, developed the experimental methodology, interpreted the results, wrote the manuscript, and supervised the study; and C.D., A.K., A.T.K., L.Y., C.H., S.K.T, M.H., and H.T.M. edited the manuscript.
Conflict-of-interest disclosure: The authors declare no competing financial interests.
Correspondence: Srividya Swaminathan, Department of Systems Biology, Beckman Research Institute of City of Hope, 1218 S Fifth Ave, BRC 2064, Monrovia, CA 91016; e-mail: sswaminathan@coh.org.
Data sharing requests should be sent to Srividya Swaminathan (sswaminathan@coh.org).
The online version of this article contains a data supplement.
The publication costs of this article were defrayed in part by page charge payment. Therefore, and solely to indicate this fact, this article is hereby marked “advertisement” in accordance with 18 USC section 1734.

This feature is available to Subscribers Only
Sign In or Create an Account Close Modal