

Key Points
Mutant ASXL1 and HHEX promote myeloid leukemogenesis via upregulating the expression of MYB and ETV5.
Inhibition of the HHEX-MYB/ETV5 axis would be a promising therapeutic approach for myeloid malignancies harboring ASXL1 mutations.

Abstract
Additional sex combs-like 1 (ASXL1), an epigenetic modulator, is frequently mutated in myeloid neoplasms. Recent analyses of mutant ASXL1 conditional knockin (ASXL1-MT-KI) mice suggested that ASXL1-MT alone is insufficient for myeloid transformation. In our previous study, we used retrovirus-mediated insertional mutagenesis, which exhibited the susceptibility of ASXL1-MT-KI hematopoietic cells to transform into myeloid leukemia cells. In this screening, we identified the hematopoietically expressed homeobox (HHEX) gene as one of the common retrovirus integration sites. In this study, we investigated the potential cooperation between ASXL1-MT and HHEX in myeloid leukemogenesis. Expression of HHEX enhanced proliferation of ASXL1-MT–expressing HSPCs by inhibiting apoptosis and blocking differentiation, whereas it showed only modest effect in normal HSPCs. Moreover, ASXL1-MT and HHEX accelerated the development of RUNX1-ETO9a and FLT3-ITD leukemia. Conversely, HHEX depletion profoundly attenuated the colony-forming activity and leukemogenicity of ASXL1-MT–expressing leukemia cells. Mechanistically, we identified MYB and ETV5 as downstream targets for ASXL1-MT and HHEX by using transcriptome and chromatin immunoprecipitation–next-generation sequencing analyses. Moreover, we found that expression of ASXL1-MT enhanced the binding of HHEX to the promoter loci of MYB or ETV5 via reducing H2AK119ub. Depletion of MYB or ETV5 induced apoptosis or differentiation in ASXL1-MT–expressing leukemia cells, respectively. In addition, ectopic expression of MYB or ETV5 reversed the reduced colony-forming activity of HHEX-depleted ASXL1-MT–expressing leukemia cells. These findings indicate that the HHEX-MYB/ETV5 axis promotes myeloid transformation in ASXL1-mutated preleukemia cells.
Introduction
Additional sex combs-like 1 (ASXL1), an epigenetic modulator, is frequently mutated in myeloid malignancies including acute myeloid leukemia (AML), myelodysplastic syndromes (MDS), myeloproliferative neoplasms, and chronic myelomonocytic leukemia. ASXL1 mutations are associated with poor prognosis in various myeloid malignancies.1-3 ASXL1 mutations in myeloid neoplasms typically occur near the last exon where the majority of the mutations are frameshift or nonsense mutations. As a result, C-terminally truncated forms of mutant ASXL1 (ASXL1-MT) are produced.4 Wild-type ASXL1 interacts with various epigenetic regulators, such as polycomb repressive complex 2 and BRCA1-associated protein 1 (BAP1).5,6 ASXL1-MT also interacts with these epigenetic components and induces aberrant histone modifications in a dominant-negative or gain-of-function manner.7-10 It has also been reported that ASXL1-MT, but not wild-type ASXL1, interacts with BRD4 to activate genes related to myeloid transformation.11 Thus, these epigenetic changes induced by ASXL1-MT contribute to the development of myeloid neoplasms.
We recently generated ASXL1-MT conditional knockin (ASXL1-MT-KI) mice.12 ASXL1-MT-KI mice showed mild anemia, differentiation block of erythrocytes, myeloid skewing, and dysplasia. These features are indicative of early stage MDS. However, ASXL1-MT-KI mice never developed myeloid leukemia in 2 years, suggesting that additional elements are required for myeloid transformation of ASXL1-mutated cells. Our previous study on retrovirus-mediated insertional mutagenesis showed the susceptibility of ASXL1-MT-KI bone marrow (BM) cells to transform into myeloid leukemia.12 In the previous study, we identified the hematopoietically expressed homeobox (HHEX) gene as one of the common retrovirus integration sites.12
HHEX is a homeodomain-containing gene, which was primarily isolated from hematopoietic tissue.13 HHEX encodes a highly conserved homeobox protein, HHEX protein, which contains a proline-rich homeodomain and is considered as a repressive transcriptional factor.14,15 Loss of HHEX displays embryonic lethality because of impairment of vasculogenesis and heart tissue.16,17 In fetal hematopoiesis, HHEX deletion results in reduced production of CD45+ hematopoietic cells from ES cells.18 In adult hematopoiesis, previous studies have shown that HHEX is highly expressed in hematopoietic stem-progenitor cells (HSPCs) and leukemia cells.19 In this context, overexpression of HHEX represses CDKN2A and blocks differentiation of promyelocytes.19,20 Moreover, HHEX is essential for B lymphopoiesis but dispensable for hematopoiesis at a steady state.21-23 In stress hematopoiesis, HHEX depletion leads to defects of T lymphopoiesis.23 In contrast, HHEX expression negatively regulates regulatory T cells by inhibiting Foxp3 expression.24 However, it remains unknown whether HHEX contributes to myeloid transformation in ASXL1-mutated cells, and how HHEX promotes leukemogenesis remains to be elucidated.
In this study, we showed functional cooperation between ASXL1-MT and HHEX in myeloid leukemogenesis either by themselves or in combination with FLT3-ITD and RUNX1-ETO. We also identified MYB and ETV5 as directly regulated genes by HHEX and demonstrated the pivotal roles of MYB and ETV5 in ASXL1-mutated myeloid leukemia.
Methods
Gene expression analysis
Gene expression and correlation analyses of HHEX, ETV5, and MYB were generated using RNA sequencing datasets of the Beat AML study,25 which were kindly provided by the Oregon Health & Science University to the Cleveland Clinic Foundation. Data from The Cancer Genome Atlas (TCGA) were also analyzed.
Study approval
All animal experiments were approved by the Animal Care Committee at the Institute of Medical Science, the University of Tokyo (approval numbers: K15-32, PA13-19, PA17-75, PA16-31, PA18-46). All experiments using human cord blood (CB) cells were approved by the Ethics Committee at the Institute of Medical Science, the University of Tokyo (approval number: 27-34-1225). Details for other methods are provided in the supplemental Methods, available on the Blood Web site.
Results
ASXL1-MT and HHEX enhanced proliferation and impaired differentiation of myeloid progenitor cells in vitro
To investigate the role of ASXL1-MT and HHEX in myeloid transformation, we first performed colony-forming assay using c-Kit+ BM cells derived from control mice or ASXL1-MT-KI mice. Forced expression of HHEX enhanced colony-replating activity in cells derived from ASXL1-MT-KI mice, whereas it showed only a modest effect in normal myeloid progenitor cells (Figure 1A). The morphology of the colonies derived from cells expressing ASXL1-MT and HHEX is more compact than that derived from other genotypes (supplemental Figure 1A). In liquid culture, the murine cells expressing ASXL1-MT and HHEX also enhanced proliferation and blocked myeloid differentiation (Figure 1B-C; supplemental Figure 1B). We further evaluated the effect of ASXL1-MT and HHEX on proliferation using human CD34+ CB cells. Expression of ASXL1-MT and HHEX synergistically enhanced proliferation and colony-forming unit–granulocyte/macrophage (CFU-GM)–replating activity, whereas it impaired colony-forming unit erythroid (CFU-E) and burst-forming unit-erythroid (BFU-E) formation (Figure 1D-F; supplemental Figure 1C-E). To characterize the cell cycle profiles in ASXL1-MT– and HHEX-expressing CB cells, we assessed cell cycle and apoptosis status. Expression of ASXL1-MT and HHEX increased the proportion of S/G2/M-phase cells and decreased the Annexin V+ fraction (Figure 1G-H). Thus, expression of ASXL1-MT and HHEX induced increased proliferation of murine and human HSPCs via promoting cell cycle progression and inhibiting apoptosis.
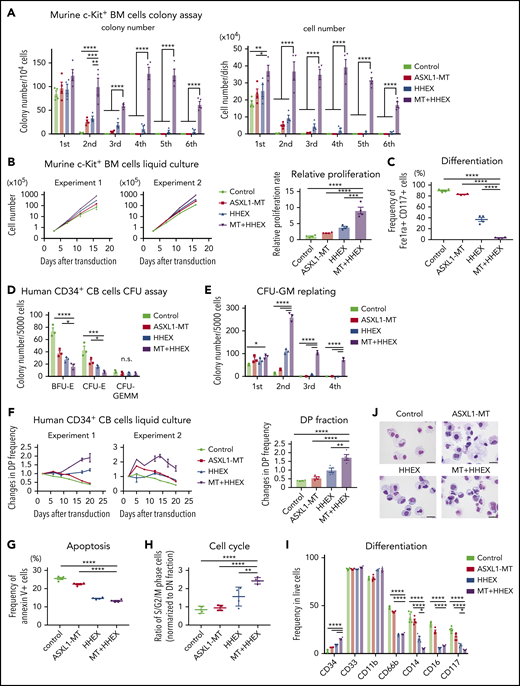
ASXL1-MT and HHEX enhanced proliferation and impaired differentiation of myeloid progenitor cells in vitro. (A-C) c-Kit+ BM cells derived from control or ASXL1-MT-KI mice were transduced with control/HHEX (coexpressing NGFR). NGFR-positive cells were sorted 48 hr after transduction. (A) A total of 104 cells were cultured in M3234 Methocult containing myeloid-enriched cytokines (n = 4). Shown are weekly colony counts per 104 replated cells (left), and the number of cells per well (right). (B, C) Cells were cultured in media containing myeloid-enriched cytokines. (B) Shown are proliferation of the cells from 2 independent experiments (left), and the relative proliferation rate at the end of culture (right; n = 4). (C) Mast cell maturation was assessed by the ratio of FceIRa and CD117 double-positive cells (enriched with mature mast cells) at the end of culture (n = 4). (D-J) Human CD34+ CB cells were transduced with vector/ASXL1-MT (coexpressing GFP) and vector/HHEX (coexpressing NGFR). (D, E) GFP/NGFR double-positive (DP) cells were sorted 48 hr after transduction. A total of 5000 GFP/NGFR DP cells were cultured in H4434 Methocult classic. Shown are the number of BFU-E, CFU-E, and CFU-GEMM at day 10 (D), and the colony-replating ability of CFU-GM per 5000 cells (E). (F-J) After retroviral transduction to CD34+ CB cells, cells were cultured in media containing myeloid-enriched cytokines. (F) Shown are the changes of GFP/NGFR DP cell frequency from duplicated wells. Two independent representative experiments (left) and the statistical analysis (right) are shown. (G, H) Apoptosis (G) and cell cycle (H) status in each GFP/NGFR double-positive fraction of the cells described in panel F at day 7 (n = 4 each). (I, J) Expression of the indicated surface markers (I; n = 4) and cytospin preparation (J; scale bars, 20 μm) at day 20. Statistical analyses were performed by 1-way analysis of variance (ANOVA) with Tukey’s multiple comparisons test. Data are shown as mean ± standard error of the mean (SEM). *P < .05; **P < .01; ***P < .001; ****P < .0001.
ASXL1-MT and HHEX enhanced proliferation and impaired differentiation of myeloid progenitor cells in vitro. (A-C) c-Kit+ BM cells derived from control or ASXL1-MT-KI mice were transduced with control/HHEX (coexpressing NGFR). NGFR-positive cells were sorted 48 hr after transduction. (A) A total of 104 cells were cultured in M3234 Methocult containing myeloid-enriched cytokines (n = 4). Shown are weekly colony counts per 104 replated cells (left), and the number of cells per well (right). (B, C) Cells were cultured in media containing myeloid-enriched cytokines. (B) Shown are proliferation of the cells from 2 independent experiments (left), and the relative proliferation rate at the end of culture (right; n = 4). (C) Mast cell maturation was assessed by the ratio of FceIRa and CD117 double-positive cells (enriched with mature mast cells) at the end of culture (n = 4). (D-J) Human CD34+ CB cells were transduced with vector/ASXL1-MT (coexpressing GFP) and vector/HHEX (coexpressing NGFR). (D, E) GFP/NGFR double-positive (DP) cells were sorted 48 hr after transduction. A total of 5000 GFP/NGFR DP cells were cultured in H4434 Methocult classic. Shown are the number of BFU-E, CFU-E, and CFU-GEMM at day 10 (D), and the colony-replating ability of CFU-GM per 5000 cells (E). (F-J) After retroviral transduction to CD34+ CB cells, cells were cultured in media containing myeloid-enriched cytokines. (F) Shown are the changes of GFP/NGFR DP cell frequency from duplicated wells. Two independent representative experiments (left) and the statistical analysis (right) are shown. (G, H) Apoptosis (G) and cell cycle (H) status in each GFP/NGFR double-positive fraction of the cells described in panel F at day 7 (n = 4 each). (I, J) Expression of the indicated surface markers (I; n = 4) and cytospin preparation (J; scale bars, 20 μm) at day 20. Statistical analyses were performed by 1-way analysis of variance (ANOVA) with Tukey’s multiple comparisons test. Data are shown as mean ± standard error of the mean (SEM). *P < .05; **P < .01; ***P < .001; ****P < .0001.
Next, we assessed the effect of ASXL1-MT and HHEX on myeloid differentiation. Expression of HHEX reduced expression of differentiation markers including CD66b and CD16b (Figure 1I). In addition, expression of either ASXL1-MT or HHEX reduced expression of CD14 and CD117, but retained expression of CD34 in human CD34+ CB cells. We found that ASXL1-MT cooperated with HHEX in further inhibiting differentiation (Figure 1I-J). We also observed that ASXL1-MT and HHEX jointly inhibited calcitriol-induced monocytic differentiation block in a human leukemia cell line, HL-60 (supplemental Figure 1F-G). These data indicated that ASXL1-MT and HHEX cooperatively enhanced proliferation and impaired differentiation of murine and human myeloid progenitor cells in vitro.
ASXL1-MT and HHEX cooperatively blocked myeloid differentiation and promoted myeloid leukemogenesis in vivo
To evaluate impacts of ASXL1-MT and HHEX on hematopoiesis in vivo, we transduced a control vector or HHEX into c-Kit+ BM cells derived from a control or ASXL1-MT-KI mice (Figure 2A). We then transplanted them into sublethally irradiated recipient mice. Five of 12 mice transplanted with cells expressing ASXL1-MT and HHEX developed AML, whereas those transplanted with cells expressing HHEX or ASXL1-MT alone never developed AML (Figure 2B). The AML mice induced by ASXL1-MT and HHEX displayed hepatosplenomegaly (Figure 2C; supplemental Figure 2A). The AML cells displayed blastic morphology and the following immunophenotypes: c-Kit+, CD11blow, B220−, and CD3− (Figure 2D-E; supplemental Figure 2B). The surviving mice transplanted with cells expressing ASXL1-MT and HHEX displayed mild leukocytopenia, anemia, macrocytosis, and thrombocytosis (Figure 2F). Unlike mice that developed AML, the chimerism of the ASXL1-MT– and HHEX-expressing cells in the whole BM was not high (Figure 2G). In addition, expression of either ASXL1-MT or HHEX showed myeloid skewing both in the peripheral blood (PB) and BM, and expression of ASXL1-MT and HHEX increased the frequency of CD11b+Gr-1− cells (Figure 2H-I). Consisting with in vitro experiments, expression of either ASXL1-MT or HHEX exhibited the immature morphology and the increase of granulocyte-monocyte progenitor (GMP) and Lineage− Sca-1− c-Kit+ fractions, and expression of ASXL1-MT and HHEX showed further differentiation block (Figure 2J-K; supplemental Figure 2C-D). These data indicated that expression of ASXL1-MT and HHEX cooperatively inhibited myeloid differentiation of HSPCs in vivo, but it was insufficient to complete myeloid transformation.
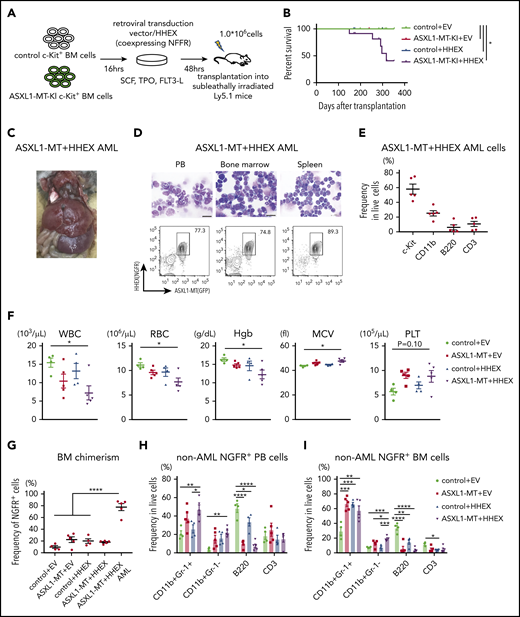
ASXL1-MT and HHEX cooperatively blocked differentiation and enhanced the susceptibility of leukemic transformation in vivo. (A) Schematic presentation of BM transplantation model. (B) Kaplan-Meier curve for the survival of the mice transplanted with control/HHEX transduced c-Kit+ BM cells derived from control or ASXL1-MT-KI mice (n = 12 each group, log-rank test). (C) Representative hepatosplenomegaly in leukemic mice transplanted with HHEX-expressing c-Kit+ ASXL1-MT-KI BM cells. (D) Cytospin preparation of PB, BM, and spleen cells from leukemic mice induced by ASXL1-MT, and HHEX (upper, scale bars: 20 μm) and representative FACS plots (lower). (E) Distribution of the indicated surface markers in leukemic cells infiltrating BM induced by ASXL1-MT and HHEX (n = 5). (F-J) Analyses of nonleukemic mice of the indicated groups at the end-stage (control+EV, n = 4; ASXL1-MT+EV, n = 5; control+HHEX, n = 4; ASXL1-MT+HHEX, n = 5). (F) Blood counts of peripheral white blood cells (WBC), red blood cells (RBC), hemoglobin (Hb), mean corpuscular volume (MCV), and platelets (PLT). (G) BM chimerism of NGFR+ cells at the end-stage of nonleukemic mice and leukemic mice by ASXL1-MT and HHEX expression. (H, I) Lineage composition of the NGFR-positive cells from PB (H) and BM (I). (J) The frequency of HSPCs of the NGFR+ cells. (K) Cytospin preparation of NGFR+ BM cells from the indicated recipient mice (left) and the distribution of lymphocytes and mature, immature, and blast-like myeloid cells (right; n = 3). (F-K) Statistical analyses were performed by 1-way ANOVA with Tukey’s multiple comparisons test. Data are shown as mean ± SEM. *P < .05; **P < .01; ***P < .001; ****P < .0001. CMP, common myeloid progenitor; LK, Lineage−, Sca-1−, c-Kit+; LSK, Lineage−, Sca-1+, c-Kit+; MEP, megakaryocyte-erythroid progenitor.
ASXL1-MT and HHEX cooperatively blocked differentiation and enhanced the susceptibility of leukemic transformation in vivo. (A) Schematic presentation of BM transplantation model. (B) Kaplan-Meier curve for the survival of the mice transplanted with control/HHEX transduced c-Kit+ BM cells derived from control or ASXL1-MT-KI mice (n = 12 each group, log-rank test). (C) Representative hepatosplenomegaly in leukemic mice transplanted with HHEX-expressing c-Kit+ ASXL1-MT-KI BM cells. (D) Cytospin preparation of PB, BM, and spleen cells from leukemic mice induced by ASXL1-MT, and HHEX (upper, scale bars: 20 μm) and representative FACS plots (lower). (E) Distribution of the indicated surface markers in leukemic cells infiltrating BM induced by ASXL1-MT and HHEX (n = 5). (F-J) Analyses of nonleukemic mice of the indicated groups at the end-stage (control+EV, n = 4; ASXL1-MT+EV, n = 5; control+HHEX, n = 4; ASXL1-MT+HHEX, n = 5). (F) Blood counts of peripheral white blood cells (WBC), red blood cells (RBC), hemoglobin (Hb), mean corpuscular volume (MCV), and platelets (PLT). (G) BM chimerism of NGFR+ cells at the end-stage of nonleukemic mice and leukemic mice by ASXL1-MT and HHEX expression. (H, I) Lineage composition of the NGFR-positive cells from PB (H) and BM (I). (J) The frequency of HSPCs of the NGFR+ cells. (K) Cytospin preparation of NGFR+ BM cells from the indicated recipient mice (left) and the distribution of lymphocytes and mature, immature, and blast-like myeloid cells (right; n = 3). (F-K) Statistical analyses were performed by 1-way ANOVA with Tukey’s multiple comparisons test. Data are shown as mean ± SEM. *P < .05; **P < .01; ***P < .001; ****P < .0001. CMP, common myeloid progenitor; LK, Lineage−, Sca-1−, c-Kit+; LSK, Lineage−, Sca-1+, c-Kit+; MEP, megakaryocyte-erythroid progenitor.
ASXL1-MT and HHEX promoted myeloid transformation induced by RUNX1-ETO and FLT3-ITD
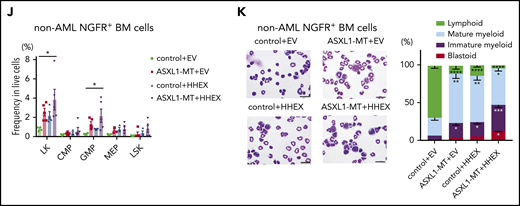
Next, we examined possible cooperation between ASXL1-MT and HHEX in myeloid leukemogenesis in the presence of other mutations. Clinical data showed that ASXL1 mutations and RUNX1-ETO (also called AML1-ETO) fusion frequently cooccur in AML patients.26 We previously showed that CB cells expressing RUNX1-ETO can grow over 6 months in culture retaining primitive CD34+ cells, and recapitulate many features of human RUNX1-ETO leukemia.27,28 Therefore, we transduced a control vector or ASXL1-MT (coexpressing green fluorescent protein [GFP]) and another control vector or HHEX (coexpressing nerve growth factor receptor [NGFR]) into RUNX1-ETO–expressing CB cells and then traced the frequency of GFP+/NGFR+ double-positive fraction by fluorescence-activated cell sorting (FACS; supplemental Figure 3A). Cells expressing ASXL1-MT or HHEX moderately enhanced and cells coexpressing ASXL1-MT and HHEX dramatically enhanced proliferation of RUNX1-ETO–expressing CB cells (Figure 3A; supplemental Figure 3B-C). Expression of ASXL1-MT and HHEX increased the proportion of S/G2/M-phase cells and decreased the Annexin V+ fraction (Figure 3B-C). In addition, most of the ASXL1-MT– and HHEX-transduced RUNX1-ETO–expressing cells retained an immature phenotype on day 30 (Figure 3D). Thus, ASXL1-MT and HHEX enhanced proliferation of RUNX1-ETO–expressing CB cells in vitro.
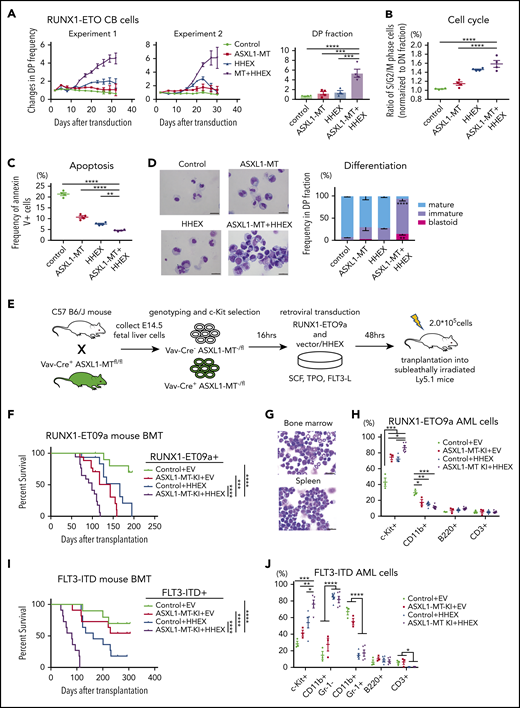
ASXL1-MT and HHEX cooperatively promoted myeloid transformation in RUNX1-ETO and FLT3-ITD. (A) RUNX1-ETO–expressing human CB cells were transduced with vector/ASXL1-MT (coexpressing GFP) and vector/HHEX (coexpressing NGFR). Shown are the changes of GFP/NGFR double-positive (DP) cell frequency from 2 independent experiments (left) and the relative proliferation rate at the end of culture (right, n = 4). (B) The frequency of S/G2/M-phase cells in each DP fraction of the cells described in panel A was normalized to that in the double-negative fraction at day 7 (n = 4). (C) The frequency of Annexin V–positive cells in each DP fraction of the cells described in panel A at day 7 (n = 4). (D) Representative cytospin preparation of RUNX1-ETO–expressing cells transduced with indicated constructs on day 30 (left; scale bars, 20 μm), and the distribution of mature, immature, and blast-like cells (right; n = 3). (E) Schematic presentation of RUNX1-ETO9a–induced leukemia model. (F) Kaplan-Meier curve for the survival of the transplanted mice in each group (Control+EV, n = 15; ASXL1-MT-KI+EV, n = 17; Control+HHEX, n = 15; ASXL1-MT-KI+HHEX, n = 17; log-rank test). (G) Representative cytospin preparation of BM and spleen cells of RUNX1-ETO9a/ASXL1-MT/HHEX induced leukemic mice (scale bars, 20 μm). (H) Composition of the indicated surface markers in RUNX1-ETO9a induced leukemia cells infiltrating BM (Control+EV, n = 3; ASXL1-MT-KI+EV, n = 3; Control+HHEX, n = 4; ASXL1-MT-KI+HHEX, n = 6). (I) Kaplan-Meier curve for the survival of the transplanted mice in each group (Control+EV, n = 10; ASXL1-MT-KI+EV, n = 11; Control+HHEX, n = 11; ASXL1-MT-KI+HHEX, n = 11; log-rank test). (J) Composition of the indicated surface markers in FLT3-ITD induced leukemia cells infiltrating BM (Control+EV, n = 3; ASXL1-MT-KI+EV, n = 3; Control+HHEX, n = 5; ASXL1-MT-KI+HHEX, n = 5). Statistical analyses were performed by 1-way ANOVA with Tukey’s multiple comparisons test. Data are shown as mean ± SEM. *P < .05; **P < .01; ***P < .001; ****P < .0001.
ASXL1-MT and HHEX cooperatively promoted myeloid transformation in RUNX1-ETO and FLT3-ITD. (A) RUNX1-ETO–expressing human CB cells were transduced with vector/ASXL1-MT (coexpressing GFP) and vector/HHEX (coexpressing NGFR). Shown are the changes of GFP/NGFR double-positive (DP) cell frequency from 2 independent experiments (left) and the relative proliferation rate at the end of culture (right, n = 4). (B) The frequency of S/G2/M-phase cells in each DP fraction of the cells described in panel A was normalized to that in the double-negative fraction at day 7 (n = 4). (C) The frequency of Annexin V–positive cells in each DP fraction of the cells described in panel A at day 7 (n = 4). (D) Representative cytospin preparation of RUNX1-ETO–expressing cells transduced with indicated constructs on day 30 (left; scale bars, 20 μm), and the distribution of mature, immature, and blast-like cells (right; n = 3). (E) Schematic presentation of RUNX1-ETO9a–induced leukemia model. (F) Kaplan-Meier curve for the survival of the transplanted mice in each group (Control+EV, n = 15; ASXL1-MT-KI+EV, n = 17; Control+HHEX, n = 15; ASXL1-MT-KI+HHEX, n = 17; log-rank test). (G) Representative cytospin preparation of BM and spleen cells of RUNX1-ETO9a/ASXL1-MT/HHEX induced leukemic mice (scale bars, 20 μm). (H) Composition of the indicated surface markers in RUNX1-ETO9a induced leukemia cells infiltrating BM (Control+EV, n = 3; ASXL1-MT-KI+EV, n = 3; Control+HHEX, n = 4; ASXL1-MT-KI+HHEX, n = 6). (I) Kaplan-Meier curve for the survival of the transplanted mice in each group (Control+EV, n = 10; ASXL1-MT-KI+EV, n = 11; Control+HHEX, n = 11; ASXL1-MT-KI+HHEX, n = 11; log-rank test). (J) Composition of the indicated surface markers in FLT3-ITD induced leukemia cells infiltrating BM (Control+EV, n = 3; ASXL1-MT-KI+EV, n = 3; Control+HHEX, n = 5; ASXL1-MT-KI+HHEX, n = 5). Statistical analyses were performed by 1-way ANOVA with Tukey’s multiple comparisons test. Data are shown as mean ± SEM. *P < .05; **P < .01; ***P < .001; ****P < .0001.
Next, we investigated the synergistic effects of ASXL1-MT and HHEX on leukemogenesis in vivo using RUNX1-ETO9a, which is a shorter isoform of RUNX1-ETO and has a stronger leukemogenic activity.29 We retrovirally transduced RUNX1-ETO9a (coexpressing Thy1.1) together with a control vector or HHEX (coexpressing NGFR) into c-kit+ fetal liver cells derived from Vav-Cre+/− or Vav-Cre−/− ASXL1-MT-KI, after which we transplanted them into sublethally irradiated recipient mice (Figure 3E). Consistent with our previous report,5 cells expressing ASXL1-MT showed susceptibility to myeloid leukemia driven by RUNX1-ETO9a (Figure 3F). Expression of HHEX further enhanced leukemogenesis induced by RUNX1-ETO9a and ASXL1-MT (Figure 3F-G; supplemental Figure 4A-B). Expression of ASXL1-MT and HHEX increased the frequency of c-Kit+ fraction in RUNX1-ETO9a AML cells (Figure 3H; supplemental Figure 4C). Moreover, we investigated the collaborating roles of ASXL1-MT and HHEX in another leukemia model, named FLT3-ITD leukemia. c-Kit+ BM cells derived from control or ASXL1-MT-KI mice were transduced with FLT3-ITD (coexpressing Kusabira Orange [KuO]) together with a control vector or HHEX followed by transplantation into sublethally irradiated mice (supplemental Figure 5A). In line with a previous report,30 HHEX expression enhanced the leukemogenicity of FLT3-ITD (Figure 3I). Expression of ASXL1-MT and HHEX more rapidly induced the development of myeloid leukemia driven by FLT3-ITD (Figure 3I; supplemental Figure 5B-C). HHEX expression increased the frequency of CD11b+Gr-1− cells and combined expression of ASXL1-MT and HHEX increased c-Kit+ fraction in FLT3-ITD AML cells (Figure 3J; supplemental Figure 5D). These data indicated that ASXL1-MT and HHEX cooperatively promote leukemogenesis induced by RUNX1-ETO and FLT3-ITD.
Endogenous HHEX promoted survival of ASXL1-mutated leukemia cells
We next assessed whether endogenous HHEX promotes myeloid leukemogenesis of leukemia cells expressing ASXL1-MT. We previously generated 2 distinct myeloid leukemia cells, cSAM cells (cells with combined expression of SETBP1 and ASXL1 mutations) and cRAM cells (cells with combined expression of RUNX1 and ASXL1 mutations).12,31,32 We first transduced Cas9 to cSAM cells and cRAM cells (hereafter referred to as cSAM/Cas9 cells and cRAM/Cas9 cells), and then either a nontargeting control vector (sgNT) or Hhex-targeting sgRNAs (sgHhex #1, sgHhex #2) into cSAM/Cas9 cells and cRAM/Cas9 cells, followed by performing colony-forming assay and mouse transplantation (Figure 4A-B). We observed that Hhex depleted cSAM/Cas9 cells, and cRAM/Cas9 cells reduced cell cycle progression and promoted differentiation and apoptosis (Figure 4C-D; supplemental Figure 6A-E). Importantly, depletion of Hhex both in cSAM/Cas9 cells and cRAM/Cas9 cells dramatically reduced colony-forming activity and leukemogenicity (Figure 4E-F).
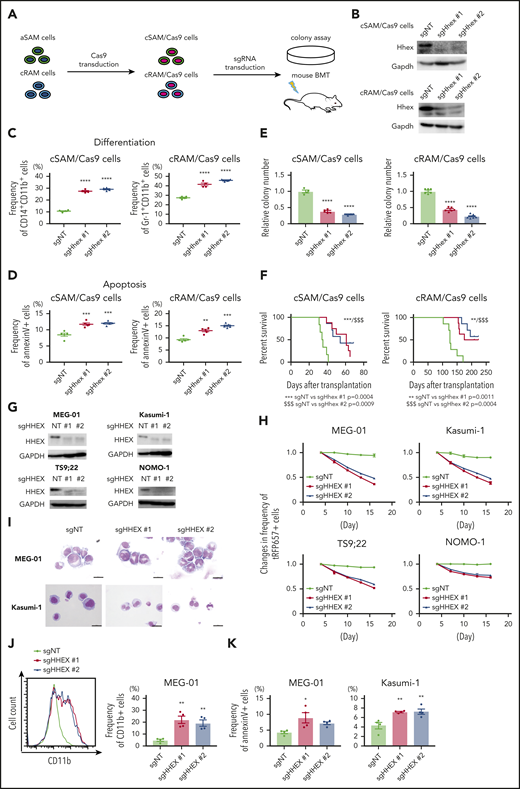
Endogenous HHEX promoted survival of leukemia cells expressing ASXL1-MT. (A) Schematic presentation for experimental procedure for panels B-F. (B) Levels of Hhex protein in cSAM/Cas9 and cRAM/Cas9 cells transduced with NT or 2 independent Hhex-targeting sgRNAs. (C, D) Depletion of endogenous Hhex promoted differentiation (C; n = 4 each) and apoptosis (D; n = 5 each) in cSAM/Cas9 cells and cRAM/Cas9 cells at day 4. One-way ANOVA with Tukey’s multiple comparisons test. (E) Depletion of endogenous Hhex reduced colony-forming activity in cSAM/Cas9 cells (n = 4) and cRAM/Cas9 cells (n = 6). (F) Depletion of endogenous Hhex abrogated leukemogenicity in cSAM/Cas9 cells and cRAM/Cas9 cells. Kaplan-Meier curve for the survival of the transplanted mice in each group (n = 6-8; log-rank test). (G) Levels of Hhex protein in ASXL1-mutated human leukemia cell lines (MEG-01, Kasumi-1, TS9;22, and NOMO-1) transduced with NT or 2 independent HHEX-targeting sgRNAs. (H) Four ASXL1-mutated leukemia cell lines were transduced with NT or HHEX-targeting sgRNAs (coexpressing tRFP657). The cells were cultured in vitro to monitor the changes of the frequency of tRFP657-positive cells in duplicated wells. Results are normalized to the frequency of tRFP657-positive cells of each population on day 4, set to 1. (I) Representative cytospin preparation of control or sgHHEX-transduced MEG-01 and Kasumi-1 cells (scale bars, 20 μm). (J) Representative FACS histogram of CD11b expression of control or sgHHEX-transduced MEG-01 cells at day 7 (left), and the frequency of CD11b-positive cells are shown (right; n = 4). One-way ANOVA with Tukey’s multiple comparisons test. (K) The frequencies of Annexin V–positive cells of control or sgHHEX-transduced MEG-01 and Kasumi-1 cells at day 4 (n = 4). Statistical analyses were performed by 1-way ANOVA with Tukey’s multiple comparisons test. Data are shown as mean ± SEM. *P < .05; **P < .01; ***P < .001; ****P < .0001.
Endogenous HHEX promoted survival of leukemia cells expressing ASXL1-MT. (A) Schematic presentation for experimental procedure for panels B-F. (B) Levels of Hhex protein in cSAM/Cas9 and cRAM/Cas9 cells transduced with NT or 2 independent Hhex-targeting sgRNAs. (C, D) Depletion of endogenous Hhex promoted differentiation (C; n = 4 each) and apoptosis (D; n = 5 each) in cSAM/Cas9 cells and cRAM/Cas9 cells at day 4. One-way ANOVA with Tukey’s multiple comparisons test. (E) Depletion of endogenous Hhex reduced colony-forming activity in cSAM/Cas9 cells (n = 4) and cRAM/Cas9 cells (n = 6). (F) Depletion of endogenous Hhex abrogated leukemogenicity in cSAM/Cas9 cells and cRAM/Cas9 cells. Kaplan-Meier curve for the survival of the transplanted mice in each group (n = 6-8; log-rank test). (G) Levels of Hhex protein in ASXL1-mutated human leukemia cell lines (MEG-01, Kasumi-1, TS9;22, and NOMO-1) transduced with NT or 2 independent HHEX-targeting sgRNAs. (H) Four ASXL1-mutated leukemia cell lines were transduced with NT or HHEX-targeting sgRNAs (coexpressing tRFP657). The cells were cultured in vitro to monitor the changes of the frequency of tRFP657-positive cells in duplicated wells. Results are normalized to the frequency of tRFP657-positive cells of each population on day 4, set to 1. (I) Representative cytospin preparation of control or sgHHEX-transduced MEG-01 and Kasumi-1 cells (scale bars, 20 μm). (J) Representative FACS histogram of CD11b expression of control or sgHHEX-transduced MEG-01 cells at day 7 (left), and the frequency of CD11b-positive cells are shown (right; n = 4). One-way ANOVA with Tukey’s multiple comparisons test. (K) The frequencies of Annexin V–positive cells of control or sgHHEX-transduced MEG-01 and Kasumi-1 cells at day 4 (n = 4). Statistical analyses were performed by 1-way ANOVA with Tukey’s multiple comparisons test. Data are shown as mean ± SEM. *P < .05; **P < .01; ***P < .001; ****P < .0001.
Next, we assessed the role of HHEX in human leukemia cell lines with or without ASXL1 mutations. We here used 4 ASXL1-mutated cell lines (MEG-01, Kasumi-1, TS9;22, and NOMO-1) and 4 ASXL1-wildtype cells lines (THP1, U937, HL-60, and SKNO-1), respectively. We confirmed that CRISPR-Cas9-mediated depletion of ASXL1 inhibited growth of ASXL1-mutated cell lines, whereas ASXL1-wildtype cells showed only minor reduction of growth by ASXL1 depletion (supplemental Figure 7A-E). HHEX depletion attenuated the growth of all these ASXL1-mutated cell lines (Figure 4G-H). In contrast, the growth of ASXL1-wildtype leukemia cells was relatively insensitive to HHEX depletion (supplemental Figure 6F-G). We also confirmed that HHEX depletion promoted differentiation and apoptosis in MEG-01 and Kasumi-1 cells (Figure 4I-K; supplemental Figure 6H). These data indicated that endogenous HHEX promoted the survival of leukemia cells expressing ASXL1-MT via inhibiting differentiation and apoptosis.
To explore whether HHEX depletion affects CD34+ CB cells, we performed CRISPR-Cas9-mediated depletion of HHEX in human CD34+ CB cells by electroporation (supplemental Figure 8A). An sgRNA targeting CD45 was used as a control (supplemental Figure 8B). Both sgRNAs targeting HHEX (sgHHEX #1, sgHHEX #2) efficiently depleted HHEX protein (supplemental Figure 8C). We observed no significant differences for CD34 expression (supplemental Figure 8D), colony-forming activity (supplemental Figure 8E-F), myeloid cell expansion (supplemental Figure 8G), apoptosis (supplemental Figure 8H), cell cycle status (supplemental Figure 8I), and differentiation (supplemental Figure 8J-K) between control and HHEX-depleted CB cells. Thus, HHEX depletion has little impact on the proliferation or differentiation of CD34+ human CB cells.
Identification of HHEX binding loci and potential target genes
To investigate how HHEX expression contributes to myeloid transformation, we performed RNA-seq analysis using RUNX1-ETO–expressing human CB cells (supplemental Figure 3A). We transduced a control vector or ASXL1-MT (coexpressing GFP) and a control vector or HHEX (coexpressing NGFR) into RUNX1-ETO–expressing CB cells. The cells expressing both GFP and NGFR were sorted by FACS. Total RNA was then extracted from the cells and subjected to RNA-seq analysis. We identified 1424 upregulated and 1433 downregulated genes in the HHEX-expressed cells (Figure 5A). By analyzing the enrichment of Gene Ontology (GO) biological process terms in these differentially expressed genes, we found that the upregulated genes are significantly involved in the process of cell proliferation and cell cycle (Figure 5B). In contrast, the downregulated genes are related to the process of apoptosis and differentiation (Figure 5B). Gene set enrichment analysis (GSEA)33,34 revealed that genes related to leukemia stem cells were more enriched in cells expressing both ASXL1-MT and HHEX compared with control cells (Figure 5C), which was consistent with our observations in RUNX1-ETO9a and FLT3-ITD leukemia models shown in Figure 3F,I. On the contrary, genes related to monocytic differentiation were less enriched in cells expressing both ASXL1-MT and HHEX than control cells (Figure 5C). This also is consistent with our in vitro results that ASXL1-MT and HHEX inhibited monocytic differentiation shown in Figure 1I and supplemental Figure 1F-G.
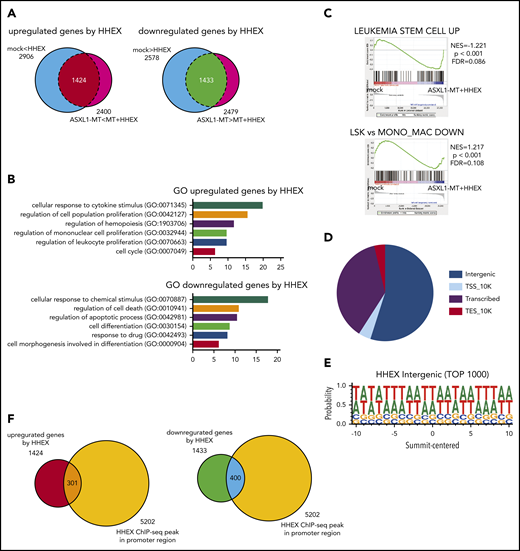
Identification of HHEX target genes by RNA-seq and ChIP-seq analyses. (A) Venn diagrams comparing differentially expressed genes by HHEX expression with or without ASXL1-MT in RNA-seq analysis using RUNX1-ETO–expressing CB cells (P < .05; Student t-test). Overlapped genes in Venn diagrams are defined as upregulated genes (left; 1424 genes) and downregulated genes (right; 1433 genes) by HHEX, respectively. (B) GO for upregulated and downregulated genes by HHEX expression in RUNX1-ETO–expressing cells. The x-axis shows the P value (−log10). Expression of HHEX upregulated genes related to the proliferation of leukocytes and cell cycle (top), and downregulated genes related to apoptosis and differentiation (bottom). (C) GSEA revealed that genes related to leukemia stem cells were more highly expressed in cells expressing ASXL1-MT and HHEX than control cells (upper). Genes enriched in monocyte/macrophage compared with LSK cells were more highly expressed in control cells than in cells expressing ASXL1-MT and HHEX (lower). (D) The pie chart showing distribution of binding sites identified by ChIP-seq analysis. (E) HHEX binding motif of identified by ChIP-seq analysis. (F) Venn diagrams showing overlapping between genes to which HHEX bound at promoter loci and genes upregulated (left) or downregulated (right) by HHEX. A total of 301 genes were identified as candidate genes directly upregulated by HHEX, whereas 400 genes were identified as ones directly downregulated by HHEX.
Identification of HHEX target genes by RNA-seq and ChIP-seq analyses. (A) Venn diagrams comparing differentially expressed genes by HHEX expression with or without ASXL1-MT in RNA-seq analysis using RUNX1-ETO–expressing CB cells (P < .05; Student t-test). Overlapped genes in Venn diagrams are defined as upregulated genes (left; 1424 genes) and downregulated genes (right; 1433 genes) by HHEX, respectively. (B) GO for upregulated and downregulated genes by HHEX expression in RUNX1-ETO–expressing cells. The x-axis shows the P value (−log10). Expression of HHEX upregulated genes related to the proliferation of leukocytes and cell cycle (top), and downregulated genes related to apoptosis and differentiation (bottom). (C) GSEA revealed that genes related to leukemia stem cells were more highly expressed in cells expressing ASXL1-MT and HHEX than control cells (upper). Genes enriched in monocyte/macrophage compared with LSK cells were more highly expressed in control cells than in cells expressing ASXL1-MT and HHEX (lower). (D) The pie chart showing distribution of binding sites identified by ChIP-seq analysis. (E) HHEX binding motif of identified by ChIP-seq analysis. (F) Venn diagrams showing overlapping between genes to which HHEX bound at promoter loci and genes upregulated (left) or downregulated (right) by HHEX. A total of 301 genes were identified as candidate genes directly upregulated by HHEX, whereas 400 genes were identified as ones directly downregulated by HHEX.
To investigate the regulatory effect of HHEX bindings, we next performed chromatin immunoprecipitation (ChIP) against an anti-HA antibody using 293T cells transfected with HA-tagged HHEX followed by next-generation sequencing (ChIP-seq). We found that HHEX bound mainly to the intergenic region and promoter region (Figure 5D). In addition, HHEX binds to AT-rich loci, which resembles specific homeobox factors including Hoxb5 and Mnx1 (Figure 5E; supplemental Figure 9A-B). From the ChIP-seq analysis, we identified that HHEX bound to the promoter regions of 5202 genes (Figure 5F). The 5202 genes included 25% of the differentially expressed genes; 301 upregulated genes and 400 downregulated genes (Figure 5F). These results imply that HHEX regulates target gene expression by binding at their promoters.
MYB and ETV5 were directly upregulated by ASXL1-MT and HHEX
To elucidate underlying molecular mechanisms by which the combination of ASXL1-MT and HHEX promotes myeloid leukemogenesis, we investigated target genes directly regulated by ASXL1-MT and HHEX. As ASXL1-MT induced gene upregulation via reducing H2AK119ub modifications,5 we focused on the upregulated genes by HHEX binding to promoter loci (Figure 5F). Among 301 upregulated genes, we found that MYB and ETV5 are upregulated by ectopic expression of HHEX in murine c-Kit+ cells and HL-60 cells (Figure 6A; supplemental Figure 10A). Meanwhile, Hhex depletion decreased expression of MYB and ETV5 in ASXL1-mutated AML, cSAM cells, cRAM cells, and MEG-01 cells, but not in ASXL1-wildtype AML THP1 cells (Figure 6B; supplemental Figure 10B-D). To further evaluate ASXL1-MT/BAP1 complex, we analyzed our previous RNA-seq data and found that ASXL1-MT/BAP1 complex increased MYB/ETV5 expression, but not HHEX expression (supplemental Figure 10E). In fact, depletion of ASXL1-MT increased the global level of H2AK119ub and reduced the expression of MYB and ETV5 in MEG-01 cells (supplemental Figure 10F-G). Consistent with mRNA expression data shown in Figure 6A, HHEX expression resulted in increased expression of MYB and ETV5 proteins in c-Kit+ BM cells (supplemental Figure 10H). On the contrary, HHEX depletion led to decreased expression of MYB and ETV5 proteins in cSAM/Cas9 cells (supplemental Figure 10I). Thus, HHEX upregulated MYB and ETV5 by binding promoter loci, which would be maintained by ASXL1-MT expression.
![ASXL1-MT and HHEX cooperatively upregulated Myb and Etv5. (A) c-Kit+ BM cells derived from control mice or ASXL1-MT KI mice were transduced with control/HHEX (coexpressing NGFR). NGFR-positive cells were sorted 48 hr after transduction. Relative mRNA level of Myb and Etv5 were analyzed by qRT-PCR. Results were normalized to Gapdh, with the relative mRNA level in vector-transduced cells set at 1 (n = 4-5). (B) Relative expression of Myb and Etv5 were assessed in vector- or sgHhex-transduced cSAM cells using qualitative reverse transcription-polymerase chain reaction (n = 4). Results were normalized to Gapdh, with the relative mRNA level in sgNT-transduced cells set at 1. (C) Expression correlation between HHEX and MYB/ETV5 mRNA expression in primary AML patients (Beat AML). (D) ChIP-seq reads across MYB and ETV5 promoter loci with 293T cells transfected with control vector (upper) or HA-HHEX (lower) against anti-HA antibody. HHEX bound to −2 kb of promoter loci of MYB and ETV5 in 293T cells. (E-G) ChIP-qPCR assay MYB and ETV5 locus in HL-60 cells. HL-60 cells were retrovirally transduced with vector/ASXL1-MT (coexpressing GFP) and vector/HA-HHEX (coexpressing NGFR). After sorting GFP+/NGFR+ cells, genomic DNA fragments from these cells were immunoprecipitated with anti-HA (E) and anti-H2AK119ub (F) antibodies (n = 4 each). (G) Genomic DNA fragments from vector/ASXL1-MT–expressing HL-60 cells were immunoprecipitated with anti-IgG or anti-HHEX antibody (n = 4 each). (H) HHEX directly increased promoter activity of MYB and ETV5 genes. 293T cells were cotransfected with a pGL4.71 vector (coexpressing firefly luciferase [FLuc]) plus either pGL4.1-MYB promoter locus or pGL4.1-ETV5 promoter locus (coexpressing Renilla luciferase [RLuc]) together with either HHEX or control vector. Luciferase assays were performed with a triplicate set. Statistical analyses were performed by 1-way ANOVA with Tukey’s multiple comparisons test. Data are shown as mean ± SEM. *P < .05; **P < .01; ***P < .001; ****P < .0001.](https://ash.silverchair-cdn.com/ash/content_public/journal/blood/136/14/10.1182_blood.2019004613/2/m_bloodbld2019004613f6.png?Expires=1769089778&Signature=Rh4LXtGMtWkdJwOalxR3JxOmf5JlrwLxzB3rhxIAdaNIYoTHgpfwJMw4nYFH5UjwOSfWmO3PkPCOCZvuzDSW-1w7wKfSXGe3GyIUckQywqKsdN3ItKLcQmUKcyBuu83aEUng4P5WwwGIEccRIaPN4wdZN~leHCdaQb~6Cw7hl4L6y2-yWqnbW82dBwCTBOb2lbzCh~d69lHp~0mmRjcEoAYI799eUpiQ5J8-XL-xy93-jwc9DHdqZ4XURAm1Kgo-HZe0kW9BYzK8Q2m9H5p42Rpfb5rhrOQflA1qdwIDOraVzD2I6L8hGM6HGxNjx5YauPN66Yw3fSLH0BgLJB3f1A__&Key-Pair-Id=APKAIE5G5CRDK6RD3PGA)
ASXL1-MT and HHEX cooperatively upregulated Myb and Etv5. (A) c-Kit+ BM cells derived from control mice or ASXL1-MT KI mice were transduced with control/HHEX (coexpressing NGFR). NGFR-positive cells were sorted 48 hr after transduction. Relative mRNA level of Myb and Etv5 were analyzed by qRT-PCR. Results were normalized to Gapdh, with the relative mRNA level in vector-transduced cells set at 1 (n = 4-5). (B) Relative expression of Myb and Etv5 were assessed in vector- or sgHhex-transduced cSAM cells using qualitative reverse transcription-polymerase chain reaction (n = 4). Results were normalized to Gapdh, with the relative mRNA level in sgNT-transduced cells set at 1. (C) Expression correlation between HHEX and MYB/ETV5 mRNA expression in primary AML patients (Beat AML). (D) ChIP-seq reads across MYB and ETV5 promoter loci with 293T cells transfected with control vector (upper) or HA-HHEX (lower) against anti-HA antibody. HHEX bound to −2 kb of promoter loci of MYB and ETV5 in 293T cells. (E-G) ChIP-qPCR assay MYB and ETV5 locus in HL-60 cells. HL-60 cells were retrovirally transduced with vector/ASXL1-MT (coexpressing GFP) and vector/HA-HHEX (coexpressing NGFR). After sorting GFP+/NGFR+ cells, genomic DNA fragments from these cells were immunoprecipitated with anti-HA (E) and anti-H2AK119ub (F) antibodies (n = 4 each). (G) Genomic DNA fragments from vector/ASXL1-MT–expressing HL-60 cells were immunoprecipitated with anti-IgG or anti-HHEX antibody (n = 4 each). (H) HHEX directly increased promoter activity of MYB and ETV5 genes. 293T cells were cotransfected with a pGL4.71 vector (coexpressing firefly luciferase [FLuc]) plus either pGL4.1-MYB promoter locus or pGL4.1-ETV5 promoter locus (coexpressing Renilla luciferase [RLuc]) together with either HHEX or control vector. Luciferase assays were performed with a triplicate set. Statistical analyses were performed by 1-way ANOVA with Tukey’s multiple comparisons test. Data are shown as mean ± SEM. *P < .05; **P < .01; ***P < .001; ****P < .0001.
ASXL1-MT and HHEX cooperatively upregulated Myb and Etv5. (A) c-Kit+ BM cells derived from control mice or ASXL1-MT KI mice were transduced with control/HHEX (coexpressing NGFR). NGFR-positive cells were sorted 48 hr after transduction. Relative mRNA level of Myb and Etv5 were analyzed by qRT-PCR. Results were normalized to Gapdh, with the relative mRNA level in vector-transduced cells set at 1 (n = 4-5). (B) Relative expression of Myb and Etv5 were assessed in vector- or sgHhex-transduced cSAM cells using qualitative reverse transcription-polymerase chain reaction (n = 4). Results were normalized to Gapdh, with the relative mRNA level in sgNT-transduced cells set at 1. (C) Expression correlation between HHEX and MYB/ETV5 mRNA expression in primary AML patients (Beat AML). (D) ChIP-seq reads across MYB and ETV5 promoter loci with 293T cells transfected with control vector (upper) or HA-HHEX (lower) against anti-HA antibody. HHEX bound to −2 kb of promoter loci of MYB and ETV5 in 293T cells. (E-G) ChIP-qPCR assay MYB and ETV5 locus in HL-60 cells. HL-60 cells were retrovirally transduced with vector/ASXL1-MT (coexpressing GFP) and vector/HA-HHEX (coexpressing NGFR). After sorting GFP+/NGFR+ cells, genomic DNA fragments from these cells were immunoprecipitated with anti-HA (E) and anti-H2AK119ub (F) antibodies (n = 4 each). (G) Genomic DNA fragments from vector/ASXL1-MT–expressing HL-60 cells were immunoprecipitated with anti-IgG or anti-HHEX antibody (n = 4 each). (H) HHEX directly increased promoter activity of MYB and ETV5 genes. 293T cells were cotransfected with a pGL4.71 vector (coexpressing firefly luciferase [FLuc]) plus either pGL4.1-MYB promoter locus or pGL4.1-ETV5 promoter locus (coexpressing Renilla luciferase [RLuc]) together with either HHEX or control vector. Luciferase assays were performed with a triplicate set. Statistical analyses were performed by 1-way ANOVA with Tukey’s multiple comparisons test. Data are shown as mean ± SEM. *P < .05; **P < .01; ***P < .001; ****P < .0001.
To explore the clinical implications of HHEX, MYB, and ETV5 expression in leukemia cells, we analyzed mRNA expression in human primary AML cells. HHEX, MYB, and ETV5 are highly expressed in primary AML patients regardless of the presence or absence of ASXL1 mutations (Beat AML)25 ; this indicates that high expression of HHEX, MYB, and ETV5 could contribute to the survival of AML cells (supplemental Figure 10J). Next, we investigated the correlation between HHEX and MYB/ETV5 mRNA expression in primary AML samples in the Beat AML cohort and found that HHEX and MYB/ETV5 mRNA were positively correlated (Figure 6C). These positive correlations were also confirmed in another cohort from TCGA35 (supplemental Figure 10K).
Next, we assessed whether the upregulation of Myb and Etv5 are directly regulated by ASXL1-MT and HHEX using ChIP-seq assay. ChIP-seq using 293T cells revealed that HHEX directly bound to Myb and Etv5 loci including the promoter region (Figure 6D). To validate this result in hematopoietic cells as well, we performed ChIP-qPCR assay using HL-60 cells expressing HA-tagged HHEX. HHEX bound to the Myb and Etv5 promoter region 2 kb upstream of the transcriptional start site (Figure 6E). Additionally, the level of H2AK119ub at Myb and Etv5 at the promoter loci was decreased (Figure 6F). Importantly, we found that expression of ASXL1-MT increased the binding of endogenous HHEX toward the Myb and Etv5 promoter loci (Figure 6G). HHEX expression did not change the global level of H2AK119ub (supplemental Figure 11A). In addition, we did not detect physical interaction between ASXL1-MT and HHEX (supplemental Figure 11B). To assess whether binding of HHEX alters the activity of the promoter at MYB and ETV5, we performed a reporter assay. Binding of HHEX increased the activity of promoter at MYB and ETV5, which was enhanced by the expression of ASXL1-MT and BAP1 (Figure 6H; supplemental Figure 11C). Thus, ASXL1-MT and HHEX directly upregulated the expression of MYB and ETV5 via activating promoter activity at these genes.
Upregulation of MYB and ETV5 was critical for leukemogenesis induced by ASXL1-MT and HHEX
To assess the roles of Myb and Etv5 in ASXL1-mutated leukemia cells, we depleted Myb and Etv5 using the CRISPR-Cas9 system in cSAM/Cas9 cells and cRAM/Cas9 cells. We first generated 2 independent sgRNAs each targeting murine Myb or Etv5. These sgRNAs efficiently depleted Myb or Etv5 protein both in cSAM/Cas9 cells and cRAM/Cas9 cells (Figure 7A,D). Depletion of Myb increased apoptosis and decreased colony-forming activity in both cSAM/Cas9 and cRAM/Cas9 cells (Figure 7B-C). Etv5 depletion promoted differentiation in cSAM/Cas9 and cRAM/Cas9 cells, thereby reducing their colony-forming activity (Figure 7E-F). These growth-inhibitory effects of MYB or ETV5 depletion were also observed in human ASXL1-mutated leukemia cell lines (supplemental Figure 12A-B). Thus, endogenous MYB and ETV5 play important roles in promoting the proliferation of ASXL1-mutated leukemia cells.
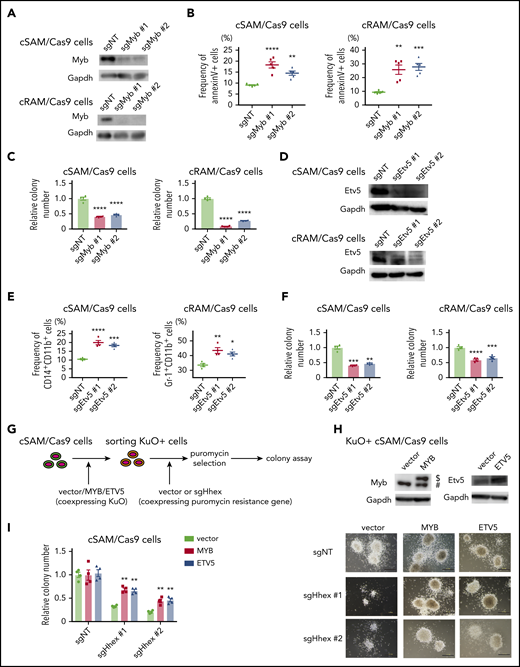
Myb and Etv5 expression were indispensable for ASXL1-MT induced myeloid leukemogenesis. (A) Levels of Myb protein in cSAM/Cas9 and cRAM/Cas9 cells transduced with NT or 2 independent Myb-targeting sgRNAs. Transduction of sgMyb #1 or sgMyb #2 resulted in profound reduction of Myb protein level in cSAM/Cas9 cells and cRAM/Cas9 cells. (B) Depletion of Myb promoted apoptosis in cSAM/Cas9 and cRAM/Cas9 cells at day 4 (n = 4). (C) Depletion of Myb reduced colony-forming activity in cSAM/Cas9 and cRAM/Cas9 cells (n = 5). (D) Levels of Etv5 protein in cSAM/Cas9 and cRAM/Cas9 cells transduced with NT or 2 independent Etv5-targeting sgRNAs. Transduction of sgEtv5 #1 or sgEtv5 #2 resulted in profound reduction of Myb protein level in cSAM/Cas9 cells and cRAM/Cas9 cells. (E) Depletion of Etv5 reduces colony-forming activity in cSAM/Cas9 and cRAM/Cas9 cells (n = 4). (F) Depletion of Etv5 promoted differentiation in cSAM/Cas9 and cRAM/Cas9 cells at day 4 (n = 4). (G) Schematic presentation of experiments in panels H and I. cSAM/Cas9 cells were transduced with vector/MYB/ETV5 (coexpressing KuO). Forty-eight hours after transduction, KuO+ cells were sorted by FACS. Sorted KuO+ cells were transduced with sgNT or Hhex-targeting sgRNAs (coexpressing puromycin resistance gene). After puromycin selection, cells were subjected to a colony-forming assay. (H) Cell lysates extracted from vector/MYB/ETV5-transduced cSAM/Cas9 cells were subjected to immunoblotting with anti-MYB (left), anti-ETV5 (right), and anti-GAPDH antibodies. $, Ectopically expressed MYB. #, Endogenous MYB. (I) Ectopic expression of MYB and ETV5 ameliorated colony-forming activity in Hhex-depleted cSAM/Cas9 cells (left; n = 4) and representative images of the colonies (scale bars, 1 mm). Data are shown as mean ± SEM. Statistical analyses were performed by 1-way ANOVA with Tukey’s multiple comparisons test. *P < .05; **P < .01; ***P < .001; ****P < .0001.
Myb and Etv5 expression were indispensable for ASXL1-MT induced myeloid leukemogenesis. (A) Levels of Myb protein in cSAM/Cas9 and cRAM/Cas9 cells transduced with NT or 2 independent Myb-targeting sgRNAs. Transduction of sgMyb #1 or sgMyb #2 resulted in profound reduction of Myb protein level in cSAM/Cas9 cells and cRAM/Cas9 cells. (B) Depletion of Myb promoted apoptosis in cSAM/Cas9 and cRAM/Cas9 cells at day 4 (n = 4). (C) Depletion of Myb reduced colony-forming activity in cSAM/Cas9 and cRAM/Cas9 cells (n = 5). (D) Levels of Etv5 protein in cSAM/Cas9 and cRAM/Cas9 cells transduced with NT or 2 independent Etv5-targeting sgRNAs. Transduction of sgEtv5 #1 or sgEtv5 #2 resulted in profound reduction of Myb protein level in cSAM/Cas9 cells and cRAM/Cas9 cells. (E) Depletion of Etv5 reduces colony-forming activity in cSAM/Cas9 and cRAM/Cas9 cells (n = 4). (F) Depletion of Etv5 promoted differentiation in cSAM/Cas9 and cRAM/Cas9 cells at day 4 (n = 4). (G) Schematic presentation of experiments in panels H and I. cSAM/Cas9 cells were transduced with vector/MYB/ETV5 (coexpressing KuO). Forty-eight hours after transduction, KuO+ cells were sorted by FACS. Sorted KuO+ cells were transduced with sgNT or Hhex-targeting sgRNAs (coexpressing puromycin resistance gene). After puromycin selection, cells were subjected to a colony-forming assay. (H) Cell lysates extracted from vector/MYB/ETV5-transduced cSAM/Cas9 cells were subjected to immunoblotting with anti-MYB (left), anti-ETV5 (right), and anti-GAPDH antibodies. $, Ectopically expressed MYB. #, Endogenous MYB. (I) Ectopic expression of MYB and ETV5 ameliorated colony-forming activity in Hhex-depleted cSAM/Cas9 cells (left; n = 4) and representative images of the colonies (scale bars, 1 mm). Data are shown as mean ± SEM. Statistical analyses were performed by 1-way ANOVA with Tukey’s multiple comparisons test. *P < .05; **P < .01; ***P < .001; ****P < .0001.
Finally, we investigated whether MYB and ETV5 are essential targets of HHEX in myeloid leukemogenesis. To this end, cSAM/Cas9 cells were first transduced with control vector, MYB, or ETV5 (coexpressing KuO). Then, KuO+ cells were then sorted and transduced with sgNT or Hhex-targeting sgRNAs followed by a colony-forming assay (Figure 7G-H). Intriguingly, ectopic expression of MYB or ETV5 ameliorated the reduction of colony-forming activity of cSAM/Cas9 cells induced by Hhex depletion (Figure 7I). Altogether, these data indicated that the upregulation of MYB and ETV5 are critical for leukemogenesis driven by ASXL1-MT and HHEX.
Discussion
In the previous study, we primarily identified HHEX as a candidate gene whose expression collaborates with ASXL1-MT in cellular transformation.12 In this study, we confirmed the functional collaboration between ASXL1-MT and HHEX. The combination of ASXL1-MT and HHEX induced AML with long latencies in about half of the transplanted mice, and it also promoted leukemogenesis induced by FLT3-ITD and RUNX1-ETO. Expression of HHEX promoted the myeloid transformation of ASXL1-mutated cells by inhibiting their differentiation and apoptosis and activating cell cycle progression, whereas differentiation and apoptosis/cell cycle arrest cannot be completely separated. Additionally, as shown in supplemental Figure 10J, we found that primary AML patients harboring ASXL1 mutations have higher HHEX expression compared with healthy controls. These data indicated that ASXL1-mutated preleukemic clones that have high expression of HHEX may be biologically selected and eventually transformed into leukemia cells, possibly with acquisition of additional mutations.
Moreover, we demonstrated that endogenous HHEX is required for the maintenance of ASXL1-mutated leukemia. In contrast, depletion of HHEX showed marginal growth inhibition in ASXL1-wildtype leukemia used in this study except for SKNO-1 cells (harboring a RUNX1-ETO fusion). Given that HHEX expression is generally high in AML, it is possible that HHEX could collaborate with various mutations other than ASXL1-MT, including RUNX1-ETO. We also found that HHEX-depleted CD34+ CB cells showed normal myeloid proliferation and differentiation, which is consistent with the previous reports that HHEX is dispensable for adult myelopoiesis in mice.19 Thus, HHEX could be a potential therapeutic target in AML, in particular ASXL1-mutated AML. In addition, the results presented in this study demonstrate that ASXL1-MT promotes the proliferation of the human ASXL1-mutated cell lines, although to formally prove this, gene-editing mediated repair of ASXL1 mutations will need to be demonstrated in a future study.
HHEX is one of the homeobox factors and is highly expressed in various subtypes of myeloid leukemia.19 However, it is not fully understood how HHEX contributes to myeloid leukemogenesis. Using transcriptome analyses, we demonstrated that HHEX activated genes related to the proliferation of myeloid cells. Moreover, coexpression of ASXL1-MT and HHEX induced the upregulation of genes involved in leukemia stem cells. In line with these observations, coexpression of HHEX and ASXL1-MT enriched immature fractions and accelerated the development of myeloid leukemia driven by RUNX1-ETO and FLT3-ITD. In RUNX1-ETO AML, ASXL1 mutations are frequently found as well as ASXL2 mutations.26 Although FLT3-ITD mutations are not prevalent in ASXL1-mutated AML, a recent study showed that ASXL1 mutations are found in 31 of 328 AML (9.5%). The clinical significance of ASXL1 mutations in FLT3-ITD AML are warranted in a future study.
In mammalian cells, the binding sites of HHEX were not clearly defined. Our ChIP-seq analysis demonstrated that HHEX exclusively binds to AT-rich regions in mammalian cells. The motif where HHEX binds showed high similarities to other homeobox transcriptional factors, such as homeobox B5 (HOXB5) and motor neuron and pancreas homeobox 1 (MNX1). HOXB5 efficiently marks long-term hematopoietic stem cells,36 and MNX1 is aberrantly expressed in t(7; 12) AML and blocks differentiation of HSPCs.37 According to previous reports, HHEX has been considered a repressive transcriptional factor that silences genes such as PDX1, CDX1b, and CDKN2A.22,38 However, our data suggest that binding of HHEX at promoter loci is involved in gene activation as well.
A recent report showed that the ASXL1/BAP1 complex is involved in gene activation by removing the H2AK119ub modification.39 ASXL1-MT, but not wild-type ASXL1, induces aberrant gene activation by enhancing the catalytic activity of BAP1.5,9 Along with these findings, expression of ASXL1-MT/BAP1 complex significantly upregulated the expression of MYB and ETV5, although the upregulation of MYB in c-Kit+ cells is minor. On the contrary, depletion of ASXL1-MT in MEG-01 cells significantly reduced the expression of MYB, indicating that ASXL1-MT is important for maintaining MYB expression in leukemia cells. Consistent with the clinical data that HHEX expressions are not different between ASXL1-MT and ASXL1-WT AML, our data indicated that HHEX is not the target of ASXL1-MT/BAP1 complex. However, our data also suggested that ASXL1-MT enhanced binding of HHEX to the promoter loci of MYB and ETV5 by reducing H2AK119ub. Interestingly, we also revealed that ASXL1-MT/BAP1 complex enhances the promoter activity in the reporter assay, which might be a result of the unknown mechanisms independent of histone modifications (eg, recruiting other transcriptional factors). This hypothesis should be verified in the future study.
MYB is known to enhance self-renewal activity in leukemia stem cells.40 Recently, several studies have developed MYB-targeting drugs to treat myeloid leukemia.41,42 Our study showed that MYB depletion in ASXL1-mutated leukemia cells strongly induced apoptosis. ETV5 is known to contribute to proliferation and differentiation block in B-ALL.43,44 However, the role of ETV5 in myeloid leukemogenesis remained elusive. In this study, we demonstrated that the depletion of ETV5 promoted myeloid differentiation of ASXL1-mutated leukemia cells.
Collectively, we demonstrated that HHEX promotes leukemogenesis and survival of leukemia cells expressing ASXL1-MT via the upregulation of MYB and ETV5. Our study suggests that inhibition of the HHEX-MYB/ETV5 axis would be a promising therapeutic approach for myeloid malignancies harboring ASXL1 mutations.
The data that support the findings of this study are available from the authors upon request.
The A-seq and ChIP-seq data sets reported in this article have been deposited in the Gene Expression Omnibus database (accession number GSE 147656).
The online version of this article contains a data supplement.
The publication costs of this article were defrayed in part by page charge payment. Therefore, and solely to indicate this fact, this article is hereby marked “advertisement” in accordance with 18 USC section 1734.
Acknowledgments
The authors thank Akiho Tsuchiya and Shiori Shikata for expert technical assistance. The authors are grateful to Naoki Goshima for providing plasmids regarding HHEX constructs. The authors are grateful to Yuichi J. Machida for providing plasmids regarding BAP1 constructs. MSCV-puro-N3FLAG-MYB-FL was a gift from Christopher Vakoc (Addgene plasmid # 105596). pLX_TRC311 ETV5 was a gift from William Hahn (Addgene plasmid # 74984). The authors are grateful to Hiroshi Kimura for the kind gift of the antihistone H3 antibody. The authors thank the FACS Core and the Mouse Core at the Institute of Medical Science, The University of Tokyo. The authors thank the Oregon Health & Science University for providing sequencing data from the Beat AML study, and The Cancer Genome Atlas for providing public gene expression data of AML.
This work was supported by a grant from IMSUT International Joint Project (T.K.), a grant from The Japanese Society of Hematology Research Grant (T.K.), a grant from Princess Takamatsu Cancer Research Fund (S.G.), a grant-in-aid from the Japan Society for the Promotion of Science for a postdoctoral fellowship (S.A.; 19J01570), and a grant from the Deutsche Forschungsgemeinschaft (H.J.B.).
Authorship
Contribution: R.T. performed most of the experiments, analyzed and interpreted the data, and wrote the manuscript; S.A. conceived the project, designed and performed the experiments, analyzed and interpreted the data, and wrote the manuscript; S.-J.P. and K.N. analyzed ChIP-seq data and edited the manuscript; A.Y., A.K., and T.I. performed ChIP-seq experiments; H.J.B., Y.T., and S. Yamazaki performed gene editing of cord blood cells; V.V., C.H., and J.P.M. analyzed data from the patients’ samples and edited the manuscript; A.M., S. Yamasaki, and T.S. performed RNA-seq experiments; Y.H., T.Y., M.T., and T. Fukushima assisted with experiments; T. Fukuyama, D.I., and H.H. advised on data interpretation; and S.G. and T.K. conceived and supervised the project, interpreted the data, and participated in writing the manuscript.
Conflict-of-interest disclosure: The authors declare no competing financial interests.
Correspondence: Shuhei Asada, Tokyo Women’s Medical University, 8-1 Kawada-cho, Shinjuku-ku, Tokyo 1628666, Japan; e-mail: shiasada-tky@umin.ac.jp; and Toshio Kitamura, The Institute of Medical Science, The University of Tokyo, 4-6-1 Shirokanedai, Minato-ku, Tokyo 1088639, Japan; e-mail: kitamura@ims.u-tokyo.ac.jp.

This feature is available to Subscribers Only
Sign In or Create an Account Close Modal