

Key Points
Pegylated-rIFN-α2a can achieve an ORR of 69% and 60% in ET and PV patients, respectively, previously treated with hydroxyurea.
The presence of a CALR mutation was associated with superior CR rates in ET patients treated with pegylated-rIFN-α2a.

Abstract
Prior studies have reported high response rates with recombinant interferon-α (rIFN-α) therapy in patients with essential thrombocythemia (ET) and polycythemia vera (PV). To further define the role of rIFN-α, we investigated the outcomes of pegylated-rIFN-α2a (PEG) therapy in ET and PV patients previously treated with hydroxyurea (HU). The Myeloproliferative Disorders Research Consortium (MPD-RC)-111 study was an investigator-initiated, international, multicenter, phase 2 trial evaluating the ability of PEG therapy to induce complete (CR) and partial (PR) hematologic responses in patients with high-risk ET or PV who were either refractory or intolerant to HU. The study included 65 patients with ET and 50 patients with PV. The overall response rates (ORRs; CR/PR) at 12 months were 69.2% (43.1% and 26.2%) in ET patients and 60% (22% and 38%) in PV patients. CR rates were higher in CALR-mutated ET patients (56.5% vs 28.0%; P = .01), compared with those in subjects lacking a CALR mutation. The median absolute reduction in JAK2V617F variant allele fraction was −6% (range, −84% to 47%) in patients achieving a CR vs +4% (range, −18% to 56%) in patients with PR or nonresponse (NR). Therapy was associated with a significant rate of adverse events (AEs); most were manageable, and PEG discontinuation related to AEs occurred in only 13.9% of subjects. We conclude that PEG is an effective therapy for patients with ET or PV who were previously refractory and/or intolerant of HU. This trial was registered at www.clinicaltrials.gov as #NCT01259856.
Introduction
Polycythemia vera (PV) and essential thrombocythemia (ET) are BCR-ABL1–negative myeloproliferative neoplasms. Both diseases are characterized by a clonal myeloid proliferation with excessive production of blood elements.1 They are characterized by various degrees of erythrocytosis, thrombocytosis, leukocytosis, systemic symptoms, and extramedullary hematopoiesis. The hallmarks of ET and PV include an increased risk of thrombohemorrhagic complications, and a variable risk of transformation to myelofibrosis (MF) and/or acute myeloid leukemia (AML).2,3
Therapeutic approaches to these diseases have predominantly addressed the importance of thrombohemorrhagic risk mitigation with cytoreductive therapy, as well as aspirin, in the appropriate patients. The study of disease-modifying agents has been challenging, owing to several barriers, including the relative rarity of these neoplasms, the difficulty of enrolling patients in multicenter clinical trials, different response criteria used across trials, and the relatively indolent nature of these diseases, thereby accentuating the need to identify clinically meaningful surrogate end points.
Hydroxyurea (HU) is generally accepted as front-line therapy for high-risk ET and PV patients. Because a significant number of patients are either intolerant of HU because of hematologic or nonhematologic toxicity or resistant because of a lack of effective cytoreduction, alternative therapeutic agents are clearly needed.4,5 HU resistance is associated with an inferior prognosis, increased mortality, and increased rate of transformation to more advanced myeloproliferative neoplasm (MPNs).4 IFNs, and, more recently, recombinant pegylated IFN-α, have been explored as alternatives to HU. Several clinical trials have shown promising response rates; however, these trials have also reported side effects leading to significant rates of therapy cessation.6-21
We carried out a prospective phase 2 trial through the Myeloproliferative Disorders Research Consortium (MPD-RC) to investigate the response rates and toxicity profile of recombinant pegylated IFN alfa-2a (peg-rIFN alfa-2a; Pegasys, PEG).
Patients and methods
MPD-RC 111 was an international, multicenter, phase 2, open-label clinical trial (clinicaltrials.gov #NCT01259817) that was conducted at participating sites in North America and Europe. The study was approved by the institutional review boards or ethics committees of each institution and was conducted according to the criteria set by the Declaration of Helsinki. Each subject signed an informed consent document before participating in the trial.
The diagnosis of ET or PV was established using criteria outlined by the World Health Organization (WHO) 2008.22 High-risk features included a history of thrombosis; age >60 years; a history of bleeding (ET only); platelet counts, >1500 × 109/L in ET and >1000 × 109/L in PV; vasomotor symptoms (erythromelalgia, severe migraine headaches); significant or symptomatic splenomegaly; and the presence of diabetes or uncontrolled hypertension. The patients enrolled were resistant to and/or intolerant of HU, according to previously published criteria.23 These criteria include failure to achieve adequate cytoreduction (platelet count, ≥600 × 109/L; hematocrit [HCT], >45% or continued need for therapeutic phlebotomy; or white blood cell [WBC] count, >10 × 109/L), the development of or progression of splenomegaly, development of major thrombotic episodes ,despite the maximum tolerated dose (MTD) of HU, or development of hematologic or nonhematologic toxicities at any dose of HU. The study also included an additional group of 20 patients who had experienced a splanchnic vein thrombosis, regardless of treatment history, which was reported separately.
Patients were excluded if they had received previous therapy for ET and PV with an agent other than HU, had had prior therapy with IFN, or had contraindications to IFN therapy, such as an uncontrolled autoimmune disorder, uncontrolled depression, or severe retinal disease. The study was designed to accrue 84 patients each with ET or PV for a total of 168 patients, but because of lack of study drug availability, the study was closed to accrual in December 2016 after 115 patients were enrolled from February 2012 through December 2015.
An intention-to-treat (ITT) response evaluation was performed every 12 months. Patients who achieved at least a partial response (PR) remained on treatment and were observed for a maximum of 4 years. All enrolled patients were included in response assessments. The primary end point consisted of complete response (CR) and PR (overall response rate, ORR) at 12 months, as determined by European LeukemiaNet (ELN) criteria,24 which define CR as correction of the platelet count to <400 × 109/L, HCT to <45% without phlebotomy (for PV patients only), and WBC to <10 × 109/L; resolution of splenomegaly; and resolution of disease-related symptoms (defined as microvascular disturbances, headache, and pruritus). Responses were assessed by a blinded central review committee. Secondary end points included the evaluation of toxicity, safety, and tolerability of PEG; the impact of PEG on key disease biomarkers; the incidence of disease transformation; the evaluation of changes in bone marrow (BM) histopathology, quality of life (QoL), and patient-reported symptoms; and the assessment of major cardiovascular events.
Patients completed a comprehensive assessment of myeloproliferative neoplasm (MPN)-associated symptoms (the Myeloproliferative Neoplasm Symptom Assessment Form [MPN-SAF]), an assessment of functionality and QoL (The European Organisation for Research and Treatment of Cancer Quality of Life Questionnaire-Core 30 [EORTC QLQ-C30]), and 5 exploratory questions to assess PEG-related side effects on a serial basis (baseline, 3, 6, 9, 12 months).
PEG was generously provided by Roche/Genentech Pharmaceuticals. The drug was administered subcutaneously at a starting dose of 45 µg weekly and titrated monthly in 45-µg increments for response up to a maximum of 180 µg weekly. Dose escalation occurred when the criteria for CR and dose-limiting toxicity were not met. Subjects with a CR or PR at month 12 were eligible to continue treatment at the same dose until loss of response, unacceptable toxicity, patient/physician decision, or completion of the study period at 4 years. Subjects with no response or stable disease at month 12 did not continue receiving treatment.
Disease biomarkers
BM histopathology, karyotype analyses, and gene mutation analyses were performed at baseline, after 12 and 24 months, and at the end of study. The BM biopsies were examined by an expert hematopathologist without knowledge of the clinical or molecular responses. Histomorphologic remission was defined according to ELN criteria and the revised ELN-International Working Group consensus criteria.25 Next-generation sequencing (NGS) was performed with a targeted sequencing panel designed to capture 156 genes implicated in myeloid malignancies.26 DNA was derived from the peripheral blood mononuclear cell fraction. Samples were sequenced on the Illumina HiSeq 4000 system with an average target depth of 992× (126 bp paired-end reads). The raw sequence data were aligned to the GRCh37 reference genome using the BWA-MEM algorithm (v. 0.7.12-r1039).27 Candidate substitutions and insertions and deletions were called using cgpCaVEMan (v. 1.7.4) and cgpPindel (v. 1.5.4). Candidate mutations were compared with COSMIC (v. 81),28 ExAC (v. 03.12)29 and 1000 Genomes (phase 3 release),30,31 to manually assess each variant and classify it as pathogenic, likely pathogenic, or variant of uncertain significance (VUS). The variants presented in this study were identified as pathogenic or likely to be pathogenic. Copy number alterations were called using the CNVkit algorithm (v.0.8.5).32 Normalized log-ratio plots were assessed to identify chromosomal changes into gains and losses.
Statistical analysis
For each disease cohort, a 50% ORR achieved during the first 12 months was considered acceptable. With the original sample size of 84 patients in each cohort, a difference in ORR from 35% to 50% provided 80% power (α = 0.05). Patients who dropped out prior to 12 months for lack of response, tolerability, or complications were considered nonresponders (NRs). Baseline demographics, clinical characteristics, and baseline mutational status were reported for ET and PV patients. Maximum grade adverse events (AEs) were summarized, regardless of attribution. Responses at 12 months were reported and ORR (CR+PR) along with exact 95% confidence intervals (CIs) were reported. For each cohort, an independent z test was conducted to test the null hypothesis that the ORR was equal to 35%. Clinical variables were examined according to clinical response using the independent-samples Student t test or the χ2 test for frequency data. Logistic regression was used to examine the association of CR at 12 months with patient demographic and clinical characteristics. Incidence of vascular events and second cancers were estimated using cumulative incidence. Patient-reported outcome measurements were scored according to published scoring algorithms. Within-group changes and between-group differences over time were assessed by mixed models adjusted for age. Analysis of covariance (ANCOVA) adjusting for baseline scores compared 12-month score between patients with a CR vs those with PR/NR.
Results
Patients
A total of 115 patients (ET, 65; PV, 50) participated in the study. The median patient age was 64.0 years. The median time from diagnosis was 37.3 months for ET and 54.8 months for PV. Seventy-seven (67.5%) patients were classified as HU-intolerant, and 37 (32.5%) were HU-resistant (Table 1). Prior thrombosis was present in 32.3% of ET patients and in 22% of PV patients. Seven (ET, 4; PV, 3) of 32 patients had an event during the year prior to enrollment (transient ischemic attack, 2; deep venous thrombosis, 1, other, 4). A palpable spleen was present in 16.9% of ET patients and in 44% of PV patients. In these patients, median spleen length was 7.0 cm (range, 1-23) below the left costal margin by palpation and 16.0 cm (range, 7-28 cm) by ultrasound imaging. Despite meeting the criteria for HU intolerance or resistance, 63.5% of patients remained on HU at the time of enrollment.
Baseline characteristics
| Characteristic | ET (n = 65) | PV (n = 50) | Total (N = 115) |
|---|---|---|---|
| Sex | |||
| Female | 33 (50.8) | 24 (48.0) | 57 (49.6) |
| Male | 32 (49.2) | 26 (52.0) | 58 (50.4) |
| Age >60 y* | 38 (58.5) | 33 (66.0) | 71 (61.7) |
| Race | |||
| White | 54 (83.1) | 47 (94.0) | 101 (87.8) |
| Black or African American | 6 (9.2) | 2 (4.0) | 8 (7.0) |
| Asian | 2 (3.1) | 0 | 2 (1.7) |
| Not reported | 3 (4.6) | 1 (2.0) | 4 (3.5) |
| ECOG performance status (grade) | |||
| 0 | 44 (67.7) | 33 (66.0) | 77 (67.0) |
| 1 | 21 (32.3) | 16 (32.0) | 37 (32.2) |
| 2 | 0 (0.0) | 1 (2.0) | 1 (0.9) |
| Previous thrombosis | 21 (32.3) | 11 (22.0) | 32 (27.8) |
| Previous hemorrhage | 7 (10.8) | 6 (12) | 13 (11.2) |
| Splenomegaly | 12 (18.5) | 28 (56.0) | 40 (34.8) |
| Disease duration in months since diagnosis, median (range) | 37.3 (0.4-291) | 54.8 (0.5-394) | 42.3 (0.5-394) |
| HU resistant | 20 (31.3) | 17 (34.0) | 37 (32.5) |
| Not achieving platelet count <600 × 109/L† | 15 (75) | 4 (23.5) | 19 (51.4) |
| Progressive splenomegaly or hepatomegaly or new splenomegaly or hepatomegaly† | 2 (10) | 7 (44.2) | 9 (24.3) |
| Not achieving a HCT <45 without phlebotomy† | 2 (10) | 5 (29.4) | 7 (18.9) |
| Not achieving a WBC <10 × 109/L† | 5 (29.4) | 2 (10) | 7 (18.9) |
| Development of a major thrombotic episode† | 7 (35.0) | 2 (11.8) | 9 (24.3) |
| HU intolerant | 44 (68.8) | 33 (66.0) | 77 (67.5) |
| WBC < 2.5 × 10⁹/L or hemoglobin <11 g/dL at any dose of HU | 11 (25.0) | 6 (18.2) | 17 (22.1) |
| Having a platelet count <100 × 109/L | 1 (2.3) | 3 (9.1) | 4 (5.2) |
| Presence of leg ulcers or other unacceptable HU-related nonhematological toxicities | 37 (84.1) | 25 (75.8 | 62 (80.5) |
| HU therapy discontinued | 26 (40.0) | 16 (32.0) | 42 (36.5) |
| HU therapy ongoing | 39 (60.0) | 34 (68.0) | 73 (63.5)‡ |
| WBC (×109/L), median (range) | 7.4 (2.4-55.7) | 11.1 (2.3-45.3) | 8.5 (2.3-55.7) |
| Platelets (×109/L), median (range) | 609 (124-1899) | 378 (15.2-1698) | 485 (15.2-1899) |
| HCT %, median (range) | 39.4 (40-53.7) | 44 (27.5-55.8) | 41 (40-55.8) |
| Driver mutations, n | |||
| JAK2V617F | 31 | 48 | — |
| CALR | 23 | — | — |
| MPL | 4 | 1 | — |
| Triple negative or unavailable | 8 | 2 | — |
Data are n (%), unless otherwise noted.
Median: 64.0 y (range, 20-85).
After 3 months of at least 2 g/d of HU or MTD of HU.
‡Median: 22.5 months (range, 1.0-153).
NGS was performed on baseline samples from 110 patients for whom baseline sequencing data were available. In total we identified 239 mutations in 45 genes in 110 baseline samples. Among MPN driver mutations, activating JAK2 mutations were most frequent (72%), followed by CALR mutations (21%) and MPL mutations (5%; Figure 1; Table 1). A median of 3 variants were observed per baseline sample. Frequent mutations in other known cancer genes included TET2 (17%), TP53 (9%), DNMT3A (9%), and ASXL1 (8%) (Figure 1; supplemental Figure 1; available on the Blood Web site). The median JAK2V617F variant allele frequency (VAF) at baseline was 29% (1%-96%).
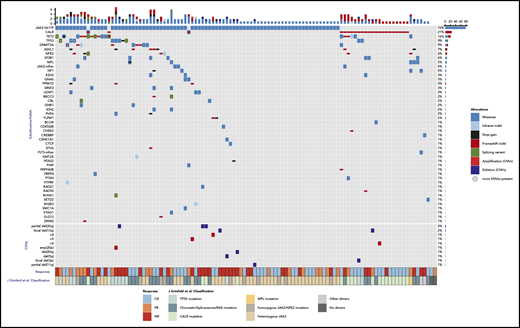
Genomic profile of somatic mutations and copy number variants (CNVs) in baseline samples, as detected by NGS data. Each column represents a patient (n = 110) and each row represents a gene that is mutated in at least 2 patients (n = 22). In the bottom of the figure, each row represents a CNV event (n = 10). The bar plot (top) indicates the number of somatic mutation(s) per patient, colored according to the type of the alteration. The bar plot on the right shows the number of somatic mutations per gene (top) or CNV event (bottom). The frequency of mutations in the cohort is listed on the left border of the figure. The clinical response to treatment is displayed in the annotation bar at the lower axis of the figure according to the legend. The second annotation bar at the bottom panel denotes the classification of each patient according to the molecular classification criteria.34
Genomic profile of somatic mutations and copy number variants (CNVs) in baseline samples, as detected by NGS data. Each column represents a patient (n = 110) and each row represents a gene that is mutated in at least 2 patients (n = 22). In the bottom of the figure, each row represents a CNV event (n = 10). The bar plot (top) indicates the number of somatic mutation(s) per patient, colored according to the type of the alteration. The bar plot on the right shows the number of somatic mutations per gene (top) or CNV event (bottom). The frequency of mutations in the cohort is listed on the left border of the figure. The clinical response to treatment is displayed in the annotation bar at the lower axis of the figure according to the legend. The second annotation bar at the bottom panel denotes the classification of each patient according to the molecular classification criteria.34
Baseline MPN symptoms and QoL
Of the 115 patients, 114 (ET, 64; PV, 50) completed baseline symptom and QoL assessments. Mean MPN-SAF Total Symptom Score (TSS scale, 0 [absent]-100 [worst imaginable]33 ) was 19.5 (SD 18.4; range, 0-95) with means of 19.0 (SD 18.1) and 20.1 (SD 19.0) for ET and PV (P = .76), respectively, similar to reported means of a previous cohort receiving any line of treatment (ET mean, 18.7, SD 15.3; PV mean, 21.8, SD 16.3). The most common baseline symptoms were fatigue (106/114, 93%) and insomnia (74/114, 65%). The mean QLQ-C30 Global Health Status/QoL (GHS/QoL scale, 0 [very poor]-100 [excellent]) was 71.6 (SD 20.1). Baseline TSS and GHS/QoL did not significantly differ between ET and PV, nor among patients with different driver mutations (TSS, 19.5 (17.0): JAK2 vs 14.9 (13.5) CALR, P = .25; QoL 72.7 (20.0): JAK2 vs 68.1 (22.8) CALR, P = .36).
Responses
Primary end point
All 115 patients were included in ITT response assessment at 12 months. Patients removed from treatment because of withdrawal of consent or significant AEs that precluded any effective therapy were considered NRs for purposes of response assessment at 12 months. Median follow-up time was 19.6 months (range, 0.6-56.6).
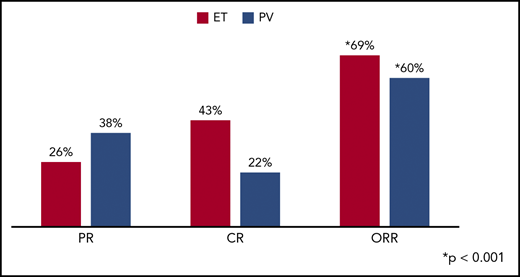
In ET patients, CR and PR at 12 months were observed in 28 (43.1%) and 17 (26.2%) patients, for an ORR of 69.2% (95% CI, 56.6%-80.0%), which differed significantly from the null hypothesis of 35% (z = 5.79; P < .001). In PV patients, 11 (22%) attained a CR and 19 (38%) a PR, for an ORR of 60% (95% CI, 45.2%-73.6%), which also differed significantly from 35% (z = 3.71; P < .001; Figure 2). The best response (ORR) at any time point was 70.8% (95% CI, 58.2%-81.4%) for ET patients and 64.0% (95% CI, 49.2%-77.1%) for PV patients; 96.2% of all clinical responses were achieved within 12 months of treatment. At 12 months, 23 of 50 (46%) PV patients had achieved ≤45% HCT. In PV patients, 27 of 50 (54%) were receiving phlebotomy at enrollment with a median of 2.0 (range, 1-12) phlebotomies in the prior 6 months before enrollment. In these patients, the median number of phlebotomies was 1.0 (range, 0-6) during the first 6 months of study; 10 of 27 were phlebotomy independent during these 6 months. At 12 months, 45 of 65 (69.2%) ET patients had achieved a platelet count ≤400 × 109/L.
Response at 12 months was examined in relation to clinical factors. Age, HU resistance vs intolerance, maximum dose of PEG, and disease duration were not predictors of attaining CR (Table 2). Patients with ET had higher CR rates than those with PV (43% vs 22%; odds ratio [OR], 2.68; 95% CI, 1.17-6.15). CR rates were higher in CALR-mutated patients than in patients without a CALR mutation (56.5% vs 28.0%, P = .01; OR, 3.34; 95% CI, 1.28-8.67). Of the 11 ET and PV patients with baseline TP53 mutations, only 3 achieved a CR. Of the 8 patients with the ASXL1 mutation, 3 achieved CR, 2 achieved PR, and 3 were NR.
Clinical factors and association with CR at 12 months
| Risk factor | Events/patients, n (%) | OR (95% CI) |
|---|---|---|
| Age (continuous) | — | 1.02 (0.99-1.05) |
| Disease type | ||
| PV | 11/50 (22) | 2.68 (1.17-6.15) |
| ET | 28/65 (43) | — |
| Gender | ||
| Male | 20/57 (35) | 0.90 (0.42-1.95) |
| Female | 19/58 (33) | — |
| HU group | ||
| Resistant | 10/37 (27) | 1.54 (0.65-3.65) |
| Intolerable | 28/77 (36) | — |
| Prior thrombosis (disease-related) | ||
| Yes | 10/32 (31) | 1.18 (0.49-2.83) |
| No | 29/83 (35) | — |
| Disease duration (continuous) | — | 0.99 (0.98-1.00) |
| Maximum dose PEG received, µg/wk | ||
| 45 | 8/26 (31) | 1.39 (0.47-4.11) |
| 90 | 13/34 (38) | 1.39 (0.41-4.65) |
| 135 | 8/21 (38) | 0.98 (0.32-2.99) |
| 180 | 10/33 (30) | — |
| ECOG performance status, grade | ||
| 0 | 26/77 (34) | 1.02 (0.45-2.32) |
| 1/2 | 13/38 (34) | — |
| CALR mutation | ||
| No | 23/82 (28) | 3.34 (1.28-8.67) |
| Yes | 13/23 (56) | — |
| JAK2 mutation | ||
| No | 14/26 (54) | 0.33 (0.13-0.83) |
| Yes | 22/79 (28) | — |
Spleen responses
Of 52 patients with a baseline spleen size >13 cm by imaging, 17 (32.7%) had normalization (decrease to <13 cm on imaging) with treatment. The median absolute change in spleen size was only 2%.
Number of vascular events
No major bleeding events occurred during the study period. Cumulative incidence of major vascular events at 1 year was 2% (95% CI, 1%-8%) and at 2 years was 5% (95% CI, 2%-15%) and consisted of a grade 3 venous thromboembolic event, grade 3 cardiovascular disease, and 2 coronary artery occlusions: 1 grade 2 and 1 grade 3 myocardial infarction.
Evolution of disease
One patient with ET transformed to AML within 8 weeks of therapy, but the baseline BM biopsy favored a diagnosis of prefibrotic MF rather than ET. Transformation to MF occurred in 1 PV patient.
BM response
Seventy-four patients were evaluated for BM response. Histopathologic remission was observed in 9 patients (12.2%; ET, 5; PV, 4). Histopathologic remissions were associated with a hematologic PR/CR in 8 of the 9 patients. In 7 patients, BM fibrosis progressed to grade 2+ (scale, 0-3+) while they were receiving PEG therapy, but only 1 patient met clinical criteria for transformation to MF. The remaining patients had stable degrees of BM fibrosis.
Cytogenetic and molecular response
Seventeen patients had abnormal baseline karyotype, and 4 were noted to have changes in their chromosomal abnormalities with PEG treatment (supplemental Table 1). One patient with PV and a normal karyotype at baseline developed +8 and +9. Three PV patients, all harboring JAK2V617F, lost part, or all, of their clonal karyotypic abnormalities on treatment, and all 3 achieved a CR at 12 months.
Analysis of JAK2V617F allele burden revealed that patients with CR had a significantly lower VAF at baseline compared with those who achieved NR (Figure 3A). Decreases in the JAK2V617F VAF appeared to be greater among patients achieving a clinical response (Figure 3B). The median absolute change in JAK2V617F VAF was −6% (range, −84% to 47%) in patients achieving a CR vs +4% (range, −18% to 56%) in those with PR and NR (Figure 3B; supplemental Figure 2). A similar pattern of enrichment for CR among patients with a decreased CALR VAF was noted, but because of the small number of patients with CALR mutations (n = 21), this finding was not statistically significant (supplemental Figure 3).
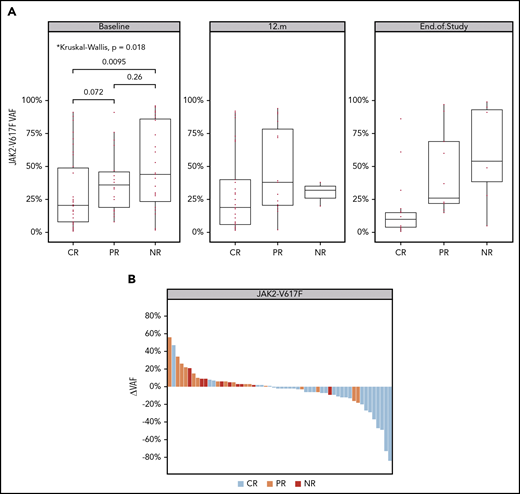
Changes in mutant JAK2 (p.V617F) VAF over time. (A) VAF in evaluable samples at baseline, month 12, and end of study. The added P-values highlight a significant difference in median JAK2V617F VAF between CR and NR groups in baseline samples (Wilcoxon test; P = 9.51e-03). (B) JAK2V617F VAF waterfall plot. The y-axis indicates the absolute change of JAK2V617F VAF from baseline to last sample. Each bar represents a patient, highlighted by the best clinical response (as described in the color key). Analysis of the number of patients with increased and decreased VAF between groups indicates that the chance of achieving CR is 15 times higher for patients with a reduced JAK2V617F allele burden (Fisher’s exact test; P = 9.071e-06; OR, 15).
Changes in mutant JAK2 (p.V617F) VAF over time. (A) VAF in evaluable samples at baseline, month 12, and end of study. The added P-values highlight a significant difference in median JAK2V617F VAF between CR and NR groups in baseline samples (Wilcoxon test; P = 9.51e-03). (B) JAK2V617F VAF waterfall plot. The y-axis indicates the absolute change of JAK2V617F VAF from baseline to last sample. Each bar represents a patient, highlighted by the best clinical response (as described in the color key). Analysis of the number of patients with increased and decreased VAF between groups indicates that the chance of achieving CR is 15 times higher for patients with a reduced JAK2V617F allele burden (Fisher’s exact test; P = 9.071e-06; OR, 15).
We further sought to determine whether classification of patients by a recently described molecular prognostic system for MPNs predicted response to therapy in this cohort.34 The most frequent classes we observed in our cohort were JAK2, CALR, and chromatin/spliceosome-mutant groups (Figure 1). CR responses by classification system were 21 of 41 (51.2%) patients for heterozygous JAK2, 11 of 24 (45.8%) for the chromatin/spliceosome/RAS mutation, 12 of 19 (63.2%) for CALR, 3 of 11 (27.3%) for the TP53 mutation, and 4 of 10 (40.0%) for the homozygous JAK2/NFE mutation.
MPN Symptom and QoL changes
QoL questionnaires were completed by 104 (90.4%) patients (ET, 57; PV, 47) at 3 months, 92 (80%) patients (ET, 52; PV, 40) at 6 months, 81 (70.4%) patients (ET, 47; PV, 34) at 9 months, and 74 (64.3%) patients (ET, 45; PV, 29) at 12 months. In a mixed model, patients experienced statistically significant improvements in MPN-related symptoms including TSS, fatigue, dizziness, numbness and tingling, and weight loss (all P < .05). However, PEG-related side effects, such as flulike symptoms, injection site irritation, blurry vision, and vision changes, also developed (all P < .05; supplemental table 2; Figure 4). GHS/QoL stayed relatively stable over time in those patients who tolerated treatment (P = NS; Figure 4). Patients with a CR had significantly improved TSS, GHS/QoL score, fatigue, early satiety, and itching, compared with those with a PR/NR at 12 months (all P < .05).
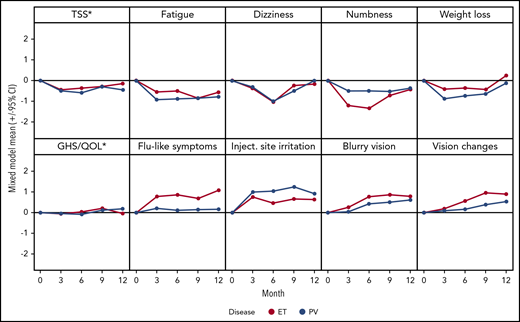
Mean changes from baseline during treatment. Negative changes indicate improvement. *MPN-SAF TSS and EORTC QLQ-C30 GHS/QoL transformed to a 0 to 10 scale, where 10 represents the worst outcome, for consistency with other displayed items.
Mean changes from baseline during treatment. Negative changes indicate improvement. *MPN-SAF TSS and EORTC QLQ-C30 GHS/QoL transformed to a 0 to 10 scale, where 10 represents the worst outcome, for consistency with other displayed items.
Safety
Seventy-two percent of patients remained on therapy for over 12 months, with a median (range) duration of 78.5 (1-245) weeks for ET and 82 (4-209) weeks for PV. The mean (SD) weekly dose of PEG was 102.7 (52.3) µg for ET and 128.7 (46.4) for PV. The causes of discontinuation of therapy are listed in Table 3. The 2 most common reasons were study closure (30.4%) and completion of the planned 4-year follow-up (26.1%). Discontinuation of PEG because of AEs occurred in 13.9% of patients.
Reasons for discontinuation of treatment
| ET (n = 65) | PV (n = 50) | Total (N = 115) | |
|---|---|---|---|
| Study closure | 22 (33.8) | 13 (26.0) | 35 (30.4) |
| Treatment of 48 mo completed | 18 (27.7) | 12 (24.0) | 30 (26.1) |
| AE | 7 (10.8) | 9 (18.0) | 16 (13.9) |
| Disease progression | 7 (10.8) | 6 (12.0) | 13 (11.3) |
| Refused further treatment | 7 (10.8) | 5 (10.0) | 12 (10.4) |
| Developed other primary solid tumors* | 2 (3.1) | 2 (4.0) | 4 (3.5) |
| Removed to receive nonprotocol therapy? | 2 (3.1) | 0 (0.0) | 2 (1.7) |
| Noncompliance | 0 (0.0) | 1 (2.0) | 1 (0.9) |
| Other† | 0 (0.0) | 2 (4.0) | 2 (1.7) |
Data are n (%).
Two ET patients discontinued treatment due to spindle cell sarcoma and preexisting renal cell cancer, and 2 PV patients developed melanoma and lung adenocarcinoma and discontinued treatment.
Investigator decision (n = 1); patient perceived inefficacy of treatment (n = 1).
Cumulative incidence of a second cancer (excluding nonmelanoma skin cancers) at 2 years was 4% (95% CI, 1%-10%). These consisted of lung adenocarcinoma (PV, 2; ET, 0), spindle cell sarcoma (ET, 1) and melanoma (PV, 1). Four patients discontinued treatment because of secondary cancer (1 each with lung adenocarcinoma, melanoma, spindle cell sarcoma, and preexisting renal cell cancer).
All patients (N = 114) who received PEG were evaluated for AEs. One ET patient withdrew from the study before receiving treatment. AEs of any grade, regardless of attribution, were reported in 90.4% of patients. Grade ≥3 AEs, regardless of attribution occurred in 50 patients (43.8%); those that occurred in >10% in either cohort regardless of attribution are shown in Table 4. The most common hematologic and nonhematologic AEs listed in Table 4. No deaths occurred in patients during treatment, but 3 deaths occurred in patients who had been taken off study. Reasons for discontinuation of the study in these 3 patients were substance abuse, adenocarcinoma of the lung, and the patient’s decision.
AEs occurring in >10% in either disease strata, regardless of attribution
| ET (n = 64) | PV (n = 50) | |||
|---|---|---|---|---|
| All grades | Grade 3+ | All grades | Grade 3+ | |
| Hematologic | ||||
| Anemia | 16 (25.0) | 4 (6.3) | 8 (16.0) | — |
| Leukopenia | 13 (20.3) | 1 (1.6) | 11 (22.0) | 2 (4.0) |
| Lymphocytopenia | 9 (14.1) | 1 (1.6) | 9 (18.0) | 3 (6.0) |
| Neutropenia | 9 (14.1) | 5 (7.8) | 4 (8.0) | 2 (4.0) |
| Thrombocytopenia | 6 (9.4) | — | 9 (18.0) | — |
| Nonhematologic | ||||
| Abdominal pain | 7 (10.9) | — | 2 (4.0) | — |
| Alanine aminotransferase | 6 (9.4) | 2 (3.1) | 5 (10.0) | — |
| Arthralgia | 9 (14.1) | — | 5 (10.0) | 2 (4.0) |
| Bone pain | 7 (10.9) | — | 4 (8.0) | — |
| Constipation | 9 (14.1) | — | 7 (14.0) | — |
| Cough | 11 (17.2) | — | 4 (8.0) | — |
| Cramp | 10 (15.6) | — | 3 (6.0) | — |
| Creatinine increased | 1 (1.6) | — | 6 (12) | — |
| Depression | 8 (12.5) | — | 4 (8.0) | 1 (2.0) |
| Diarrhea | 9 (14.1) | 1 (1.6) | 20 (40.0) | — |
| Dizziness | 12 (18.8) | — | 7 (14.0) | — |
| Dyspnea | 10 (15.6) | 1 (1.6) | 5 (10.0) | 1 (2.0) |
| Edema | 9 (14.1) | — | 9 (18.0) | — |
| Fatigue | 28 (43.8) | 1 (1.6) | 20 (40.0) | — |
| Flulike symptoms | 11 (17.2) | 1 (1.6) | 9 (18.0) | — |
| Headache | 20 (31.3) | 2 (3.1) | 13 (26.0) | 1 (2.0) |
| Hyperuricemia | 4 (6.3) | — | 9 (18.0) | — |
| Injection site reaction | 13 (20.3) | — | 17 (34.0) | — |
| Insomnia | 4 (6.3) | — | 8 (16) | — |
| Lightheadedness | 8 (12.5) | — | 1 (2.0) | — |
| Myalgia | 10 (15.6) | — | 7 (14.0) | — |
| Nausea | 15 (23.4) | — | 12 (24.0) | — |
| Pain | 12 (18.8) | 1 (1.6) | 15 (30.0) | 1 (2.0) |
| Pruritus | 15 (23.4) | — | 11 (22.0) | — |
| Rash | 7 (10.9) | 1 (1.6) | 5 (10.0) | 1 (2.0) |
| Upper respiratory infection | 8 (12.5) | — | 4 (8.0) | — |
| Urinary tract infection | 7 (10.9) | 1 (1.6) | 5 (10.0) | — |
| Vomiting | 2 (3.1) | — | 8 (16.0) | — |
All data are n (%).
Discussion
This study represents the largest global effort to date to investigate the role of PEG in patients with high-risk ET or PV refractory to or intolerant of HU therapy. PEG was shown to be an effective therapeutic option to treat such patients inducing an ORR at 12 months in 69.2% and 60% of ET and PV patients, respectively. CR rates of 43.1% and 22% in ET and PV, respectively, in this study were lower than those in prior reports (Table 5),10,15,18-21 which may be explained by the broad inclusion criteria, ITT design, and international accrual. In addition, patients enrolled in this study had higher risk features, such as advanced age, prolonged disease duration, and a high prevalence of splenomegaly (Table 5). In our study, we used stringent response criteria that incorporated hematologic variables, spleen size, and symptom responses, which were evaluated by a blinded central review committee. We did not identify any predictors of clinical response or observe a relationship between the dose of PEG administered and the degree of clinical response.
Published and presented prospective trials of IFN products in PV and ET
| Clinical trial (reference) | Study type; follow-up | IP starting dose | n | Patient population | Age, y (range) | ORR% (CR%) | Molecular response (%) | AE |
|---|---|---|---|---|---|---|---|---|
| Masarova et al10 | Single institution; 83 mo | PEG 450-90 µg/wk | 40 ET | New diagnosis and previously treated | 53 (43-62) | PV 79 (77) | 63 | Grade III/IV AE: 69% |
| 43 PV | ET 80 (73) | CR 18 | Discontinuation TEAE: 22% | |||||
| Major VTE: 8 | ||||||||
| Transformations: MF (6) AML (1) | ||||||||
| Kiladjian et al15 | Multicenter; 31.4 mo | PEG 90 µg/wk | 40 PV | New diagnosis | 49 | 100 (94.6) | 89.6 | Grade III AE 3% |
| CR 24.1 | Any AE: 94% | |||||||
| Discontinuation TEAE 24.3% No VTE | ||||||||
| Silver20 | Long-term data; 13 y | rIFNα 1 MU/TIW | 55 PV | Phlebotomy and HU | 50 (24-80) | NA | Discontinuation TEAE 15% | |
| No VTE | ||||||||
| Gisslinger et al19 | Multicenter; 80 wk | RoPEG 50-540 µg q 2 wk | 51 PV | New diagnosis and previously treated | 56 (35-82) | 90(47) | PR 47 | All AE: 88% |
| CR 21 | Discontinuation TEAE 20% | |||||||
| Major vascular events: 2 | ||||||||
| Gisslinger et al18 | Multicenter | RoPEG 50-500 µg q 2 wk | 127 PV | Untreated or previously treated (<3 y) | 60 (30-85) | 43.1% | — | — |
| Yacoub et al, current study | Multicenter; 12 mo | PEG 45 µg/wk | 65 ET | Previously treated | 64 (20-85) | ET 69 (43) | 41.3 | Grade III/IV: 39% |
| 50 PV | PV 60 (22) | Discontinuation TEAE 13.9% | ||||||
| Mascarenhas et al21 | Multicenter; 12 mo | PEG 45 µg/wk | 39 ET | New diagnosis <5 y | 60 (19-79) | 78 (35.4) | NR | Grade III/IV: 37% |
| 43 PV | PV 86 (28) | Discontinuation TEAE 12.5% | ||||||
| ET 69 (43) |
IP, investigational product; MU: million units; VTE, venous thromboembolism; TEAE, treatment-emergent adverse event, TIW, 3 times a week.
PEG therapy resulted in an overall improvement in MPN-related symptoms, but the toxicities associated with PEG may have abrogated some of those benefits. Despite the mixed symptom picture, PEG did not reduce the QoL of patients who were able to tolerate treatment. BM responses and deep molecular responses were infrequent which might be attributed to the relatively short follow-up. The effect of achieving a molecular remission with PEG on survival and clinical outcomes has yet to be determined. In addition, there has been significant heterogeneity in the sensitivity of the assays used to measure molecular responses among different reports.
Response rates according to driver mutational status were evaluated, and only the presence of the CALR mutation was associated with a superior clinical, but not molecular, response. It is notable that mutations in TP53 and ASXL1 were among the most frequently co-occurring mutations in this cohort, suggesting that patients with genomically unfavorable disease were included in this study. A significant difference in the baseline JAK2V617F VAF was observed between patients achieving a CR and those with NR, suggesting that therapeutic efficacy of PEG may be greater in a molecularly defined subgroup of patients. A reduction in the JAK2V617F VAF over time was observed in patients with a CR, as compared with an NR, which links a reduction in VAF to clinical response. In additional, 3 patients with PV had complete or partial normalization of abnormal baseline karyotype while on PEG therapy, which was in concordance with their clinical CR.
Thrombotic events and evolution to MF or AML continued to occur during the treatment period. This observation reaffirms the findings of a recent prospective single-institution trial of PEG in patients with ET or PV, in which the observed rate of transformation to MF and AML was similar in treated patients and historical controls matched for disease duration, prior therapy, and molecular features.10 In addition, unprovoked thrombosis was observed at a rate of 1.22 per person-year.
AEs, particularly those of grades 3 and 4, were detected in slightly more than one third of the subjects. Many of these events were consistent with the known effects of PEG. Given the prospective nature of our study, the higher rate of AEs reported here is expected. Treatment-emergent AEs, a rate that has been variable in other reports, led to discontinuation of therapy in only 13.9% of subjects (Table 5). This low discontinuation rate may be attributable to the dosing schedule of PEG, starting with a low dose and allowing for gradual dose escalation.
Recently, the JAK1/JAK 2 inhibitor ruxolitinib was evaluated as a therapeutic agent to treat patients with ET or PV who were resistant to, or intolerant of, HU therapy. The MAJIC-ET trial35 reported that ruxolitinib was not superior to best available therapies (BATs). It is noteworthy that, given the lack of alternative therapies, the most common BAT included HU (71.1%), anagrelide (48.1%), and IFN (40.4%). Although these authors used ELN response criteria for CR, resolution of disease-related symptoms was not included, and over 70% of patients continued to receive HU as BAT, raising doubt about true resistance or intolerance. The use of modified ELN criteria in the MAJIC-ET trial may account for the higher CR rate (44.2%) reported with ruxolitinib than that observed in this trial (35.3%). In contrast, the RESPONSE 1 trial36 compared the ability of ruxolitinib and BAT to achieve HCT control and a 35% reduction in splenomegaly in an advanced group of PV patients who were resistant to or intolerant of HU therapy and had palpable splenomegaly. This composite end point was achieved in 20.9% of patients receiving ruxolitinib therapy and 0.9% of patients receiving BAT. Because ELN response criteria were not used in RESPONSE 1, it is difficult to compare these results to those that we observed with PEG therapy, although the CR rates are comparable. Using reduction of splenomegaly as a criterion for clinical response is of dubious value in PV, because only 44% of PV patients in our trial had palpable splenomegaly, and they were rarely symptomatic. This concern regarding trial design led to the RESPONSE 2 trial, in which ruxolitinib therapy in PV patients without splenomegaly was compared with BAT in patients who were phlebotomy dependent and resistant to or intolerant of HU therapy. Again, phlebotomy control, rather than ELN criteria, was used to define the ORR and 49% of the patients in the BAT arm continued to receive HU therapy. HCT control was achieved in 62% of patients receiving ruxolitinib and 19% of patients receiving BAT. Since the criteria used to define CR were clearly different in the RESPONSE 1 and 2 trials than those used in MPD-RC 111 trial, it is not possible to evaluate whether PEG or ruxolitinib is the optimal treatment choice for ET and PV patients resistant to or intolerant of HU. The results of this study are of particular significance in light of the recent European Commission approval of ropeginterferon for the treatment of patients with PV based on the PROUD-PV trial (NCT01949805).
In conclusion, in the setting of HU resistance or intolerance, PEG has demonstrated activity in high-risk ET and PV patients and should be considered an effective therapeutic choice. Proper patient selection, gradual dose escalation, and prompt evaluation and management of AEs can increase the efficacy and tolerability of PEG in ET and PV patients. Whether PEG or ruxolitinib or a combination of the 2 drugs is the more effective therapy for PV and ET patients clearly requires additional clinical trials using carefully defined patient populations and uniform response criteria.
Deidentified individual participant data that underlie the reported results will be made available after publication. Proposals for access should be sent to ayacoub@kumc.edu.
Presented as an oral abstract at the 59th annual meeting of the American Society of Hematology, Atlanta, GA, 9-12 December 2017.
The online version of this article contains a data supplement.
The publication costs of this article were defrayed in part by page charge payment. Therefore, and solely to indicate this fact, this article is hereby marked “advertisement” in accordance with 18 USC section 1734.
Acknowledgments
The authors thank Juan Santiago Medina, Juanes Arango Ossa, and Max Levine for development of the algorithmic processes and execution of the analytical pipelines related to DNA sequencing data included in this study.
This research was made possible by a grant from the National Cancer Institute (NCI), National Institutes of Health (MPN Research Consortium Grant 5P01CA108671-09), an NCI Cancer Center Support Grant/Core Grant to Memorial Sloan Kettering Cancer Center (P30CA008748), and generous independent, unrestricted support from Roche Genentech. R.H. is supported by NCI grant 1K08CA188529-01.
Authorship
Contribution: A.Y., J.M., J.T.P., E.R., R.T.S., R.R., R.M., and R.H. contributed to the design of the research, conduct of the experiments, data collection, and provision of vital new reagents and analytical tools; analyzed and interpreted the data; performed the statistical analyses; and drafted the manuscript; D.B., M.R.B., C.K., E.W., M.C.F., A.R., A.M.V., D.L., D.R., M.O.A., R.C., J.V., V.R., E.H., M.K., L.S., J.T., V.N., N.F., R.S.-W., and J.D.G. contributed to the conduct of the experiments, data collection, and drafting of the manuscript; H.K., E.P., M.S., and A.C.D. contributed to the design, provided the vital new reagents and analytical tools, analyzed and interpreted the data, performed the statistical analyses, and drafted the manuscript; T.B. contributed to the design and conduct of the experiments, data collection, and drafting of the manuscript; and all authors gave final approval of the version to be published and agreed to be accountable for questions related to the accuracy and integrity of the work.
Conflict-of-interest disclosure: A.Y. reports consultation and speaker honoraria for Incyte, Seattle Genetics, and Novartis. J.M. reports clinical trial research support paid to the institution from Incyte, Roche, Novartis, CTI Biopharma, Janssen, Merck, Promedior, and Celgene and membership on the clinical trial steering committee and advisory boards of Roche, CTI Biopharma, Incyte, and Celgene. J.T.P. reports clinical trial research support paid to the institution from Incyte, Abbvie, Pharmaessentia, and consulting honoraria from Agios. M.R.B. reports clinical trial research support paid to the institution from Abbvie, AI, Astellas, Forma, Incyte, Kite, and Takeda. E.W. reports serving on the advisory boards of Incyte Corporation and Gilead Sciences. A.R. reports consultation and speaker honoraria from Novartis, Amgen, Roche, Celgene, and Italfarmaco. A.M.V. reports speaker honoraria from Novartis and Celgene and fees from Novartis, CTI, Celgene for participation on advisory boards. D.R. reports consulting honoraria from Incyte. M.A. reports research grant support paid to the institution from Incyte, CTI Biopharma, Samus Therapeutics, Janssen, and Gilead. R.T.S. reports consultancy and speaker bureau for Pharmaessentia. R.R. has received consulting fees from Stemline, Celgene, Agios Pharmaceuticals, Apexx Oncology, Beyond Spring, Partner Therapeutics, and Jazz Pharmaceuticals and has received research funding from Constellation Pharmaceuticals, Incyte, and Stemline Therapeutics. R.M. reports research support from Incyte, Genetech, CTI, Promedior, and Abbvie and consulting for Novartis, Sierra Oncology, and La Jolla Pharma. R.H. reports research support from Roche. The remaining authors declare no competing financial interests.
Correspondence: Abdulraheem Yacoub, Division of Hematologic Malignancies and Cellular Therapuetics, The University of Kansas Cancer Center, 2330 Shawnee Mission Pkwy, Westwood, KS 66205; e-mail: ayacoub@kumc.edu.
