

Key Points
Loss of Dnmt3a in hematopoietic stem cells cooperates with Jak2V617F to induce lethal myelofibrosis.
Dnmt3a loss leads to activation of enhancers and drives aberrant self-renewal and inflammatory signaling.

Abstract
Myeloproliferative neoplasms (MPNs) are a group of blood cancers that arise following the sequential acquisition of genetic lesions in hematopoietic stem and progenitor cells (HSPCs). We identify mutational cooperation between Jak2V617F expression and Dnmt3a loss that drives progression from early-stage polycythemia vera to advanced myelofibrosis. Using in vivo, clustered regularly interspaced short palindromic repeats (CRISPR) with CRISPR-associated protein 9 (Cas9) disruption of Dnmt3a in Jak2V617F knockin HSPC, we show that Dnmt3a loss blocks the accumulation of erythroid elements and causes fibrotic infiltration within the bone marrow and spleen. Transcriptional analysis and integration with human data sets identified a core DNMT3A-driven gene-expression program shared across multiple models and contexts of Dnmt3a loss. Aberrant self-renewal and inflammatory signaling were seen in Dnmt3a−/− Jak2V617F HSPC, driven by increased chromatin accessibility at enhancer elements. These findings identify oncogenic cooperativity between Jak2V617F-driven MPN and Dnmt3a loss, leading to activation of HSPC enhancer–driven inflammatory signaling.
Introduction
Myeloproliferative neoplasms (MPNs) arise from somatic mutations within hematopoietic stem and progenitor cells (HSPCs) that drive lineage-specific terminal differentiation into mature myeloid cells.1 An activating mutation in JAK2 (JAK2V617F, hereafter JAK2VF) is the most prevalent mutation in MPNs, found in 95% of polycythemia vera (PV) and >50% of primary myelofibrosis (PMF) and essential thrombocythemia (ET).2-4 Although ET and PV are associated with excellent long-term prognosis, transformation to advanced-stage disease such as secondary myelofibrosis (MF) or acute myeloid leukemia (AML) has a dramatic negative impact on survival.5-8 Understanding the factors that lead to disease progression is critical to improve outcomes in these patients.
Genetic heterogeneity is common in MPNs and the presence of additional mutations has a powerful, adverse effect on prognosis.9 Collectively, lesions in epigenetic pathway genes, such as additional sex combs like 1 (ASXL1), enhancer of zeste homolog 2 (EZH2), or DNA methyl transferase 3A (DNMT3A), are the most frequently mutated nonkinase genes in patients with MPNs.10-13 Ezh2 loss promotes MF in Jak2V617F genetically engineered mouse models.14,15 Mutations in DNMT3A are rare in PV and ET (∼5%) but are more common in patients with primary and secondary MF (15%) or AML (20%).11,13,16
DNMT3A is a de novo DNA methyltransferase that catalyzes the addition of methyl groups into active chromatin in CpG-rich regions leading to gene inactivation.15,17 Mutations in DNMT3A cluster in the methyltransferase domain around arginine 882 (eg, R882H/C) leading to dominant-negative function with loss of DNA binding and reduced catalytic activity.18,19 DNMT3A R882 mutations are associated with focal hypomethylation18,20 and Dnmt3a deficiency induces widespread methylation changes21 through the epigenetic silencing of self-renewal genes.19 Recent articles have also shown a role for Dnmt3a loss of function in binding of the polycomb-repressive complex (PRC1) and in regulating enhancer site methylation.15,22 Dnmt3a−/− hematopoietic stem cells (HSCs) have enhanced self-renewal and a block in differentiation upon serial transplantation in vivo.23 It has been difficult to correlate genome-wide DNA methylation changes with aberrant gene expression in DNMT3A mutant AML, leading some to suggest that DNA methylation changes may be a function of leukemic transformation.24-26
DNMT3A also inactivates specific chromatin sites such as enhancer elements that control the establishment of cell-type–specific gene-expression programs and have critical roles in development and cancer.27,28 Cell-context–specific chromatin maps have been developed using histone-modification sites, allowing genome-wide annotation of enhancer activity.29-31 Mutant DNMT3A-R882H was shown to facilitate the acquisition of the active histone mark, H3K27ac.32 Similarly, loss of Dnmt3a in HSCs expressing activated FMS-like tyrosine kinase 3 (FLT3ITD) gave rise to T-cell acute lymphoblastic leukemia (T-ALL), driven by a gain in active enhancer accessibility and binding.15 These data suggest that DNMT3A mutations contribute to the malignant transformation of normal HSCs.
Modeling combinatorial oncogenic changes in vivo has been challenging and relatively inefficient. Until recently, the field has relied on intercrossing genetically engineered mouse models15 or retroviral overexpression.32 We used clustered regularly interspaced short palindromic repeats (CRISPR) with CRISPR-associated protein 9 (Cas9) to engineer a highly efficient and specific method to target specific genomic loci for loss of function in vivo.33 We applied CRISPR-Cas9 technology to perform in vivo editing of the Dnmt3a function within Jak2VF HSCs and observed that Dnmt3a loss results in transformation of PV into lethal MF, characterized by bone marrow failure, massive splenomegaly, and reticulin fibrosis. Mechanistically, Dnmt3a loss drives gene expression through increasing chromatin accessibility at active enhancers, leading to increased stemness, inflammatory signaling, and consequent myelofibrotic transformation.
Materials and methods
Virus
The PL-CRISPR.efs.GFP plasmid was previously described.33 Lentiviral particles were produced by transfection of HEK293T cells (ATCC CRL-3216) using Fugene 6 (Promega) with pMD2.G (Addgene plasmid #12259), psPAX2 (Addgene plasmid #12260), and PL-CRISPR.efs.GFP containing an empty backbone or Dnmt3a Protospacer.
PCR
A polymerase chain reaction (PCR) product (845 bp) surrounding the Cas9 sequence and targeting the Dnmt3a loci was amplified using GoTaq Green (Promega) and primers: 5′CTACAGGGCTCCTGGTGCT3′ and 5′CTCCAATCACCAGGTCGAA3′. PCR conditions were 95°C for 120 seconds, followed by 35 cycles at 95°C for 30 seconds, 58°C for 30 seconds, and 72°C for 30 seconds, followed by 72°C for 5 minutes). DNA was purified using the MinElute PCR Purification kit (Qiagen), and confirmed by DNA sequencing.
Colony-forming assay
For 7 days, 10k transfected LineagenegSca1+Kit+ (LSK) cells were plated in 3 mL of M3434 cytokine-enriched methylcellulose (StemCell Technologies) in triplicate. Viable colony-forming units (CFUs) were replated weekly.
Mice
Congenic mice (CD45.1) were purchased from the Australian Animal Resource Center (ARC). Jak2VF knockin mice have been previously described.34
Fluorescence-activated cell sorting
Flow cytometry was performed as previously described35 and are detailed in supplemental Methods (available on the Blood Web site).
LSK transduction and transplantation model
Following fluorescence-activated cell sorting (FACS), LSKs were seeded in retronectin-coated 24-well plates (Takara) in StemSpan SFEM (StemCell Technologies) supplemented with murine thrombopoietin (mTpo) and murine stem cell factor (mScf; Peprotech) and human granulocyte colony-stimulating factor (hG-CSF), all 100 ng/mL (Amgen). LSK cells were transduced with concentrated lentivirus, followed by IV injection into lethally irradiated (11 cGy) 6- to 10-week-old female C57Bl/6 mice, in the absence of competitor or supporting bone marrow.
Blood analysis
Blood was collected into EDTA-coated tubes and analyzed on a Hemavet 950 analyzer (Drew Scientific). Peripheral blood smears were stained with Wright-Giemsa (BioScientific).
Histology
Tissues were fixed in 10% (vol/vol) neutral buffered formalin, embedded in paraffin, and stained with hematoxylin and eosin (H&E) and reticulin. Imaging used a Nikon Eclipse microscope.
Gene-expression profiling and bioinformatics analysis
Detailed protocols for RNA sequencing (RNA-seq) and assay for transposase-accessible chromatin using sequencing (ATAC-seq) are contained in supplemental Methods.
Statistical analysis
Statistical analyses were undertaken using a paired or unpaired 2-tailed Student t test in Excel or Prism (GraphPad Software). Significance of P values in figures are indicated using the following ranges: *P < .05, **P < .01, ***P < .001, ****P < .0001.
Study approval
All mouse experiments were approved by the QIMR Berghofer Medical Research Institute Animal Ethics Committee (A11605M).
Results
Dnmt3a loss increases self-renewal capacities in Jak2VF HSCs in vitro
Conditional expression of Jak2V617F (Jak2VF) from the endogenous Jak2 promoter in HSCs is sufficient for the development of MPNs resembling human PV,1 however, MF rarely develops, with latency >1 year in transplanted recipients.36 HSCs (enriched in LSK cells) are the sole reservoir of disease-initiating cells.1,37 To determine the effect of Dnmt3a loss on disease progression, we used CRISPR-Cas9 gene-editing technology in LSKs using lentivirus transduction.33,38 This system encodes a bicistronic vector coexpressing Cas9–green fluorescent protein (GFP) with a single-guide RNA (sg-RNA) targeting the methyltransferase domain of Dnmt3a.
Wild-type (WT) or Jak2VF LSK-derived cells transduced with a nontargeting guide RNA (gRNA) and Cas9 generated CFUs but exhausted by 2 to 3 weeks. WT LSKs transduced with sgRNA targeting Dnmt3a (Wt-Dnmt3a-Cas9) and Jak2VF-Dnmt3a-Cas9 cells both demonstrated enhanced in vitro serial replating capacities (Figure 1A-B; supplemental Figure 1A). Dnmt3a loss was validated at the protein level (supplemental Figure 1B). Importantly, there was progressive enrichment of GFP+ Dnmt3a-deleted cells (Figure 1C). Oligoclonal Dnmt3a editing at genome loci was validated by PCR and sequencing (Figure 1D; supplemental Table 1). RNA-seq analysis was performed on week 1 (p1) from Jak2VF-Cas9 and Jak2VF-Dnmt3a-Cas9 CFUs and week 5 (p5) from Jak2VF-Dnmt3a-Cas9 CFUs. This confirmed depletion of Dnmt3a in Jak2VF-Dnmt3a-Cas9 (Figure 1E). Principal component analysis (PCA) of the samples showed clustering of Jak2VF-Cas9 and Jak2VF-Dnmt3a-Cas9 at p1 vs immortalized Jak2VF-Dnmt3a-Cas9 CFU (Figure 1F), consistent with a minority of edited cells (<5%) in p1 Jak2VF-Dnmt3a-Cas9. Jak2VF-Dnmt3a-Cas9-p5 showed a distinct transcriptional signature with selection of GFP+ edited cells. Subsequent DNA sequencing of single colonies (GFP+) at the Dnmt3a target locus from p1 to p5 demonstrated low level (<10%), oligoclonal genome editing at p1 but progressive increase reaching 100% at p5 (supplemental Figure 1C; supplemental Table 1).39
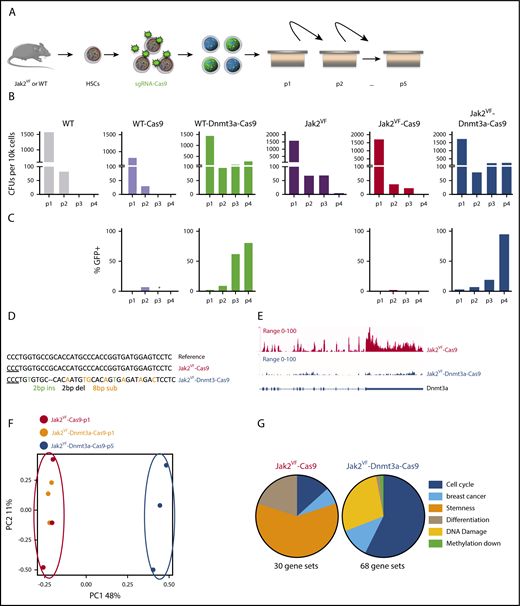
Dnmt3a loss increases self-renewal capacities in Jak2VFHSCs in vitro. (A) Experimental design, WT, and Jak2VF LSKs were sorted, transduced with lentivirus coding Cas9 coupled to a GFP reporter plus or minus sg-RNA targeting Dnmt3a. Thirty-six hours following transduction, 10k cells were seeded into methyl cellulose plates in triplicate; CFUs were counted and seeded weekly. (B) CFU count upon serial replating (4weeks) of LSKs derived cells from (left to right) WT, WT-Cas9, WT-Dnmt3a-Cas9, Jak2VF, Jak2VF-Cas9, Jak2VF-Dnmt3a-Cas9 conditions. (C) GFP expression upon cells replating (percentage) in WT-Cas9, WT-Dnmt3a-Cas9, Jak2VF-Cas9, Jak2VF-Dnmt3a-Cas9 LSKs derived cells. (D) Sequence alignment of the Dnmt3a gene at sgRNA binding loci within Jak2VF-Cas9 at week 1 (p1) and Jak2VF-Dnmt3a-Cas9 LSK-derived cells at week 5 (p5). (E) Dnmt3a transcription related peaks showing gene expression (read intensity) in Jak2VF-Cas9 (p1) and in Jak2VF-Dnmt3a-Cas9 (P5) at Dnmt3a-Cas9 target loci. (F) Principal component analysis (PCA) plot showing gene-expression profile of the LSK-derived cells from Jak2VF-Cas9 -p1 (black), Jak2VF-Dnmt3a-Cas9-p1 (orange), Jak2VF-Dnmt3a-Cas9-p5 (dark blue). Each dot represents an independent biological sample. (G) Categorized gene enriched in Jak2VF-Cas9 and Jak2VF-Dnmt3a-Cas9 gene expression (RNA-Seq). Gene-set enrichment of transcriptional pathways link to cell cycle, breast cancer, stemness, DNA damage, and hypomethylation-mediated gene expression.
Dnmt3a loss increases self-renewal capacities in Jak2VFHSCs in vitro. (A) Experimental design, WT, and Jak2VF LSKs were sorted, transduced with lentivirus coding Cas9 coupled to a GFP reporter plus or minus sg-RNA targeting Dnmt3a. Thirty-six hours following transduction, 10k cells were seeded into methyl cellulose plates in triplicate; CFUs were counted and seeded weekly. (B) CFU count upon serial replating (4weeks) of LSKs derived cells from (left to right) WT, WT-Cas9, WT-Dnmt3a-Cas9, Jak2VF, Jak2VF-Cas9, Jak2VF-Dnmt3a-Cas9 conditions. (C) GFP expression upon cells replating (percentage) in WT-Cas9, WT-Dnmt3a-Cas9, Jak2VF-Cas9, Jak2VF-Dnmt3a-Cas9 LSKs derived cells. (D) Sequence alignment of the Dnmt3a gene at sgRNA binding loci within Jak2VF-Cas9 at week 1 (p1) and Jak2VF-Dnmt3a-Cas9 LSK-derived cells at week 5 (p5). (E) Dnmt3a transcription related peaks showing gene expression (read intensity) in Jak2VF-Cas9 (p1) and in Jak2VF-Dnmt3a-Cas9 (P5) at Dnmt3a-Cas9 target loci. (F) Principal component analysis (PCA) plot showing gene-expression profile of the LSK-derived cells from Jak2VF-Cas9 -p1 (black), Jak2VF-Dnmt3a-Cas9-p1 (orange), Jak2VF-Dnmt3a-Cas9-p5 (dark blue). Each dot represents an independent biological sample. (G) Categorized gene enriched in Jak2VF-Cas9 and Jak2VF-Dnmt3a-Cas9 gene expression (RNA-Seq). Gene-set enrichment of transcriptional pathways link to cell cycle, breast cancer, stemness, DNA damage, and hypomethylation-mediated gene expression.
We therefore analyzed Jak2VF-Cas9-p1 and Jak2VF-Dnmt3a-Cas9-p1 (<10% edited) together against Jak2VF-Dnmt3a-Cas9-p5 and identified 4189 upregulated and 4925 downregulated genes (false discovery rate [FDR] < 0.05) in Jak2VF-Dnmt3a-Cas9-p5 (supplemental Figure 1D; supplemental Table 1). Gene-set enrichment analysis (GSEA)40 revealed that Jak2VF-Cas9 controls showed normal myeloid differentiation and progenitor cell signatures (supplemental Figure 1E). In contrast, transcriptional pathways controlling oncogenic signaling and DNA damage were found in Jak2VF-Dnmt3a mutants (Figure 1G). There was overlap between genes downregulated in Jak2VF-Dnmt3a-Cas9 P5 cells and previously published Tet2−/− CFUs, suggesting that some of these transcriptional changes may be caused by prolonged in vitro culture (data not shown). Jak2VF-Dnmt3a-Cas9 CFU showed aberrant expression of genes that are usually repressed by DNA methylation (Figure 1G; supplemental Figure 1E) and increased expression of stem cell–associated genes such as c-Kit, Erg, and Cd34 in Jak2VF-Dnmt3a-Cas9 cells (supplemental Figure 1F).15,21,32 These transcriptional changes were not seen at early time points (48 hours) post-LSK transduction in Jak2VF-Dnmt3a-Cas9 (supplemental Figure 1G-H). We examined the H19 locus, which is known to be regulated during embryogenesis by DNA methylation.41 Using bisulfite sequencing at the H19-imprinting control region, we demonstrated decreased methylation in Jak2VF-Dnmt3a-Cas9 compared with Jak2VF-Cas9 controls (supplemental Figure 1I-J). Altogether, these data demonstrate successful Dnmt3a targeting of Jak2VF LSKs, leading to in vitro self-renewal.
Dnmt3a loss induces MF in Jak2VF MPNs
To assess the effect of Dnmt3a loss on Jak2VF-driven MPNs in vivo, we transplanted equal numbers of GFP+ Jak2VF-Dnmt3a-Cas9 or Jak2VF-Cas9 LSK cells into irradiated C57BL6 mice (Figure 2A). Recipients of Jak2VF-Cas9 LSK cells developed early-stage MPNs reminiscent of PV with high hematocrit, leukocyte, and platelet count (Figure 2B-E). We observed expansion of GFP+ edited cells in Jak2VF-Dnmt3a-Cas9 recipients compared with Jak2VF-Cas9 (Figure 2F). Jak2VF-Dnmt3a-Cas9 recipients exhibited a biphasic disease, reminiscent of secondary transformation of PV to MF. At 8 weeks, Jak2VF-Dnmt3a-Cas9 showed panmyelosis with thrombocytosis and, by 32 weeks, the Jak2VF-Dnmt3a-Cas9 recipients became severely pancytopenic with progressive bone marrow failure (Figure 2B-E; supplemental Figure 2A). Conversely, recipients of WT-Dnmt3a-Cas9 and WT-Cas9 LSK cells did not develop observable differences in hemoglobin, platelets, or leukocyte counts, most consistent with a nonprogressive clonal hematopoiesis (supplemental Figure 2B). At 32 weeks, Jak2VF-Dnmt3a-Cas9 mice became moribund, but not Jak2VF-Cas9 controls (Figure 2G). Compared with Jak2VF-Cas9 controls, erythropoiesis was reduced in bone marrow progenitors of Jak2VF-Dnmt3a-Cas9 recipients (Figure 2H). This was not observed in WT-Dnmt3a-Cas9 LSK recipients (supplemental Figure 2C).
![Figure 2. Dnmt3a loss induces MF in Jak2VF MPNs. (A) Experimental design, in vivo transplantation of Jak2VF LSKs transduced with lentivirus coding Cas9 coupled to a GFP reporter plus or minus sgRNA targeting Dnmt3a. (B-F) Left panels, Shown, respectively, are platelet number, hemoglobin concentration, leukocyte number, hematocrit, and GFP (edited cells) kinetic (over 32 weeks) from blood of recipient mice transplanted with Jak2VF-Cas9 and Jak2VF-Dnmt3a-Cas9 LSKs. Right panel, Dot plots show, respectively, platelet numbers, hemoglobin concentration, leukocyte number, hematocrit, and GFP expression at week 8 and week 32 (n ≥ 5 per group, per experiment; data represent pool of 2 experiments; mean ± standard error of the mean [SEM]). P values were calculated using the unpaired Student t test: *P < .05, **P < .01, ***P < .001. (G) Kaplan-Meier survival curve of WT recipient mice transplanted with Jak2VF-Cas9 and Jak2VF-Dnmt3a-Cas9 LSK cells over 32 weeks (n ≥ 5; per experiment, data represent pool of 2 experiments). Jak2VF-Cas9, Jak2VF-Dnmt3a-Cas9. (H) Representative flow cytometry gating strategy for erythroid progenitor cell populations. Left panel (black), Jak2VF-Cas9; right panel (blue), Jak2VF-Dnmt3a-Cas9 bone marrow (BM) cells. Percentage of erythroid progenitor populations at week 32 in Jak2VF-Cas9 and Jak2VF-Dnmt3a-Cas9 BM cells (n = 5 mice, mean ± SEM). P values were calculated using the unpaired Student t test. *P < .05, ***P < .001.](https://ash.silverchair-cdn.com/ash/content_public/journal/blood/132/26/10.1182_blood-2018-04-846220/6/m_blood846220f2.png?Expires=1770979187&Signature=I92lfMCcH0eeA8h0swhpw81xb-9NOQ1KicoEg9rhT8iN9ZlB3rKMt~TSA7EX9yMdwLnVtIBEstpyR8cB9QORHJyb-Szah0yuhxERxGZ1dQkw2GGnu0CqgZQKUQlKgYZp~Ld9-qBsG3YmYHA6Kuytf44h1rEchMXqpaWAkFz8iDTrJALBcJOhvE9FboIcLa9QLm9H9oOdu9oHC~jwZHJiNtUSK48yTeZJSMOc1tmCW4TOCBjgUp3ROgEMdxOuJEjq50UPdpjObgM2-qJKvnJH4NfzeG0lre-vZvgLuwbF5U-dE88P0te4KFr-coNEkVXTVi5rp-Vp6shmf4xcWAmr0A__&Key-Pair-Id=APKAIE5G5CRDK6RD3PGA)
Dnmt3a loss induces MF in Jak2VFMPNs. (A) Experimental design, in vivo transplantation of Jak2VF LSKs transduced with lentivirus coding Cas9 coupled to a GFP reporter plus or minus sgRNA targeting Dnmt3a. (B-F) Left panels, Shown, respectively, are platelet number, hemoglobin concentration, leukocyte number, hematocrit, and GFP (edited cells) kinetic (over 32 weeks) from blood of recipient mice transplanted with Jak2VF-Cas9 and Jak2VF-Dnmt3a-Cas9 LSKs. Right panel, Dot plots show, respectively, platelet numbers, hemoglobin concentration, leukocyte number, hematocrit, and GFP expression at week 8 and week 32 (n ≥ 5 per group, per experiment; data represent pool of 2 experiments; mean ± standard error of the mean [SEM]). P values were calculated using the unpaired Student t test: *P < .05, **P < .01, ***P < .001. (G) Kaplan-Meier survival curve of WT recipient mice transplanted with Jak2VF-Cas9 and Jak2VF-Dnmt3a-Cas9 LSK cells over 32 weeks (n ≥ 5; per experiment, data represent pool of 2 experiments). Jak2VF-Cas9, Jak2VF-Dnmt3a-Cas9. (H) Representative flow cytometry gating strategy for erythroid progenitor cell populations. Left panel (black), Jak2VF-Cas9; right panel (blue), Jak2VF-Dnmt3a-Cas9 bone marrow (BM) cells. Percentage of erythroid progenitor populations at week 32 in Jak2VF-Cas9 and Jak2VF-Dnmt3a-Cas9 BM cells (n = 5 mice, mean ± SEM). P values were calculated using the unpaired Student t test. *P < .05, ***P < .001.
Dnmt3a loss induces MF in Jak2VFMPNs. (A) Experimental design, in vivo transplantation of Jak2VF LSKs transduced with lentivirus coding Cas9 coupled to a GFP reporter plus or minus sgRNA targeting Dnmt3a. (B-F) Left panels, Shown, respectively, are platelet number, hemoglobin concentration, leukocyte number, hematocrit, and GFP (edited cells) kinetic (over 32 weeks) from blood of recipient mice transplanted with Jak2VF-Cas9 and Jak2VF-Dnmt3a-Cas9 LSKs. Right panel, Dot plots show, respectively, platelet numbers, hemoglobin concentration, leukocyte number, hematocrit, and GFP expression at week 8 and week 32 (n ≥ 5 per group, per experiment; data represent pool of 2 experiments; mean ± standard error of the mean [SEM]). P values were calculated using the unpaired Student t test: *P < .05, **P < .01, ***P < .001. (G) Kaplan-Meier survival curve of WT recipient mice transplanted with Jak2VF-Cas9 and Jak2VF-Dnmt3a-Cas9 LSK cells over 32 weeks (n ≥ 5; per experiment, data represent pool of 2 experiments). Jak2VF-Cas9, Jak2VF-Dnmt3a-Cas9. (H) Representative flow cytometry gating strategy for erythroid progenitor cell populations. Left panel (black), Jak2VF-Cas9; right panel (blue), Jak2VF-Dnmt3a-Cas9 bone marrow (BM) cells. Percentage of erythroid progenitor populations at week 32 in Jak2VF-Cas9 and Jak2VF-Dnmt3a-Cas9 BM cells (n = 5 mice, mean ± SEM). P values were calculated using the unpaired Student t test. *P < .05, ***P < .001.
Bone marrow staining in Jak2VF-Cas9 recipients revealed normal cellularity with erythroid expansion, consistent with PV. In contrast, we observed a dense fibrocellular infiltrate and osteosclerosis in Jak2VF-Dnmt3a-Cas9 recipients (Figure 3A-B; supplemental Figure 3A-B). Jak2VF-Dnmt3a-Cas9 recipient spleens had disorganized and effaced splenic architecture, associated with a dense fibrocellular infiltrate (Figure 3C) and reticulin fibrosis in the spleen (Figure 3D; supplemental Figure 3D) with massive splenomegaly (Figure 3E) and bone marrow hypocellularity (Figure 3F). Conversely, Jak2VF-Cas9 controls showed changes typical of PV with extramedullary hematopoiesis and erythromegakaryocyte infiltration in the absence of reticulin fibrosis. Bone marrow fibrosis or infiltration was not seen in WT-Dnmt3a-Cas9 LSK recipients (Figure 3A-D; supplemental Figure 3A-D). Blood smears from the Jak2VF-Cas9 and Jak2VF-Dnmt3a-Cas9 showed severe anemia, with left-shifted myelopoiesis, anisocytosis, poikilocytosis, and tear-drop erythrocytes, reminiscent of human MF (Figure 3G; supplemental Figure 3E). Finally, we found global increases in inflammatory cytokines in Jak2VF-Dnmt3a-Cas9 recipients (supplemental Figure 3F). Together, these results demonstrate that in vivo CRISPR-Cas9 loss-of-function editing of Dnmt3a leads to transformation from PV to secondary MF in Jak2VF-induced MPNs.
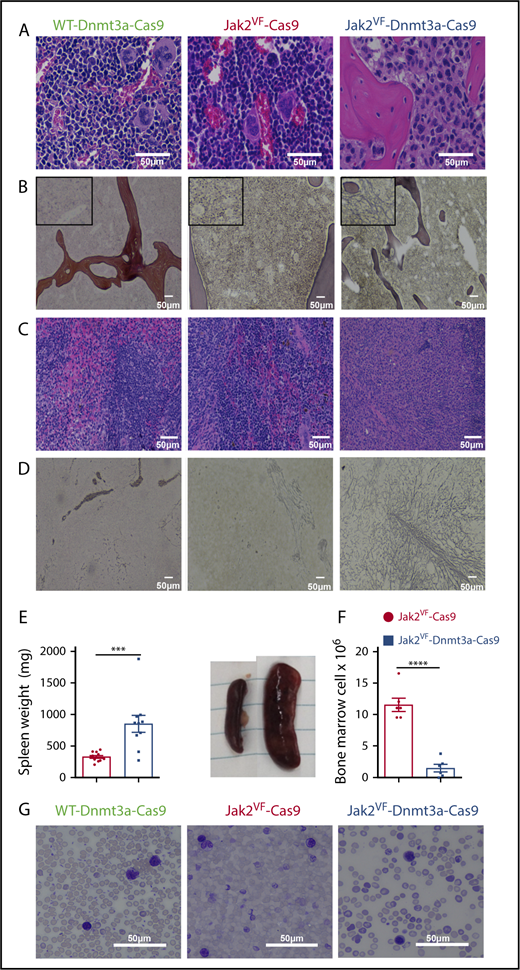
Morphology of myelofibrotic transformation in bone marrow and spleen. (A) Representative image of BM of WT Dnmt3a-Cas9 (left), Jak2VF-Cas9 (center), and Jak2VF-Dnmt3a-Cas9 (right) LSK-transplanted mice at week 32. Scale bar, 50 µm; H&E stain. (B) Representative image of reticulin staining from BM of WT, Jak2VF-Cas9, and Jak2VF-Dnmt3a-Cas9 LSK-transplanted mice. Scale bar, 50 µm. Insets, Enlarged image. (C) Representative image of spleen of WT Dnmt3a-Cas9, Jak2VF-Cas9, and Jak2VF-Dnmt3a-Cas9 LSK-transplanted mice. Scale bar, 50 µm. (D) Representative image of reticulin staining from spleen of WT Dnmt3a-Cas9, Jak2VF-Cas9, and Jak2VF-Dnmt3a-Cas9 LSK-transplanted mice. Scale bar, 50 µm. (E) Spleen weight (left panel) and image (right panel) from Jak2VF-Cas9 and Jak2VF-Dnmt3a-Cas9 LSK-transplanted mice at week 32. P values were calculated using the unpaired Student t test, ***P < .001 mean ± SEM. (F) BM cell count from Jak2VF-Cas9 and Jak2VF-Dnmt3a-Cas9 LSK-transplanted mice. P values were calculated using the unpaired Student t test, ***P < .001 mean ± SEM. (G) Peripheral blood from WT Dnmt3a-Cas9, Jak2VF-Cas9, and Jak2VF-Dnmt3a-Cas9 LSK-transplanted mice. Scale bar, 50 µm; Wright-Giemsa stain.
Morphology of myelofibrotic transformation in bone marrow and spleen. (A) Representative image of BM of WT Dnmt3a-Cas9 (left), Jak2VF-Cas9 (center), and Jak2VF-Dnmt3a-Cas9 (right) LSK-transplanted mice at week 32. Scale bar, 50 µm; H&E stain. (B) Representative image of reticulin staining from BM of WT, Jak2VF-Cas9, and Jak2VF-Dnmt3a-Cas9 LSK-transplanted mice. Scale bar, 50 µm. Insets, Enlarged image. (C) Representative image of spleen of WT Dnmt3a-Cas9, Jak2VF-Cas9, and Jak2VF-Dnmt3a-Cas9 LSK-transplanted mice. Scale bar, 50 µm. (D) Representative image of reticulin staining from spleen of WT Dnmt3a-Cas9, Jak2VF-Cas9, and Jak2VF-Dnmt3a-Cas9 LSK-transplanted mice. Scale bar, 50 µm. (E) Spleen weight (left panel) and image (right panel) from Jak2VF-Cas9 and Jak2VF-Dnmt3a-Cas9 LSK-transplanted mice at week 32. P values were calculated using the unpaired Student t test, ***P < .001 mean ± SEM. (F) BM cell count from Jak2VF-Cas9 and Jak2VF-Dnmt3a-Cas9 LSK-transplanted mice. P values were calculated using the unpaired Student t test, ***P < .001 mean ± SEM. (G) Peripheral blood from WT Dnmt3a-Cas9, Jak2VF-Cas9, and Jak2VF-Dnmt3a-Cas9 LSK-transplanted mice. Scale bar, 50 µm; Wright-Giemsa stain.
We next sought to assess the function of Jak2VF-Dnmt3a-Cas9 MF stem cells, however, insufficient cells were obtained from the fibrotic bone marrow, so we performed a CFU assay with splenocytes from each group. Although Jak2VF-Cas9 cells formed colonies efficiently, but were exhausted by 2 weeks, Jak2VF-Dnmt3a-Cas9 were able to form colonies enriched for GFP+-edited cells, and these cells could be replated in vitro for at least 4 weeks (supplemental Figure 4A-C). We then performed secondary transplant into CD45.1+ irradiated recipients using 1 × 10⁷ CD45.2+ Jak2VF-Cas9 or Jak2VF-Dnmt3a-Cas9 splenocytes. Jak2VF-Cas9 cells were able to engraft and caused PV with sustained donor chimerism, however, <1% of CD45.2+ Jak2VF-Dnmt3a-Cas9 cells engrafted into secondary recipients and MPNs were not observed (supplemental Figure 4D-E). We concluded that Jak2VF-Dnmt3a-Cas9 cells are immortalized, but cannot transplant MF into secondary recipients due to failed engraftment.
Myelofibrotic transformation in Jak2VF-Dnmt3a-Cas9 is associated with HSC depletion and the accumulation of MPPs
MPNs arise from activating mutations (such as Jak2VF) within HSCs, and these long-term HSCs contain the sole reservoir of disease-propagating cells in vivo.1,34,37 To understand the cellular drivers underlying MF transition from PV, we investigated bone marrow HSC and progenitor cell numbers in Jak2VF-Dnmt3a-Cas9 recipients with MF (Figure 4A). We found a striking loss of long-term and short-term HSCs (LT-HSC, ST-HSC) and the relative accumulation of multipotent progenitor (MPP) cells in GFP+ edited cells in MF Jak2VF-Dnmt3a-Cas9 recipients (Figure 4B-D). Interestingly, the relative proportions of ST-HSCs and MPPs were preserved in the nonedited GFP− fraction within Jak2VF-Dnmt3a-Cas9 recipients. Bone marrow LSK-GFP+ cells were relatively enriched in WT-Dnmt3a-Cas9 transplant recipients, again consistent with a state of dominant clonal hematopoiesis (supplemental Figure 2F-G). Megakaryocyte erythroid progenitor (MEP) differentiation was reduced in Jak2VF-Dnmt3a-Cas9 recipients, specifically within the edited GFP+ compartment (Figure 4E-G). Due to the marked bone marrow fibrosis, absolute cell numbers of Jak2VF-Dnmt3a-Cas9 LT-HSCs, ST-HSCs, and MPPs and progenitors were all reduced (Figure 4H-M). In the peripheral blood of Jak2VF-Dnmt3a-Cas9 recipients, there was myeloid skewing and depletion of B lymphocytes, however, this was not specific to edited cells and suggests the presence of an abnormal systemic inflammatory milieu (supplemental Figure 5A-C). We examined in vivo DNA editing using whole-exome sequencing of Jak2VF- Dnmt3a-Cas9 erythroid progenitors vs Jak2VF-Cas9 controls. We observed on target, oligoclonal editing of Dnmt3a exclusively in Jak2VF-Dnmt3a-Cas9 samples (supplemental Figure 5D-G). We did not identify any off-target recurrent oncogenic sequence variants in Jak2VF-Dnmt3a-Cas9 cells. Together, these data suggest that Jak2VF and Dnmt3a cooperate to alter HSC differentiation and self-renewal.
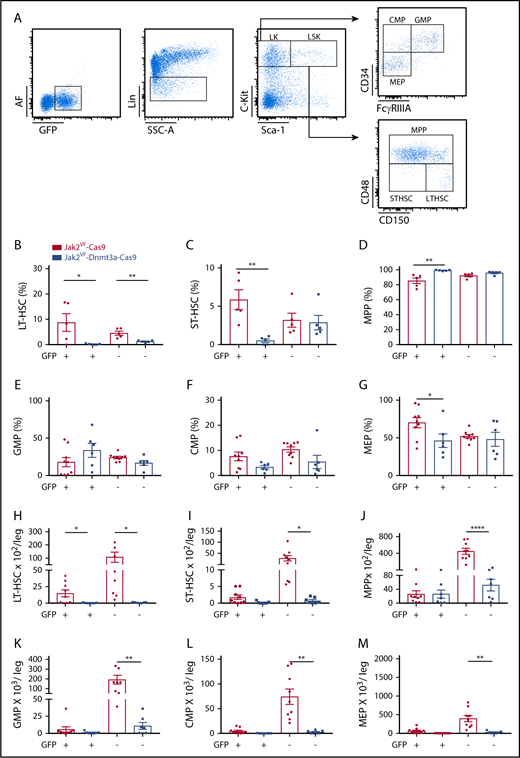
Myelofibrotic transformation in Jak2VF-Dnmt3a-Cas9 is associated with HSC depletion and the accumulation of MPPs. (A) Representative gating strategy used to identify HSPCs (LK, CMP, GMP, MEP, LSK, MPP, ST-HSC, LT-HSC) based on expression of GFP, lineage expression markers (Lin), c-Kit, Sca-1, CD34, FCγRIIIA, CD48, and CD150 in BM. (B) Percentage of LT-HSC, (C) ST-HSC, (D) MPP, (E) GMP, (F) CMP, and (G) MEP in GFP+ and GFP− compartment from BM of Jak2VF-Cas9 and Jak2VF-Dnmt3a-Cas9 LSK+ recipient mice (week 32). Absolute numbers of (H) LT-HSC, (I) ST-HSC, (J) MPP, (K) GMP, (L) CMP, and (M) MEP in GFP+ and GFP− compartment from BM of Jak2VF -Cas9 and Jak2VF-Dnmt3a-Cas9 LSK recipient mice (week 32), including Cas9− unedited controls. In all figures, P values were calculated using the unpaired Student t test, comparing Jak2VF-Dnmt3a-Cas9 to Jak2VF-Cas9, *P < .05, **P < .01, ***P < .001 with mean ± SEM.
Myelofibrotic transformation in Jak2VF-Dnmt3a-Cas9 is associated with HSC depletion and the accumulation of MPPs. (A) Representative gating strategy used to identify HSPCs (LK, CMP, GMP, MEP, LSK, MPP, ST-HSC, LT-HSC) based on expression of GFP, lineage expression markers (Lin), c-Kit, Sca-1, CD34, FCγRIIIA, CD48, and CD150 in BM. (B) Percentage of LT-HSC, (C) ST-HSC, (D) MPP, (E) GMP, (F) CMP, and (G) MEP in GFP+ and GFP− compartment from BM of Jak2VF-Cas9 and Jak2VF-Dnmt3a-Cas9 LSK+ recipient mice (week 32). Absolute numbers of (H) LT-HSC, (I) ST-HSC, (J) MPP, (K) GMP, (L) CMP, and (M) MEP in GFP+ and GFP− compartment from BM of Jak2VF -Cas9 and Jak2VF-Dnmt3a-Cas9 LSK recipient mice (week 32), including Cas9− unedited controls. In all figures, P values were calculated using the unpaired Student t test, comparing Jak2VF-Dnmt3a-Cas9 to Jak2VF-Cas9, *P < .05, **P < .01, ***P < .001 with mean ± SEM.
Dnmt3a regulates a core transcriptional signature correlating with HSC stemness and self- renewal
To understand how deletion of Dnmt3a within Jak2VF HSCs can alter differentiation and drive phenotypic changes in vivo, RNA-seq was performed on purified GFP+ LSKs. PCA showed distinct clustering and a relatively small number of differentially expressed (DE) genes from Jak2VF-Cas9 and Jak2VF-Dnmt3a-Cas9 (FDR < 0.05, Figure 5A-B; supplemental Table 2). GSEA revealed that Dnmt3a loss mediated transcriptional changes associated with HSC identity and function in Jak2VF-Dnmt3a-Cas9 compared with Jak2VF-Cas9 control (Figure 5C). We next sought to determine whether reproducible gene-expression changes could be detected across different contexts and disease subtypes, using multiple models of Dnmt3a loss, in the presence, or absence, of other cooperating mutations. We examined 6 published, independent gene-expression profiles from murine or primary human AML with DNMT3A knockout, or oncogenic mutation of DNMT3A.22-26 We found that our in vivo Jak2VF-Dnmt3a-Cas9 gene expression was highly concordant with previous published data from multiple in vivo–generated data sets (Figure 5D-H). However, such correlations were not found when using in vitro RNA-seq data.
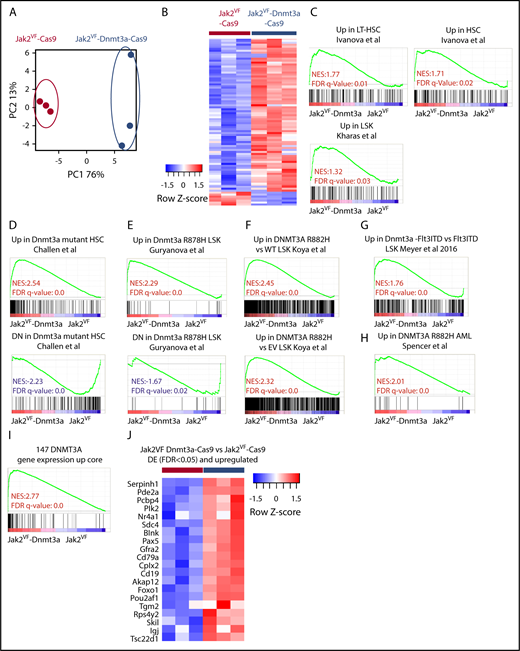
Dnmt3a regulates a core transcriptional signature correlating with HSC and self- renewal. (A) RNA-seq analysis. PCA plot representing differentially expressed (DE) gene-expression profile of the LSK cells form Jak2VF-Cas9 and Jak2VF-Dnmt3a-Cas9 recipients 8 weeks post-transplant. Each dot represents an individual biological replicate (mouse). (B) Heat map showing differentially expressed genes (FDR < 0.05) from Jak2VF-Cas9, and Jak2VF-Dnmt3a-Cas9. (C) GSEA, gene-expression signatures of LT-HSC and hematopoietic progenitor stemness genes comparing LSKs sorted from Jak2VF-Cas9 and Jak2VF-Dnmt3a-Cas9 recipient mice. The NES and FDR q value are indicated (top and bottom rows, respectively) on each GSEA plot. (D) GSEA for Dnmt3a mutant/KO gene-expression signatures in LSK, Cd150+,23 (E) LSK,24 (F) LSK,22 (G) LSK,25 and (H) AML.26 NES (top), and FDR q value (bottom rows) are indicated on each GSEA plot. (I) DNMT3A gene-expression core signature based on the overlap between studies (D-H). (J) Heat map of differentially upregulated genes (FDR < 0.05) in Jak2VF-Dnmt3a-Cas9 that are in the DNMT3A upregulated gene core.
Dnmt3a regulates a core transcriptional signature correlating with HSC and self- renewal. (A) RNA-seq analysis. PCA plot representing differentially expressed (DE) gene-expression profile of the LSK cells form Jak2VF-Cas9 and Jak2VF-Dnmt3a-Cas9 recipients 8 weeks post-transplant. Each dot represents an individual biological replicate (mouse). (B) Heat map showing differentially expressed genes (FDR < 0.05) from Jak2VF-Cas9, and Jak2VF-Dnmt3a-Cas9. (C) GSEA, gene-expression signatures of LT-HSC and hematopoietic progenitor stemness genes comparing LSKs sorted from Jak2VF-Cas9 and Jak2VF-Dnmt3a-Cas9 recipient mice. The NES and FDR q value are indicated (top and bottom rows, respectively) on each GSEA plot. (D) GSEA for Dnmt3a mutant/KO gene-expression signatures in LSK, Cd150+,23 (E) LSK,24 (F) LSK,22 (G) LSK,25 and (H) AML.26 NES (top), and FDR q value (bottom rows) are indicated on each GSEA plot. (I) DNMT3A gene-expression core signature based on the overlap between studies (D-H). (J) Heat map of differentially upregulated genes (FDR < 0.05) in Jak2VF-Dnmt3a-Cas9 that are in the DNMT3A upregulated gene core.
We next defined a core set of DNMT3A target genes from the overlapping data sets (Figure 5I-J; supplemental Table 2). Ingenuity pathway analysis of the 147 genes DNMT3A expression core signature revealed pathways involved in hematological system development and function and malignancy and identify a common, cell-intrinsic gene-expression signature derived from human and mouse models that is regulated by Dnmt3a and contributes to malignancy through the regulation of HSC identity. We next examined gene-expression analysis on a large number of patients with PMF, PV, and ET and heathy controls.42 Using the top 50 genes differentially expressed in our Jak2VF-Dnmt3a-Cas9 model, we were able to reliably cluster PMF patients vs ET, PV, or healthy controls (supplemental Figure 6A). These findings confirm the relevance of this Jak2VF-Dnmt3a-Cas9 mouse model to patients with MF.
We next examined genome-wide methylation studies from human CD34+ derived from patients with AML (annotated for DNMT3A mutation) or murine HSC-enriched populations from transgenic Dnmt3a−/− or Dnmt3a mutant models (Figure 6A; supplemental Table 3)23-26,43 to determine the correlation between DNA methylation and gene expression. Reproducibly, across data sets, DNMT3A loss led to global DNA hypomethylation and induced specific differentially methylated regions (DMRs). We next attempted to correlate DMRs with the core transcriptional DNMT3A data sets. We identified an overlap of 5044 genes that had DMRs in its vicinity upon Dnmt3a loss in 2 or more of the selected data sets24,26,43 (Figure 6A; supplemental Table 3). Using this core methylation profile, we examined the overlap between gene expression (P ≤ .05) and DMR. Loss of DNA methylation and increased gene expression had minimal overlap (overlap 136 of 287 upregulated genes in Jak2VF-Dnmt3a-Cas9 and only 63 of 147 genes within the DNMT3A transcriptional core, respectively) (Figure 6B; supplemental Figure 6B). Although there was an association between DMRs and increased gene expression as shown by GSEA analysis (supplemental Figure 6C), this was insufficient to explain the majority of transcriptional changes seen in this model, suggesting that Dnmt3a may act through mechanisms independent of DNA methylation at promoter loci to repress gene expression.
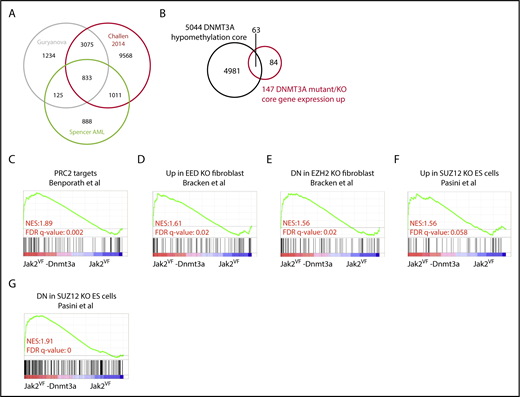
Altered DNA methylation explains a minority of gene-expression changes after Dnmt3a loss. (A) Venn diagram showing overlap of gene significantly hypomethylated between compared data sets.24,26,43 (B) Venn diagram showing overlap between the hypomethylated gene core and the DNMT3A gene-expression core. (C) GSEA plot representing PRC2 complex regulated genes in edited LSK from Jak2VF-Dnmt3a-Cas9 and Jak2VF-Cas9 recipient mice. (D-G) GSEA plot representing PRC2 complex (EED, EZH2, and SUZ12) in edited LSK from Jak2VF-Dnmt3a-Cas9 and Jak2VF-Cas9 recipient mice.
Altered DNA methylation explains a minority of gene-expression changes after Dnmt3a loss. (A) Venn diagram showing overlap of gene significantly hypomethylated between compared data sets.24,26,43 (B) Venn diagram showing overlap between the hypomethylated gene core and the DNMT3A gene-expression core. (C) GSEA plot representing PRC2 complex regulated genes in edited LSK from Jak2VF-Dnmt3a-Cas9 and Jak2VF-Cas9 recipient mice. (D-G) GSEA plot representing PRC2 complex (EED, EZH2, and SUZ12) in edited LSK from Jak2VF-Dnmt3a-Cas9 and Jak2VF-Cas9 recipient mice.
Loss of Dnmt3a leads to increased accessibility at enhancer chromatin marks and activation of HSC gene expression
Enhancers are cis-acting distal regulatory elements, distributed widely throughout the genome and are highly regulated by posttranslational modifications to histone proteins.29,44,45 We identified aberrant PRC2-mediated gene-expression signature in Jak2VF-Dnmt3a-Cas9 compared with Jak2VF-Cas9 LSK (Figure 6C-G), with features of not only PRC2 loss, but also apparent gain of function, suggesting deregulation of PRC2 signaling coincident with Dnmt3a loss (Figure 6E-G). The PRC2 complex catalyzes methylation of H3K27, to the repressive H3K27 trimethylation (H3K27me3) mark.45 We therefore considered whether loss of Dnmt3a-mediated PRC2 H3K27me3 conversion may lead to failure of silencing stem cell gene-expression programs during differentiation, as seen in other models of DNMT3A mutation22,32 or Dnmt3a loss.15 We used ATAC-seq, a highly sensitive and reproducible method to examine genome-wide chromatin accessibility,46 specifically within highly purified GFP+ HSC-enriched populations. Loss of Dnmt3a function in Jak2VF-Dnmt3a-Cas9 caused a striking increase in chromatin accessibility, evident by the detection of 13 821 significantly gained peaks vs 89 lost peaks compared with Jak2VF-Cas9 (FDR < 0.05; Figure 7A). The majority of gained peaks were found in distal regulatory regions (intronic n = 6030, 44% and intergenic n = 5274, 38%), >2 kb away from the nearest gene promoter, whereas only 1045 (8%) of gained peaks were found within 1 kb of transcription start sites (TSSs) (supplemental Figure 7B). We annotated ATAC-seq peaks within functional regulatory elements including enhancers, promoters and repressive marks performed in a context-specific manner within HSC populations in mice.29 Promoter regions were defined by proximity to TSSs (±1 kb from TSS) and H3K4me3 marks. Enhancer elements were distal regulatory regions that had an H3K4me1 mark. When colocalized with H3K27ac marks, we annotated an active enhancer, whereas repressed enhancers had an H3K27me3 mark (supplemental Figure 7A). We observed close correlation and overlap between the 41 920 total annotated enhancer marks,29 and the ATAC-seq peaks (30 863 marks). Most of the gained peaks overlapped with active 2762 (88.9%) or primed 338 (10.9%) enhancer marks (supplemental Figure 7A,C). There was strong enrichment of gained peaks at active enhancers within 1 mega base (Mb) of Jak2VF-Dnmt3a-Cas9 upregulated genes (883, 88.9% of 928) (Figure 7B,D; supplemental Table 4, list of annotated differential peaks). Only a small proportion of differentially Jak2VF-Dnmt3a-Cas9 gained peaks (1.4%) overlapped with promoter marks (supplemental Figure 7D; Figure 7C). Altogether, these data demonstrate that loss of Dnmt3a leads to enhanced chromatin accessibility preferentially at active enhancer marks, and this drives HSC gene expression in vivo.
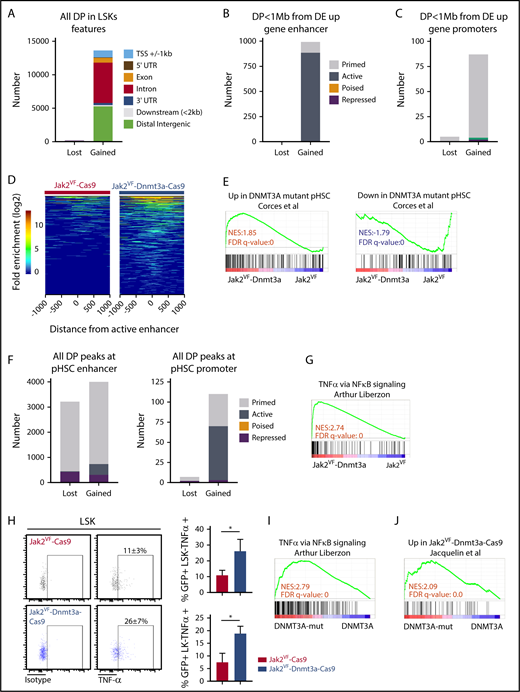
Dnmt3a loss leads to increased accessibility at enhancer chromatin marks and activation of inflammatory signaling. (A) Analysis of genome-wide differential peaks (DP) in Jak2VF-Dnmt3a-Cas9 compared with Jak2VF-Cas9 LSK recipient 8 weeks posttransplant. Peaks annotated according to their genomic features. Upstream or downstream ±1 kb TSS (blue), 5′ UTR (maroon), exon (orange), intron (red), 3′UTR (dark blue), ≤2 kb downstream of gene body (gray), distal intergenic (green), if not corresponding to any of previous defined feature (black). (B) DP FDR < 0.05 in Jak2VF-Dnmt3a-Cas9 compared with Jak2VF-Cas9 LSK recipient mice 8 weeks posttransplant within hematopoietic progenitor–specific (ST-HSCs + MPPs) enhancers, within 1 Mb of Jak2VF-Dnmt3a-Cas9 upregulated gene. Primed (gray), active (dark gray), poised (orange) or repressed (maroon). (C) DP (FDR < 0.05), in Jak2VF-Dnmt3a-Cas9 compared with Jak2VF-Cas9 LSK recipient mice 8 weeks posttransplant, at promoter regions (containing H3K4Me3 marks within 1 kb up stream or downstream of TSS from nearest Dnmt3a regulated gene). Primed (gray), active (green), repressed (maroon). (D) Heat map represents DP within active enhancers. The x-axis represents the distance of the peak from the active enhancer center and each horizontal line on the y-axis represent the peaks log2 transformed fold enrichment above the background in Jak2VF-Dnmt3a-Cas9 and Jak2VF-Cas9 controls. (E) GSEA plot for DNMT3A-MUT pHSCs DE gene defined in human pHSCs comparing LSK from Jak2VF-Dnmt3a-Cas9 and Jak2VF-Cas9 recipient mice. (F) Number of DP (FDR < 0.05) within annotated enhancers (left) and annotated promoters (right) from DNMT3A-WT and DNMT3A-MUT pHSCs. Primed (gray), active (dark gray), repressed (maroon). (G) GSEA plot analyzing TNFα gene-expression signature within LSK from Jak2VF-Dnmt3a-Cas9 and Jak2VF-Cas9 recipient mice. NES (top) and FDR q value (bottom rows) are indicated. (H) Intracellular staining for TNFα production in LK and LSK from Jak2VF-Dnmt3a-Cas9 and Jak2VF-Cas9 control. TNFα staining and percentage of TNFα + (LSK or LK+) in Jak2VF-Cas9 and Jak2VF-Dnmt3a-Cas9. P values were calculated using the unpaired Student t test, *P < .05, mean ± SD. (I) GSEA plot demonstrating enrichment of TNFα gene-expression signature within MF patients with mutated DNMT3A vs nonmutated controls. (J) GSEA plot demonstrating enrichment of murine gene-expression signature derived from Jak2VF-Dnmt3a-Cas9 LSK, within human MF with mutated DNMT3A.
Dnmt3a loss leads to increased accessibility at enhancer chromatin marks and activation of inflammatory signaling. (A) Analysis of genome-wide differential peaks (DP) in Jak2VF-Dnmt3a-Cas9 compared with Jak2VF-Cas9 LSK recipient 8 weeks posttransplant. Peaks annotated according to their genomic features. Upstream or downstream ±1 kb TSS (blue), 5′ UTR (maroon), exon (orange), intron (red), 3′UTR (dark blue), ≤2 kb downstream of gene body (gray), distal intergenic (green), if not corresponding to any of previous defined feature (black). (B) DP FDR < 0.05 in Jak2VF-Dnmt3a-Cas9 compared with Jak2VF-Cas9 LSK recipient mice 8 weeks posttransplant within hematopoietic progenitor–specific (ST-HSCs + MPPs) enhancers, within 1 Mb of Jak2VF-Dnmt3a-Cas9 upregulated gene. Primed (gray), active (dark gray), poised (orange) or repressed (maroon). (C) DP (FDR < 0.05), in Jak2VF-Dnmt3a-Cas9 compared with Jak2VF-Cas9 LSK recipient mice 8 weeks posttransplant, at promoter regions (containing H3K4Me3 marks within 1 kb up stream or downstream of TSS from nearest Dnmt3a regulated gene). Primed (gray), active (green), repressed (maroon). (D) Heat map represents DP within active enhancers. The x-axis represents the distance of the peak from the active enhancer center and each horizontal line on the y-axis represent the peaks log2 transformed fold enrichment above the background in Jak2VF-Dnmt3a-Cas9 and Jak2VF-Cas9 controls. (E) GSEA plot for DNMT3A-MUT pHSCs DE gene defined in human pHSCs comparing LSK from Jak2VF-Dnmt3a-Cas9 and Jak2VF-Cas9 recipient mice. (F) Number of DP (FDR < 0.05) within annotated enhancers (left) and annotated promoters (right) from DNMT3A-WT and DNMT3A-MUT pHSCs. Primed (gray), active (dark gray), repressed (maroon). (G) GSEA plot analyzing TNFα gene-expression signature within LSK from Jak2VF-Dnmt3a-Cas9 and Jak2VF-Cas9 recipient mice. NES (top) and FDR q value (bottom rows) are indicated. (H) Intracellular staining for TNFα production in LK and LSK from Jak2VF-Dnmt3a-Cas9 and Jak2VF-Cas9 control. TNFα staining and percentage of TNFα + (LSK or LK+) in Jak2VF-Cas9 and Jak2VF-Dnmt3a-Cas9. P values were calculated using the unpaired Student t test, *P < .05, mean ± SD. (I) GSEA plot demonstrating enrichment of TNFα gene-expression signature within MF patients with mutated DNMT3A vs nonmutated controls. (J) GSEA plot demonstrating enrichment of murine gene-expression signature derived from Jak2VF-Dnmt3a-Cas9 LSK, within human MF with mutated DNMT3A.
We next sought to validate these findings in the context of human myeloid malignancies with mutant DNMT3A. We examined published gene expression and chromatin accessibility of preleukemic HSCs (pHSCs).47 pHSCs resemble normal HSPCss in immunophenotype (CD34+CD38−CD99−Tim3−) and frequently contain founder leukemogenic mutations (including DNMT3A). We focused on a cohort of DNMT3A mutant and DNMT3A WT pHSCs (n = 5 vs 6) with fully annotated ATAC-seq and gene-expression data.47 Gene expression from DNMT3A mutant pHSCs correlated with the transcriptional signatures observed in Jak2VF-Dnmt3a-Cas9 HSCs (Figure 7E; upregulated genes: normalized enrichment score [NES] = 2, FDR < 0.001; downregulated genes: NES = −2, FDR = 0.001), demonstrating the relevance of this pHSC model to our Dnmt3a-Jak2VF model. We observed a gain of chromatin accessibility in DNMT3A mutant pHSCs compared with DNMT3A WT pHSC controls, predominantly within characterized active and primed enhancer regions of normal CD34+ cells (Figure 7F), demonstrating the relevance of our data to human disease.
Dnmt3a loss increases inflammation
Patients with MF exhibit significantly elevated levels of proinflammatory cytokines that contribute to fibrosis and this is associated with adverse prognosis.9,48 Jak2VF-Dnmt3a-Cas9 LSKs showed a strong enrichment for inflammatory pathways, specifically tumor necrosis factor α (TNFα), even though these mice would not go on to develop MF for many months (Figure 7G). Deregulated TNFα signaling is a consistent, pathognomonic finding in other MF models including mice with a constitutively active MPLW515L gene mutation,49 and MF driven by EZH2 loss in Jak2VF.50 Increased TNFα signaling was driven by pathologic recruitment of active enhancer loci within Jak2VF-Dnmt3a-Cas9 stem cells, demonstrated by 46 of the 68 upregulated genes in this pathway (67.6%) showing increased DNA accessibility at active enhancers (supplemental Table 5; supplemental Figure 7E). Jak2VF-Dnmt3a-Cas9 LSK and LK cells showed increased production of TNFα, validating these findings (Figure 7H). Finally, RNA-seq was performed on patients with MF with mutated DNMT3A vs nonmutated controls. DNMT3A mutated MF samples showed strong enrichment of inflammatory TNFα pathways and correlated strongly with the gene-expression changes seen in murine Jak2VF-Dnmt3a-Cas9 HSCs, thus validating our findings in the context of human disease (Figure 7I-J). Altogether, these data are consistent with Dnmt3a loss of function leading to pathological activation of enhancer elements that drive MF through activated TNFα signaling and proinflammatory gene expression (see visual abstract).
Discussion
The long-term survival of most patients with PV and ET is excellent.8 In contrast, advanced MPNs such as MF or AML causes substantial morbidity and has a dramatic negative impact on survival.5-8 Understanding the factors that contribute to myelofibrotic transformation of MPNs is essential to identify patients early for clinical trials, and to develop treatments that prevent or reverse these processes in patients. We used CRISPR/Cas9 technology to induce cooperating lesions in Dnmt3a in the Jak2VF-induced PV model, leading to fully penetrant MF. This method is highly efficient, can be used to edit HSCs in vivo, and may be extended to test the effects of other secondary mutations commonly found in transformed MPNs such as TP53, EZH2, or ASXL1.10,51 Our work thereby establishes a platform to sequentially examine the effects of novel mutations on MPN disease biology and response to treatment. We observed excellent correlation between the transcriptional effects of Dnmt3a loss22-26 by CRISPR vs genetic deletion of Dnmt3a or mutant Dnmt3a expression, and this also correlates with phenotypic changes (differentiation block and gain of stem cell identity). These results show that de novo mutation acquisition in Jak2VF MPN-driven pathology can modify HSC biology and lead to disease evolution. In vitro Dnmt3a editing was sufficient to immortalize LSK, and enriched for HSC phenotypic markers and gene expression. However, the overall transcriptional program induced by in vitro Dnmt3a loss did not reproduce the findings from other models, or from patients, suggesting that extrinsic signals from the proinflammatory microenvironment contribute to the development of MF,52,53 further evidenced by the depletion of nonedited Jak2VF LT-HSCs in myelofibrotic recipients (Figure 4B). Altogether, this work demonstrates the power of in vivo CRISPR/Cas9 genomic editing in faithfully recapitulating the findings of human disease in a murine system.
In vivo deletion of Dnmt3a in HSCs using CRISPR/Cas9 induced a dominant transcriptional signature that closely reflected other genetically engineered mouse models and primary human leukemia and advanced-stage MPNs. Genome wide DNA methylation changes did not show such close overlap between studies, nor did it explain the majority of transcriptional changes. This led us to hypothesize that the Dnmt3a was acting predominantly through the regulation of chromatin topology and methylation of specific chromatin marks. Using ATAC-seq on in vivo–edited HSC populations, we were able to demonstrate a widespread increase in chromatin accessibility at active enhancers that have been shown to regulate HSC gene expression.29,32,44,45
These data, across distinct clinical contexts and models, show that DNMT3A mutant blood cancers are “enhanceropathies,” driven by reproducible transcriptional programs downstream of enhancer activation. The mechanism of this pathologic enhancer activation appears to be through the failure to convert active enhancers to the repressive H3K27me3 marks. This is an important step in developmental biology and is critical in silencing the stemness program during differentiation.54 H3K27Ac and H3K27me3 are mutually exclusive55 and the PRC2 complex, together with histone acetyltransferases p300 and CBP, regulate this conversion.56,57 The direct interaction between PRC2 and WT or mutant Dnmt3a remain active research questions of interest.58 Loss of DNMT3A induces focal hypomethylation, decreases PRC2 recruitment at H3K27 favoring the maintenance of an acetylation mark, and leads to sustained enhancer activation, and persistent stem cell gene expression. We found that increased chromatin accessibility was not restricted to enhancer loci associated with activated genes, and therefore additional factors may also contribute to disease progression.
Alterations within cis-acting regulatory elements can drive MPN-associated inflammation via constitutive activation of NF-κB signaling,49,50 and, more broadly, constitutive NF-κB pathway activation has been reported in AML.59,60 We found that Dnmt3a loss of function is associated with strong enrichment of TNFα via NF-κB pathways, again driven by increased chromatin accessibility and pathologic enhancer activation, leading to MF. These data are analogous to the changes seen with Ezh2 loss in Jak2V617F MF, and suggest a common epigenetic mechanism of MF transformation from early-stage MPNs, mediated by inflammatory signaling. This has additional therapeutic relevance, as bromodomain inhibitors have remarkable activity in the context of enhancer activation.49,61
We postulate an important role of TNFα and inflammatory cytokine signaling following Dnmt3a loss in Jak2VF MPNs, consistent with other reports.62 In patients with JAK2VF PV, DNMT3A mutations appear to be associated with lack of response to pegylated interferon α and many patients may actually acquire a DNMT3A mutation during interferon treatment.63 Furthermore, in the context of other potent oncogenes that activate tyrosine kinase signaling pathways, such as NRas32 and FLT3ITD15,24, DNMT3A mutations drive resistance to common chemotherapy agents.24 This CRISPR-mediated combinatorial model provides a scalable and tractable opportunity to evaluate the effects of specific therapies on Jak2VF HSCs that contain additional genetic lesions associated with progression to post-PV MF or AML.
Overall, this work demonstrates the power of in vivo CRISPR-Cas9 gene editing to model disease progression and oncogene cooperativity in vivo. Mechanistically, Dnmt3a loss accelerated Jak2VF MPNs through aberrant stem cell and inflammatory gene expression and the failure to silence developmentally active stem cell enhancers. Such knowledge has the potential to shape the development of targeted therapeutic approaches in transformed MPNs, a highly chemorefractory disease associated with poor prognosis. This work reinforces the prognostic relevance of the genetic landscape of MPNs at diagnosis and as these genetic changes evolve over time. Finally, these data also support clinical trials to test whether genetic profiling can be used to prospectively select high-risk patients for alternate clinical management to prevent progression to transformed MPNs.
The online version of this article contains a data supplement.
The publication costs of this article were defrayed in part by page charge payment. Therefore, and solely to indicate this fact, this article is hereby marked “advertisement” in accordance with 18 USC section 1734.
Acknowledgments
The authors are grateful for the discussions and helpful advice from many colleagues including Stacey Edwards, Juliet French, Haran Sivakumaran, Mark Smyth, Ann Mullally, Michael Milsom, and Florian Heidel. The authors acknowledge support from the flow cytometry core facility (Grace Chojnowski), animal facility, and support division of QIMR Berghofer.
This work was supported by the Cancer Australia/Cure Cancer Australia Foundation (1124096) and the Gordon and Jessie Gilmour Leukaemia Research Trust. S.W.L. is a CSL Centenary Fellow and has received National Health and Medical Research Council (NHMRC) support (1064569, 1025494) and support from the MPN Research Foundation/MPN Alliance Australia. G.R.H. is an NHMRC Senior Principal Research fellow. D.H. is supported by the German Cancer Aid (111743). J.E.P. is supported by the NHMRC (1042934, 1102589, 1139787, 1139811) and The Translational Cancer Research Network of the Cancer Institute of NSW and NSW Pathology.
Authorship
Contribution: S.J. conceptualized the study, designed research, performed experiments, analyzed the results, and wrote the manuscript; J.S. performed bioinformatics analysis; L.C., T.V., A.S., M.B., M.H., B.W., A.P., J.G., V.L., and R.A. performed experiments; E.B. developed the study methodology and obtained resources; S.K. and N.W. visualized the study; L.B.H. designed experiments; J.E.P. developed the study methodology; F.S., K.D., L.B., and R.K.R. collected, annotated, and provided clinical samples and data and reviewed the manuscript; D.H. obtained resources and designed the research; G.R.H. validated the study and designed the research; and S.W.L. supervised the study, designed the research, and wrote the manuscript.
Conflict-of-interest disclosure: The authors declare no competing financial interests.
Correspondence: Steven W. Lane, QIMR Berghofer Medical Research Institute, 300 Herston Rd, Herston QLD 4006, Brisbane, Australia; e-mail: steven.lane@qimrberghofer.edu.au.

This feature is available to Subscribers Only
Sign In or Create an Account Close Modal