Key Points
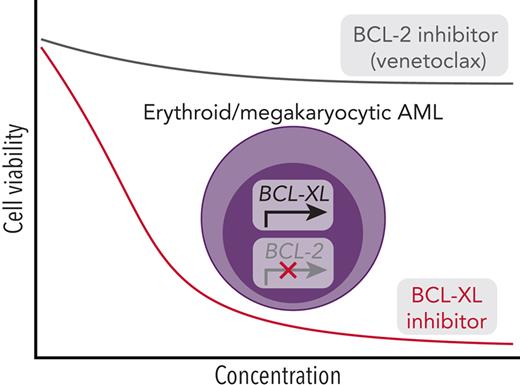
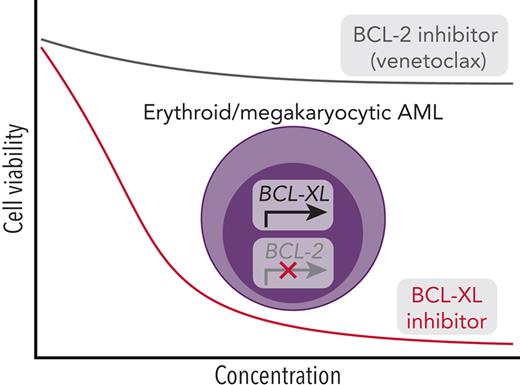
High-throughput screening of >500 drugs identifies BCL-XL inhibitor sensitivity and venetoclax resistance in erythroid/megakaryocytic AML.
BCL2L1 (BCL-XL) is highly expressed in erythroid/megakaryocytic AML and is essential for their survival based on CRISPR screens.
Abstract
Myeloid neoplasms with erythroid or megakaryocytic differentiation include pure erythroid leukemia, myelodysplastic syndrome with erythroid features, and acute megakaryoblastic leukemia (FAB M7) and are characterized by poor prognosis and limited treatment options. Here, we investigate the drug sensitivity landscape of these rare malignancies. We show that acute myeloid leukemia (AML) cells with erythroid or megakaryocytic differentiation depend on the antiapoptotic protein B-cell lymphoma (BCL)-XL, rather than BCL-2, using combined ex vivo drug sensitivity testing, genetic perturbation, and transcriptomic profiling. High-throughput screening of >500 compounds identified the BCL-XL–selective inhibitor A-1331852 and navitoclax as highly effective against erythroid/megakaryoblastic leukemia cell lines. In contrast, these AML subtypes were resistant to the BCL-2 inhibitor venetoclax, which is used clinically in the treatment of AML. Consistently, genome-scale CRISPR-Cas9 and RNAi screening data demonstrated the striking essentiality of BCL-XL-encoding BCL2L1 but not BCL2 or MCL1, for the survival of erythroid/megakaryoblastic leukemia cell lines. Single-cell and bulk transcriptomics of patient samples with erythroid and megakaryoblastic leukemias identified high BCL2L1 expression compared with other subtypes of AML and other hematological malignancies, where BCL2 and MCL1 were more prominent. BCL-XL inhibition effectively killed blasts in samples from patients with AML with erythroid or megakaryocytic differentiation ex vivo and reduced tumor burden in a mouse erythroleukemia xenograft model. Combining the BCL-XL inhibitor with the JAK inhibitor ruxolitinib showed synergistic and durable responses in cell lines. Our results suggest targeting BCL-XL as a potential therapy option in erythroid/megakaryoblastic leukemias and highlight an AML subgroup with potentially reduced sensitivity to venetoclax-based treatments.
Introduction
Acute myeloid leukemia (AML) with erythroid or megakaryocytic differentiation includes acute erythroid leukemia (AEL) and acute megakaryoblastic leukemia (AMKL), which originate from the erythrocyte and megakaryocyte lineages arising from a common precursor, the megakaryocyte-erythrocyte progenitor (MEP). At the molecular level, these lineages share many regulators such as the GATA1 and GFI1B transcription factors (TFs) and an important role of JAK-STAT signaling.1
AEL is characterized by excessive proliferation of erythroid lineage precursors. In the 2001 World Health Organization classification, AEL was part of the AML classification system and was categorized into 2 subgroups, FAB M6a and FAB M6b, based on the proportion of erythroid and myeloid lineage cells.2 In the revised 2016 World Health Organization classification, AML FAB M6a was merged under the myelodysplastic syndrome (MDS) category, whereas pure erythroid leukemia remained the only type of acute leukemia with an erythroid phenotype.3,4 Genetically, patients with AEL are characterized by frequent TP53 (40.3%), STAG2 (20.1%), KMT2A (20.2%), TET2 (16.9%), and NPM1 (14.5%) mutations and poor risk cytogenetics.5,6 In particular, patients with TP53 mutations have a dismal outcome, and there are few viable treatment options.5,6 Intriguingly, erythropoietin receptor (EPOR)/JAK2 gains and amplifications were recently identified in TP53-mutated cases associated with JAK inhibitor sensitivity in preclinical models.5 Moreover, targetable signaling mutations are found in 45% of AEL cases, indicating a need for new therapeutic approaches for most of these patients.6
AMKL is characterized by excessive production of megakaryoblasts within the bone marrow (BM), extensive myelofibrosis, anemia, and thrombocytopenia.1 AMKL comprises the pediatric Down syndrome-associated AMKL with a relatively good prognosis, non–Down syndrome pediatric AMKL linked to the RBM15-MKL1 translocation, and adult AMKL, which harbors cytogenetic abnormalities, such as −5, −7, +8, 11q, and mutations in the tyrosine kinases JAK2 and JAK3.7 Compared with other adult AML, adult AMKL is characterized by poor prognosis,8-10 frequent TP53 mutations,11 and a median overall survival of 9 months.12
The therapeutic landscape of AML has changed rapidly recently with the approval of new molecularly targeted therapies including FLT3 inhibitors,13,14 IDH1/IDH2 inhibitors,15,16 a Hedgehog inhibitor,17 and the B-cell lymphoma 2 (BCL-2) inhibitor venetoclax.18 However, whether these or other targeted agents are effective in the rare AML subtypes with erythroid or megakaryocytic differentiation has not been studied.
We previously found that monocytic AML cells show resistance to BCL-2 inhibition ex vivo, consistent with increased MCL1 and decreased BCL2 expression during normal monocytic differentiation.19 Similarly, BCL-XL is essential for effective erythropoiesis and maintaining platelet survival.20-22 Hypothesizing that the distinct lineage of AML with erythroid or megakaryocytic differentiation may confer specific vulnerabilities, we sought to identify selective dependencies in these rare subtypes compared with other AML types. Using high-throughput drug screens, we identify BCL-XL as a potential therapeutic target and uncover venetoclax resistance in AML cells differentiated along the erythroid or megakaryocytic lineages, corroborated by elevated gene and protein expression and sensitivity to genetic perturbation of BCL-XL.
Methods
More detailed descriptions of the methods are available in supplemental Methods (available on the Blood website).
Cell lines and patient samples
AML cell lines (n = 21; supplemental Table 1) were obtained from the Deutsche Sammlung von Mikroorganismen und Zellkulturen (DSMZ) or the American Type Culture Collection (ATCC).
Samples from patients with AML (n = 21) collected at the time of diagnosis, relapse, or refractory stage (supplemental Table 1) and 2 healthy BM samples were obtained from Helsinki University Hospital (Helsinki, Finland), MD Anderson Cancer Center (Houston, TX), and Rigshospitalet, Copenhagen University Hospital (Copenhagen, Denmark) after written informed consent. The study was approved by a local ethics committee (Helsinki University hospital permit number 303/13/03/01/2011, MDACC IRB protocols LAB01-473/LAB02-652 and Copenhagen University Hospital permit number 1705391) and abided by the principles of the Declaration of Helsinki.
Drug sensitivity profiling
The drug library consisted of 528 approved and investigational oncology compounds in 5 concentrations across a 10 000-fold concentration range (supplemental Table 2). The BCL-2 family–specific drug plate consisted of 8 different BCL-2 family inhibitors in triplicate in 9 different concentrations across a 10 000-fold concentration range (supplemental Table 3). All cells were incubated with the drugs for 72 hours at 37°C and 5% CO2 and viability was assessed using the CellTiter-Glo assay (Promega). The efficacy of a drug was measured as a drug sensitivity score.23 For combination screens, 384-well drug combination plates containing five 8 × 8 combination matrices were used. Synergy, efficacy, and integrated synergy and efficacy score were calculated using SynToxProfiler.24
Genome-wide CRISPR and RNAi screen data analysis
Genome-wide CRISPR screen data from the DepMap project25 and RNA interference (RNAi) screening data from the Achilles project26 were downloaded from the DepMap portal. Differences in gene essentiality between erythroid/megakaryocytic leukemia and other AML cell lines were assessed using Welch t test on the gene effect values followed by Benjamini-Hochberg adjustment of P values.
Western blot analysis
Extracted proteins of the 21 used cell lines were transferred onto nitrocellulose membranes and incubated with primary antibodies obtained from Cell Signaling Technology: anti–BCL-2 (cat. #4223), anti–MCL-1 (#5453) and anti–BCL-XL (#2764). Secondary infrared antibodies from LI-COR Biosciences were used for detection and the signal was visualized with the Odyssey imaging system.
Gene expression analysis
Single-cell RNA sequencing (scRNA-seq)
Fresh mononuclear cells from 2 patients with AML (AML-1, peripheral blood and AML-5, BM) were subjected to scRNA-seq using the Chromium Single Cell 3′ v3.1 Dual Index Reagent Kit (10x Genomics). The Cell Ranger v4.0 analysis pipelines (10x Genomics) were used to preprocess data, and the R-package Seurat31 in R and Python library scVI32 (0.5.0) in Python (3.7.4) were used for further scRNA-seq data analysis.
Flow cytometry–based drug sensitivity profiling
Compounds were dissolved in 100% dimethyl sulfoxide and dispensed on a 384-well plate in a 7-dose half-log concentration series. Freshly isolated mononuclear cells were dispensed to compound plates and incubated for 72 hours at 37°C and 5% CO2. After staining with monoclonal antibodies and viability dyes, cells were analyzed with an iQue Screener Plus flow cytometer (Intellicyt). Remaining live single cells after drug treatment were gated using FlowJo (Treestar), and unsupervised clustering was performed using the cluster function in the CATALYST R package relying on FlowSOM33 and ConsensusClusterPlus.34
Mouse xenograft experiments
The HEL erythroleukemia cell line was transduced with LV-SFFV-Luc2-P2A-EmGFP lentivirus (Imanis Life Sciences). The suspension of A-1331852 (Chemietek) was prepared as described by Leverson et al.35 All procedures were approved by the National Project Authorisation Board, protocol ESAVI 691. Four million HEL-Luc-GFP cells were injected intravenously into female nonobese diabetic/severe combined immunodeficiency mice (Janvier Labs). Mice were divided into control (n = 5) and treatment groups (n = 6) and treated twice a day orally with A-1331852 (25 mg/kg) or vehicle for 2 weeks. Tumor burden was measured twice per week using bioluminescence imaging.
Long-term drug combination assays
TF1, CMK, and HEL cells were used to assess the long-term efficacy of A-1331852 (50 nM), venetoclax (300 nM), azacitidine (500 nM), ruxolitinib (300 nM), and A-1331852 combined with the other tested drugs. Cells were seeded at 250 000 cells per mL, viable cells were calculated every 3 to 4 days and reseeded in fresh medium and compounds. Cells were treated with the compounds for 3 weeks and subsequently cultured for 2 weeks to measure the recovery of the cells after withdrawing the drugs.
Results
High-throughput screens identify BCL-XL inhibitors as effective against erythroid and megakaryoblastic leukemia cell lines
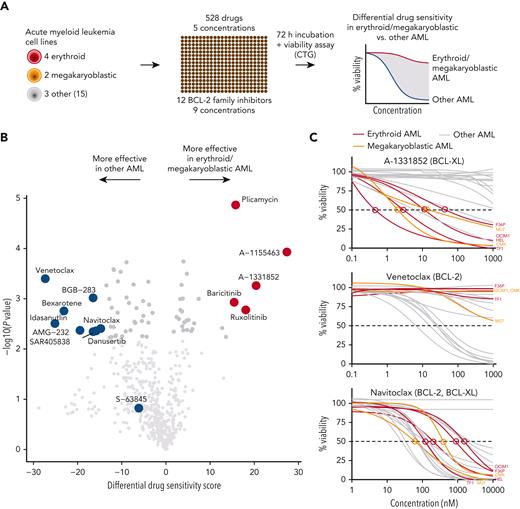
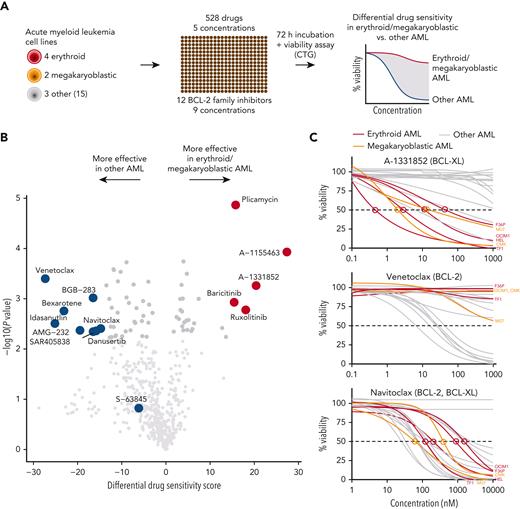
To identify druggable dependencies in erythroid and megakaryoblastic leukemias, we screened over 500 drugs across a 10 000-fold concentration range in 4 erythroid (F36P, HEL, OCIM1, and TF1), 2 megakaryoblastic (CMK, M07), and 3 other AML cell lines (MOLM13, MV411, and OCIAML2). A comparison of the drug responses in erythroid/megakaryoblastic and nonerythroid AML cell lines highlighted 2 apoptotic modulators targeting BCL-XL, A-133185235 and A-1155463,36 as selectively effective compounds in erythroid and megakaryoblastic cells (Figure 1A-B; supplemental Table 2). In contrast, the BCL-2 inhibitor venetoclax emerged as the least effective drug in erythroid/megakaryoblastic AML compared with others. In addition, the RNA synthesis inhibitor plicamycin and the JAK inhibitors ruxolitinib and baricitinib showed efficacy in erythroid and megakaryoblastic leukemias. Of note, plicamycin has been shown to inhibit the FLI1 and SP1 TFs regulating erythroid and megakaryocytic development.37-40
High-throughput screening identifies BCL-XL inhibitors with selective efficacy against erythroid and megakaryoblastic leukemias. (A) Schematic of the high-throughput drug sensitivity and resistance testing experiments. Four erythroid (F36P, HEL, OCIM1, and TF1), 2 megakaryoblastic (CMK and M07), and 3 other AML cell lines (MOLM13, MV411, and OCIAML2) were screened using over 500 drugs in 5 different concentrations. In addition, a focused screen using 8 BCL-2 family inhibitors in 9 different concentrations in 4 erythroid, 2 megakaryoblastic, and 15 other AML cell lines was performed. (B) Volcano plot of drug sensitivity of erythroid or megakaryoblastic AML cell lines (n = 6) compared with other AML (n = 3) from screening of 528 compounds. Drugs with FDR <5% are colored in dark gray and drugs with FDR <5% and absolute differential DSS >15 are colored in red or blue. In addition, S-63845 targeting MCL-1 is colored in blue. (C) Dose-response curves of the BCL-XL inhibitor A-1331852, the BCL-2 inhibitor venetoclax, and the BCL-2/BCL-XL inhibitor navitoclax in 21 AML cell lines. DSS, drug sensitivity score; FDR, false discovery rate.
High-throughput screening identifies BCL-XL inhibitors with selective efficacy against erythroid and megakaryoblastic leukemias. (A) Schematic of the high-throughput drug sensitivity and resistance testing experiments. Four erythroid (F36P, HEL, OCIM1, and TF1), 2 megakaryoblastic (CMK and M07), and 3 other AML cell lines (MOLM13, MV411, and OCIAML2) were screened using over 500 drugs in 5 different concentrations. In addition, a focused screen using 8 BCL-2 family inhibitors in 9 different concentrations in 4 erythroid, 2 megakaryoblastic, and 15 other AML cell lines was performed. (B) Volcano plot of drug sensitivity of erythroid or megakaryoblastic AML cell lines (n = 6) compared with other AML (n = 3) from screening of 528 compounds. Drugs with FDR <5% are colored in dark gray and drugs with FDR <5% and absolute differential DSS >15 are colored in red or blue. In addition, S-63845 targeting MCL-1 is colored in blue. (C) Dose-response curves of the BCL-XL inhibitor A-1331852, the BCL-2 inhibitor venetoclax, and the BCL-2/BCL-XL inhibitor navitoclax in 21 AML cell lines. DSS, drug sensitivity score; FDR, false discovery rate.
BCL-XL and other BCL-2 family proteins, namely BCL-2 and MCL-1, inhibit the initiating steps of programmed cell death by sequestering proapoptotic proteins, such as BAX and BAK.41 To obtain a more comprehensive view of BCL-2 family inhibitor efficacy on AML cell lines, we conducted a focused screen using 8 BCL-2 family inhibitors in 4 erythroid, 2 megakaryoblastic, and 15 other AML cell lines (supplemental Table 3). This analysis confirmed the selectivity of the BCL-XL inhibitors A-1331852 and A-1155463 to erythroid and megakaryoblastic cells (Figure 1C; supplemental Figure 1). In contrast, venetoclax targeting BCL-2 and S-63845 targeting MCL-1 were effective in other AML subtypes (Figure 1C). Navitoclax, targeting BCL-XL, BCL-2, and BCL-W, was broadly effective but not as potent as the BCL-XL–selective inhibitors in erythroid and megakaryoblastic leukemias (Figure 1B-C).
Genome-scale CRISPR-Cas9 screens demonstrate BCL2L1 dependency in erythroid and megakaryoblastic leukemias
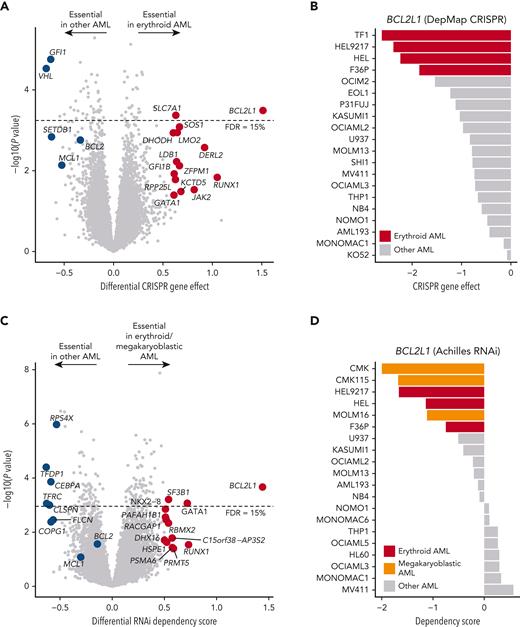
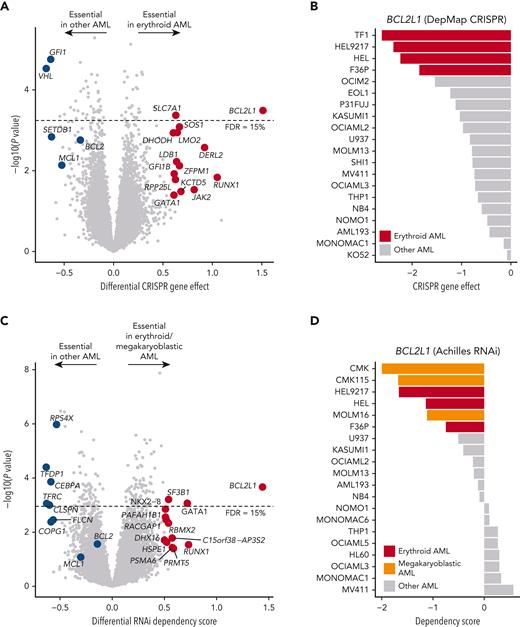
To confirm the on-target mechanism of BCL-XL inhibition, we next evaluated the genetic dependencies of erythroid and megakaryoblastic leukemias. First, we analyzed genome-wide CRISPR-Cas9 loss-of-function screening data from DepMap,25 comprising 5 erythroid and 15 other AML cell lines. Strikingly, BCL2L1 was among the top essential genes in erythroid AML cell lines compared with other subtypes (Figure 2A-B; supplemental Table 4). Other essential genes included GATA1 and GFI1B, which encode TFs essential in erythropoiesis and megakaryopoiesis implicated in BCL2L1 regulation,42 but are currently undruggable in contrast to BCL-XL. Consistent with drug sensitivity data, erythroid cell lines were also dependent on the ruxolitinib target JAK2. An independent CRISPR screening data set43 confirmed the strong BCL2L1 dependency in erythroid AML cell lines (supplemental Figure 2).
Genetic dependency on BCL2L1 in erythroid and megakaryoblastic leukemias. (A) Volcano plot of the most essential genes in erythroid compared with other AML cell lines in genome-scale CRISPR-Cas9 screening data from DepMap. Genes with a nominal P value < .05 and absolute values of differential gene effect >0.6 are colored in red or blue. In addition, the BCL-2 family members BCL2 and MCL1 are colored in blue. Fifteen percent FDR is indicated with a dashed line. (B) BCL2L1 CRISPR gene knockout effect in AML cell lines. More negative values indicate stronger dependency. (C) Volcano plot of most essential genes in erythroid/megakaryoblastic AML cell lines compared with other AML cell lines in RNAi screening data from the Achilles project. Genes with a nominal P value < .05 and absolute values of differential gene effect >0.5 are colored in red or blue. In addition, the BCL-2 family members BCL2 and MCL1 are colored in blue. Fifteen percent FDR is indicated with a dashed line. (D) BCL2L1 RNAi dependency score in AML cell lines. More negative values indicate stronger dependency. FDR, false discovery rate.
Genetic dependency on BCL2L1 in erythroid and megakaryoblastic leukemias. (A) Volcano plot of the most essential genes in erythroid compared with other AML cell lines in genome-scale CRISPR-Cas9 screening data from DepMap. Genes with a nominal P value < .05 and absolute values of differential gene effect >0.6 are colored in red or blue. In addition, the BCL-2 family members BCL2 and MCL1 are colored in blue. Fifteen percent FDR is indicated with a dashed line. (B) BCL2L1 CRISPR gene knockout effect in AML cell lines. More negative values indicate stronger dependency. (C) Volcano plot of most essential genes in erythroid/megakaryoblastic AML cell lines compared with other AML cell lines in RNAi screening data from the Achilles project. Genes with a nominal P value < .05 and absolute values of differential gene effect >0.5 are colored in red or blue. In addition, the BCL-2 family members BCL2 and MCL1 are colored in blue. Fifteen percent FDR is indicated with a dashed line. (D) BCL2L1 RNAi dependency score in AML cell lines. More negative values indicate stronger dependency. FDR, false discovery rate.
As the CRISPR screening data did not include megakaryoblastic leukemias, we additionally analyzed RNAi screening data of 3 erythroid and 3 megakaryoblastic AML cell lines compared with 14 other AML cell lines. This analysis supported the findings from the CRISPR data regarding erythroid AML and demonstrated essentiality of BCL2L1 also in megakaryoblastic AML (Figure 2C-D). Interestingly, also the erythroid blast phase chronic myeloid leukemia cell lines LAMA84 and K562 were sensitive to BCL2L1 knockdown, suggesting that chronic myeloid leukemia cells differentiated along the erythroid lineage also depend on BCL-XL (supplemental Figure 2C). In contrast, erythroid and megakaryoblastic cells were insensitive to silencing of BCL2 or MCL1 by either CRISPR-Cas9 or RNAi, indicating that BCL-XL is the essential BCL-2 family prosurvival protein in erythroid and megakaryoblastic leukemia cell lines (Figure 2A,C).
High BCL2L1 expression in erythroid and megakaryocytic leukemias
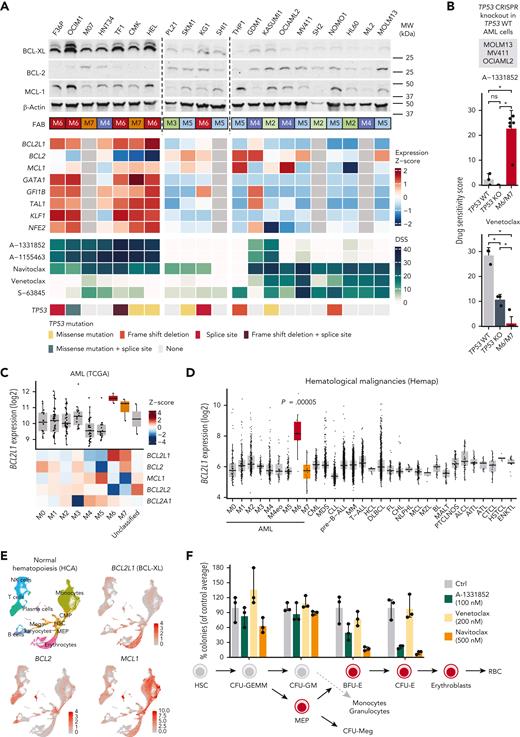
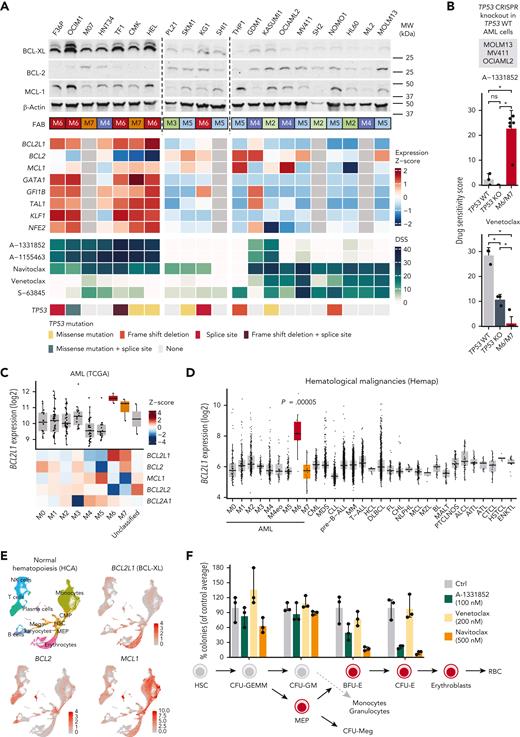
We next assessed whether increased expression of BCL2L1 or other factors underlie the functional dependency on BCL-XL. Erythroid and megakaryoblastic AML cell lines expressed elevated levels of BCL2L1 compared with other subtypes (Figure 3A). These cell lines also expressed TFs characteristic of the erythroid and megakaryocytic lineages, suggesting an association of BCL2L1 with the erythroid/megakaryocytic transcriptional program. GFI1B knockdown in the K562 erythroleukemia cells44 reduced BCL2L1 levels, supporting the role of erythroid/megakaryocytic TFs such as GFI1B in promoting BCL2L1 expression (supplemental Figure 2D). The observed druggable antiapoptotic protein dependencies were also reflected in the protein levels of BCL-XL together with the relatively low BCL2 in erythroid/megakaryoblastic cell lines (Figure 3A). Of note, MCL1 protein levels did not markedly differ between the erythroid/megakaryoblastic and other cell lines, although the erythroid/megakaryoblastic cells showed lower MCL-1 inhibitor sensitivity (supplemental Figure 1).
High BCL-XL expression in erythroid and megakaryoblastic leukemia underlies sensitivity to BCL-XL inhibition. (A) Protein levels of BCL-2 family members of BCL-XL, BCL-2, and MCL-1 in 21 AML cell lines. FAB subtype, expression of BCL-2 family genes and erythroid lineage TFs in AML cell lines from the CCLE data set (gray color, data not available), drug sensitivity scores of BCL-2 family inhibitors, and TP53 mutations are shown below as heatmaps. (B) Sensitivity of parental (TP53 WT) and CRISPR-mediated TP53 knockout (TP53 KO) variants of MOLM13, MV411, and OCIAML2 cell lines to A-1331852 and venetoclax as drug sensitivity scores. Erythroid/megakaryocytic AML cell lines are shown as a comparison. P values were obtained using paired Welch t tests (KO vs WT) and Wilcoxon rank-sum tests (M6/M7 vs others). Bar heights indicate mean, error bars indicate standard deviation, and dots indicate individual cell lines. (C) Expression of BCL-2 family genes in AML FAB subtypes in the TCGA data set. In the box plot, the horizontal line indicates the median, boxes indicate the interquartile range, and whiskers extend from the hinge to the smallest/largest value, at most 1.5 interquartile range from the hinge. (D) BCL2L1 (BCL-XL) expression across hematological malignancies in the Hemap data set. P value for AML M6 samples compared with all other samples using Wilcoxon rank-sum test is shown. Box plot as in panel C. (E) UMAP plots of single-cell RNA-seq data of normal hematopoiesis from the HCA, with cell type annotations based on the reference-based method SingleR and BCL2L1, BCL2, and MCL1 expression levels as normalized and scaled log-transformed counts colored on the plots. (F) Colony-forming potential of healthy BM mononuclear cells after 24 hours pretreatment of the indicated compounds in cell culture. Each dot represents a technical replicate and number of colonies were normalized to control after culturing the cells for 2 weeks in semisolid medium. Bar heights indicate mean and error bars indicate range. HCA, Human Cell Atlas; KO, knockout; WT, wild-type.
High BCL-XL expression in erythroid and megakaryoblastic leukemia underlies sensitivity to BCL-XL inhibition. (A) Protein levels of BCL-2 family members of BCL-XL, BCL-2, and MCL-1 in 21 AML cell lines. FAB subtype, expression of BCL-2 family genes and erythroid lineage TFs in AML cell lines from the CCLE data set (gray color, data not available), drug sensitivity scores of BCL-2 family inhibitors, and TP53 mutations are shown below as heatmaps. (B) Sensitivity of parental (TP53 WT) and CRISPR-mediated TP53 knockout (TP53 KO) variants of MOLM13, MV411, and OCIAML2 cell lines to A-1331852 and venetoclax as drug sensitivity scores. Erythroid/megakaryocytic AML cell lines are shown as a comparison. P values were obtained using paired Welch t tests (KO vs WT) and Wilcoxon rank-sum tests (M6/M7 vs others). Bar heights indicate mean, error bars indicate standard deviation, and dots indicate individual cell lines. (C) Expression of BCL-2 family genes in AML FAB subtypes in the TCGA data set. In the box plot, the horizontal line indicates the median, boxes indicate the interquartile range, and whiskers extend from the hinge to the smallest/largest value, at most 1.5 interquartile range from the hinge. (D) BCL2L1 (BCL-XL) expression across hematological malignancies in the Hemap data set. P value for AML M6 samples compared with all other samples using Wilcoxon rank-sum test is shown. Box plot as in panel C. (E) UMAP plots of single-cell RNA-seq data of normal hematopoiesis from the HCA, with cell type annotations based on the reference-based method SingleR and BCL2L1, BCL2, and MCL1 expression levels as normalized and scaled log-transformed counts colored on the plots. (F) Colony-forming potential of healthy BM mononuclear cells after 24 hours pretreatment of the indicated compounds in cell culture. Each dot represents a technical replicate and number of colonies were normalized to control after culturing the cells for 2 weeks in semisolid medium. Bar heights indicate mean and error bars indicate range. HCA, Human Cell Atlas; KO, knockout; WT, wild-type.
The M6/M7 AML cell lines frequently harbored TP53 mutations (Figure 3A), consistent with patient data.5,6 Because TP53 loss has been linked to venetoclax resistance and compensatory BCL-XL upregulation,45 we tested whether TP53 loss drives sensitivity to BCL-XL inhibition. Erythroid/megakaryoblastic cell lines were more sensitive to BCL-XL inhibition even when compared only to TP53-mutated cell lines (supplemental Figure 3). Furthermore, CRISPR-mediated TP53 knockout in the TP53 wild-type cells MOLM13, MV411, and OCIAML2 reduced their sensitivity to venetoclax, whereas BCL-XL inhibitor sensitivity was not affected (Figure 3B). Differences between both BCL-XL inhibitors and venetoclax remained significant between the erythroid/megakaryoblastic cell lines and the TP53 knockout lines representing other AML types (Figure 3B). Thus, although venetoclax resistance appears to be driven jointly by erythroid/megakaryoblastic differentiation and by TP53 mutations, sensitivity to BCL-XL inhibition does not seem directly linked to TP53 status but more likely to erythroid/megakaryoblastic differentiation.
In patients with AML, BCL2L1 was overexpressed in erythroid (FAB M6) and megakaryocytic (FAB M7) AML in the TCGA cohort (Figure 3C). In contrast, BCL2 was more prominently expressed in less differentiated (FAB M0-M1) AML subtypes and acute promyelocytic leukemia (FAB M3), and MCL1 in monocytic AML (FAB M4-M5), as reported previously.19,46 To compare the expression of BCL2L1 in erythroid/megakaryoblastic leukemias relative to other hematological cancers, we used a resource of transcriptomic data sets aggregated across hematological malignancies.27BCL2L1 was strikingly overexpressed in the M6 AML FAB subtype compared with other cancer types, whereas M7 samples did not show elevated BCL2L1 expression in this data set (Figure 3D; supplemental Figure 4A; supplemental Table 4). In contrast, BCL2 and MCL1 were not overexpressed in erythroid or megakaryoblastic leukemias, whereas BCL2 was highly expressed in chronic lymphocytic leukemia (supplemental Figure 4B-C), consistent with the strong BCL-2 dependency and venetoclax sensitivity of this leukemia type.47
Reflecting the expression pattern in malignant samples, scRNA-seq data from the Human Cell Atlas48 showed that in normal hematopoiesis, cells of the erythroid/megakaryocytic lineages highly express BCL2L1, whereas BCL2 expression is more pronounced in hematopoietic progenitors and the lymphoid lineage and MCL1 in the monocytic lineage (Figure 3E). Consistent with the expression patterns, BCL-XL inhibitor treatment of healthy BM mononuclear cells reduced colony formation of the erythroid progenitors (burst-forming unit BFU-E and colony-forming unit [CFU]-E) but did not substantially affect the common myeloid progenitors (CFU-GEMM) or the granulocyte-macrophage progenitors (CFU-GM) (Figure 3F; supplemental Figure 5). The effects of A-1331852 on normal erythropoietic precursors at a concentration highly effective against leukemic cells were similar or less pronounced than those of navitoclax. Taken together, these data show that BCL2L1, which encodes BCL-XL, is highly expressed in acute erythroid/megakaryoblastic leukemias and their normal counterparts, providing a basis for the observed sensitivity to BCL-XL inhibition.
BCL-XL inhibition is effective ex vivo against AML patient cells with erythroid or megakaryocytic differentiation
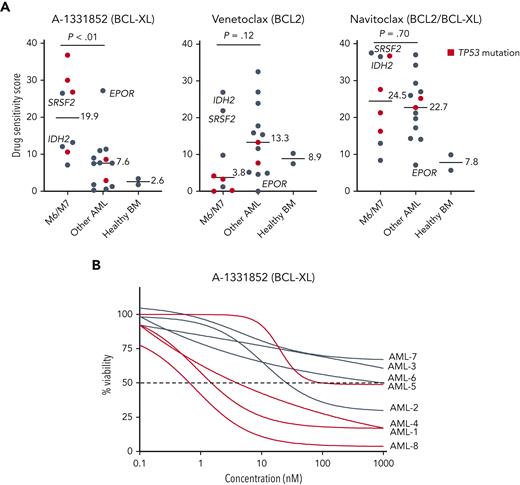
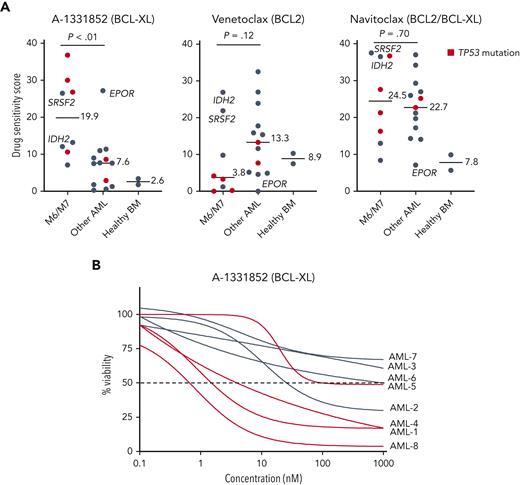
To evaluate whether BCL-XL–selective inhibition would be effective against primary AML cells with erythroid or megakaryocytic differentiation, we tested the focused set of BCL-2 family inhibitors in BM samples of 21 patients with AML, including 5 with erythroid and 3 with megakaryocytic differentiation (clinical characteristics in supplemental Table 1), and 2 healthy donors. The samples with erythroid/megakaryocytic differentiation showed pronounced sensitivity to A-1331852 (P < .01) and reduced sensitivity to venetoclax (P = .12) except patients with mutant IDH2 or SRSF2 reported to be dependent on BCL-218,49 (Figure 4A-B; supplemental Figure 6A-B). Importantly, 4 of these patients received treatment with venetoclax and hypomethylating agent but were refractory (supplemental Methods). Notably, TP53-mutated erythroid/megakaryoblastic AML samples were particularly resistant to BCL-2 inhibition but sensitive to BCL-XL inhibition. Intriguingly, a FAB M1 sample expressing high levels of erythroid lineage-specific TFs and harboring an EPOR frameshift mutation leading to the elimination of negative regulatory domains (supplemental Figure 6C) was also highly sensitive to BCL-XL inhibition. Similar EPOR truncating mutations are recurrent driver mutations in erythroleukemia,5 Ph-like ALL,50 and erythrocytosis.51 Although A-1331852 was the most selectively effective against AML with erythroid or megakaryocytic differentiation, these samples also showed sensitivity to the BCL-2/BCL-XL inhibitor navitoclax (Figure 4A).
Samples from patients with AML with erythroid or megakaryocytic differentiation are highly sensitive to BCL-XL inhibition ex vivo. (A) Ex vivo DSS of A-1331852, venetoclax, and navitoclax in samples from patients with AML (n = 21) and healthy BM samples (n = 2). AML cases with TP53 mutation are colored red. P values were calculated using a Wilcoxon rank-sum test. (B) Dose-response curves of samples with erythroid/megakaryoblastic features treated ex vivo with A-1331852. DSS, drug sensitivity score.
Samples from patients with AML with erythroid or megakaryocytic differentiation are highly sensitive to BCL-XL inhibition ex vivo. (A) Ex vivo DSS of A-1331852, venetoclax, and navitoclax in samples from patients with AML (n = 21) and healthy BM samples (n = 2). AML cases with TP53 mutation are colored red. P values were calculated using a Wilcoxon rank-sum test. (B) Dose-response curves of samples with erythroid/megakaryoblastic features treated ex vivo with A-1331852. DSS, drug sensitivity score.
Integrated single-cell transcriptomics and phenotype-based ex vivo drug profiling demonstrate blast specificity of BCL-XL inhibition
Drug sensitivity and gene expression profiling of patient samples using bulk methods are unable to distinguish whether the BCL-XL inhibitor sensitivity or BCL2L1 expression primarily reflect blasts or more terminally differentiated cells. To better understand the drug sensitivity and gene expression profiles of the blasts, we performed integrated scRNA-seq and ex vivo phenotype-based drug sensitivity profiling of 1 erythroid and 1 megakaryocytic AML.
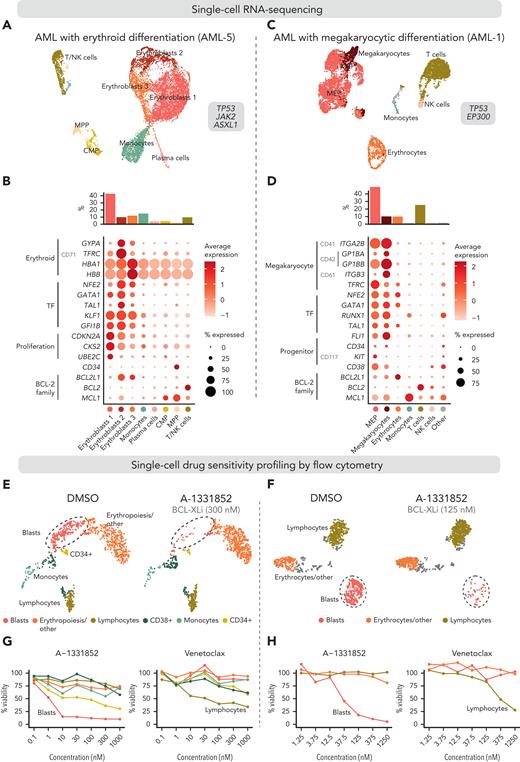
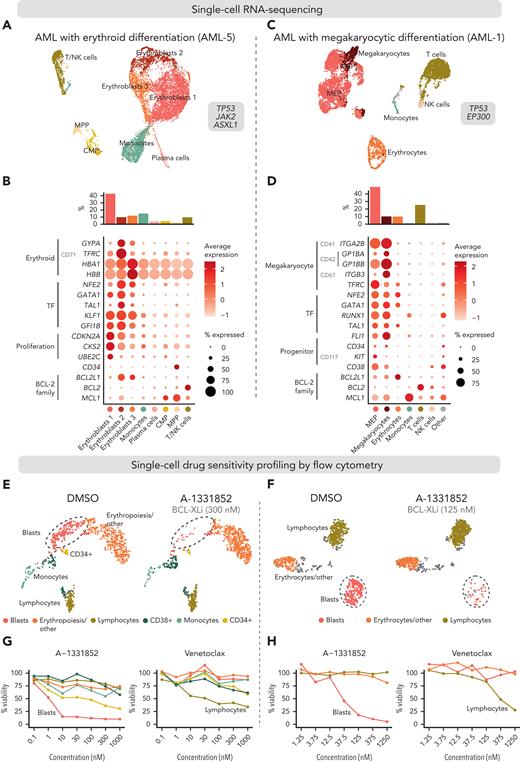
We first performed scRNA-seq on BM mononuclear cells of a patient with essential thrombocythemia transformed to erythroid AML (Figure 5A). Out of 8834 cells, we identified 3 clusters representing the malignant erythroid cells at differing phenotypic stages based on expression of erythroid markers (GYPA, TFRC, HBA1, and HBB) and TFs (NFE2, GATA1, TAL1, KLF1, and GFI1B) and detection of clonal copy-number alterations (Figure 5B; supplemental Figures 7 and 8; supplemental Table 5). Most of the malignant erythroid cells highly expressed BCL2L1, lymphocytes expressed BCL2, and normal common myeloid progenitors (CMPs) and multipotent progenitors (MPPs) expressed MCL1.
Integrated single-cell transcriptomics and phenotype-based ex vivo drug profiling in AML with megakaryocytic differentiation. (A) Uniform Manifold Approximation and Projection (UMAP) plot of scRNA-seq data of AML with erythroid differentiation (patient AML-5). Cells are colored based on clusters, which are named with the help of the reference-based cell type classification method SingleR. (B) Dot plot of expression of selected erythroid differentiation markers, TFs regulating erythroid differentiation, proliferation and progenitor markers, and BCL-2 family genes in the indicated cell types in the scRNA-seq data of AML with erythroid differentiation (AML-5). CD marker names are shown in gray. Dot size indicates the percentage of cells of a cell type expressing the given gene, and average expression is shown as normalized and scaled log-transformed counts. Bar plot above shows the percentage of each cell type out of all cells. (C) UMAP plot of scRNA-seq data of AML with megakaryocytic differentiation (patient AML-1). Cell types identified using the reference-based method SingleR are colored as indicated in panel D. Cell types comprising less than 1% of total cells are labeled as “Other.” (D) Dot plot of expression of selected megakaryocyte differentiation markers, TFs regulating megakaryocytic differentiation, progenitor markers, and BCL-2 family genes in the indicated cell types in the scRNA-seq data of AML with megakaryocytic differentiation (AML-1) as in panel B. (E) UMAP plots of cells analyzed using flow cytometry-based drug profiling in the patient with AML with erythroid differentiation (AML-5). Cells from control (DMSO) and BCL-XL inhibitor-treated (A-1331852, 300 nM) conditions are shown, with 1000 cells sampled from each condition. (F) UMAP plots of cells analyzed using flow cytometry-based drug profiling in the patient with AML with megakaryocytic differentiation (AML-1). Cells from control (DMSO) and BCL-XL inhibitor-treated (A-1331852, 125 nM) conditions are shown, with 1000 cells sampled from each condition. (G) Viabilities (percentage of viable cells compared with DMSO control) of the clusters representing different cell types in the patients with AML with erythroid differentiation (AML-5) after treatment with indicated concentrations of A-1331852 and venetoclax were analyzed using flow cytometry-based drug profiling. Clusters are colored as in panel E. (H) Viabilities (percentage of viable cells compared with DMSO control) of the clusters representing different cell types in the patient with AML with megakaryocytic differentiation (AML-1) after treatment with indicated concentrations of A-1331852 and venetoclax analyzed using flow cytometry-based drug profiling. Clusters are colored as in panel F. DMSO, dimethyl sulfoxide.
Integrated single-cell transcriptomics and phenotype-based ex vivo drug profiling in AML with megakaryocytic differentiation. (A) Uniform Manifold Approximation and Projection (UMAP) plot of scRNA-seq data of AML with erythroid differentiation (patient AML-5). Cells are colored based on clusters, which are named with the help of the reference-based cell type classification method SingleR. (B) Dot plot of expression of selected erythroid differentiation markers, TFs regulating erythroid differentiation, proliferation and progenitor markers, and BCL-2 family genes in the indicated cell types in the scRNA-seq data of AML with erythroid differentiation (AML-5). CD marker names are shown in gray. Dot size indicates the percentage of cells of a cell type expressing the given gene, and average expression is shown as normalized and scaled log-transformed counts. Bar plot above shows the percentage of each cell type out of all cells. (C) UMAP plot of scRNA-seq data of AML with megakaryocytic differentiation (patient AML-1). Cell types identified using the reference-based method SingleR are colored as indicated in panel D. Cell types comprising less than 1% of total cells are labeled as “Other.” (D) Dot plot of expression of selected megakaryocyte differentiation markers, TFs regulating megakaryocytic differentiation, progenitor markers, and BCL-2 family genes in the indicated cell types in the scRNA-seq data of AML with megakaryocytic differentiation (AML-1) as in panel B. (E) UMAP plots of cells analyzed using flow cytometry-based drug profiling in the patient with AML with erythroid differentiation (AML-5). Cells from control (DMSO) and BCL-XL inhibitor-treated (A-1331852, 300 nM) conditions are shown, with 1000 cells sampled from each condition. (F) UMAP plots of cells analyzed using flow cytometry-based drug profiling in the patient with AML with megakaryocytic differentiation (AML-1). Cells from control (DMSO) and BCL-XL inhibitor-treated (A-1331852, 125 nM) conditions are shown, with 1000 cells sampled from each condition. (G) Viabilities (percentage of viable cells compared with DMSO control) of the clusters representing different cell types in the patients with AML with erythroid differentiation (AML-5) after treatment with indicated concentrations of A-1331852 and venetoclax were analyzed using flow cytometry-based drug profiling. Clusters are colored as in panel E. (H) Viabilities (percentage of viable cells compared with DMSO control) of the clusters representing different cell types in the patient with AML with megakaryocytic differentiation (AML-1) after treatment with indicated concentrations of A-1331852 and venetoclax analyzed using flow cytometry-based drug profiling. Clusters are colored as in panel F. DMSO, dimethyl sulfoxide.
We then performed scRNA-seq on peripheral blood mononuclear cells from a patient with MDS progressed to megakaryocytic AML, refractory to induction chemotherapy and venetoclax combined with azacitidine. Of 6709 cells, 49.2% were classified as MEPs or megakaryocytes by the reference-based method SingleR (Figure 5C-D; supplemental Figure 9). Supporting megakaryocytic differentiation, the MEP-like blasts expressed megakaryocyte markers (CD41, CD42, CD61, and TFRC) and megakaryocytic lineage TFs (NFE2, GATA1, RUNX1, TAL1, and FLI1) (Figure 5D). The MEP, megakaryocyte, and erythrocyte populations primarily expressed BCL2L1, whereas BCL2 was expressed by lymphocytes and MCL1 by monocytes, as expected (Figure 5D).
For the phenotype-based drug sensitivity profiling, the mononuclear cells were cultured in the presence of BCL-2 family inhibitors for 3 days and analyzed using a 9-color flow cytometry readout. Unsupervised clustering of the pooled drug-treated and control cells identified clusters representing the blasts based on clinically reported immunophenotypes and similarity to populations identified in scRNA-seq (Figure 5E-F). These included the cells from patients with erythroid AML expressing CD117 and the cells from patients with megakaryocytic AML expressing the progenitor markers CD34, CD117, and CD38 (supplemental Figure 10). Other major clusters represented lymphocytes, monocytes, and erythrocytes or small debris based on CD45 expression, reflecting the cell populations identified using scRNA-seq. In both patients, the blasts were highly sensitive to A-1331852 and showed substantial sensitivity to navitoclax (Figure 5G-H; supplemental Figure 10). In contrast, the blasts were insensitive to venetoclax, in line with the venetoclax resistance observed clinically with the patient with megakaryocytic AML (Figure 5G-H). Of note, lymphocytes were sensitive to venetoclax and navitoclax, reflecting the high BCL2 expression observed in scRNA-seq (Figure 5G-H). These findings confirm the BCL-XL dependency and venetoclax resistance of the blasts with erythroid/megakaryocytic differentiation suggested by the bulk drug sensitivity profiling.
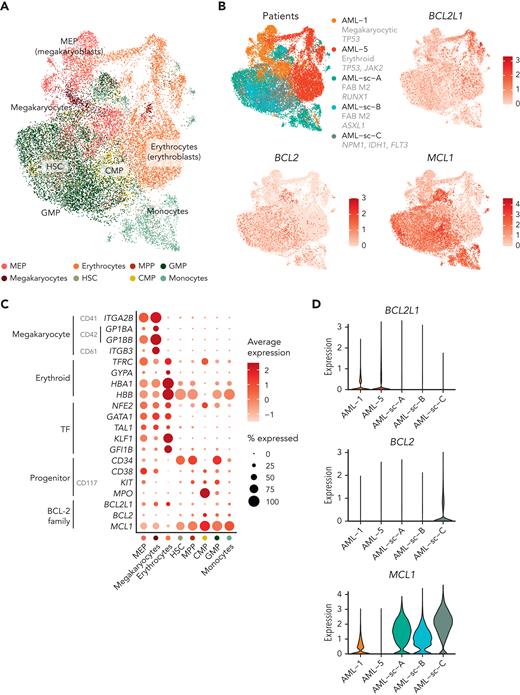
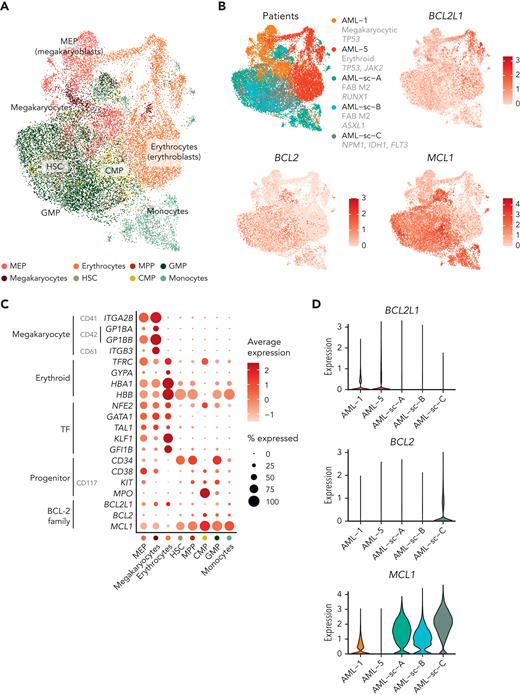
Finally, we sought to compare the expression of BCL-2 family genes specifically in blasts between different types of AML. Using scRNA-seq data, we integrated the blasts from the patients with AML with erythroid/megakaryocytic differentiation with the blasts and monocytes from 3 patients with AML whose disease did not show erythroid or megakaryocytic differentiation52 (Figure 6A). The blasts with erythroid/megakaryocytic differentiation clustered separately from other blasts and expressed higher levels of BCL2L1 compared with the other samples, whereas expression of BCL2 or MCL1 was low (Figure 6B-D). The GMP-like and CMP-like blasts highly expressed MCL1, and the CMP-like blasts showed substantial BCL2 expression (Figure 6B-D). The selective expression of BCL2L1 in blasts with erythroid/megakaryocytic differentiation observed at the single-cell level therefore provides a basis for the observed ex vivo drug responses.
BCL-2 family gene expression in blasts across AML types at single-cell resolution. (A) UMAP plot of scRNA-seq data of blasts from AML with megakaryoblastic differentiation (AML-1), AML with erythroid differentiation (AML-5), and 3 AMLs representing other subtypes. Cell types identified using the reference-based method SingleR are colored. (B) UMAP plots as in panel A with patients and expression of BCL2L1, BCL2, and MCL1 colored as normalized and scaled log-transformed counts. (C) Dot plot of RNA expression of selected megakaryocyte and erythroid markers, TFs regulating erythroid/megakaryocytic differentiation, progenitor markers, and BCL-2 family genes in the indicated cell types based on reference-based method SingleR annotations. (D) Violin plot demonstrating BCL-2 family gene expression of the blasts in different patients.
BCL-2 family gene expression in blasts across AML types at single-cell resolution. (A) UMAP plot of scRNA-seq data of blasts from AML with megakaryoblastic differentiation (AML-1), AML with erythroid differentiation (AML-5), and 3 AMLs representing other subtypes. Cell types identified using the reference-based method SingleR are colored. (B) UMAP plots as in panel A with patients and expression of BCL2L1, BCL2, and MCL1 colored as normalized and scaled log-transformed counts. (C) Dot plot of RNA expression of selected megakaryocyte and erythroid markers, TFs regulating erythroid/megakaryocytic differentiation, progenitor markers, and BCL-2 family genes in the indicated cell types based on reference-based method SingleR annotations. (D) Violin plot demonstrating BCL-2 family gene expression of the blasts in different patients.
Exploring the translational potential of BCL-XL inhibition in murine and in vitro long-term combination treatment models
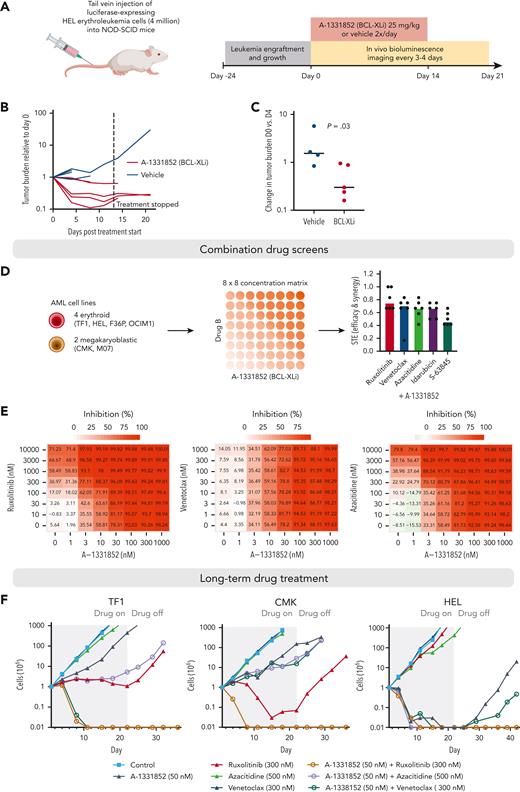
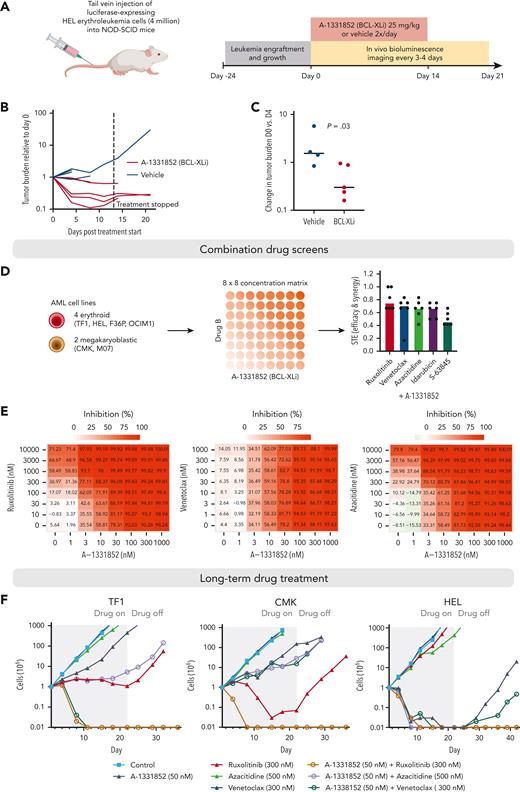
To explore how the BCL-XL dependency of erythroid/megakaryocytic AML could be best exploited therapeutically, we tested BCL-XL inhibition in a mouse xenograft model. We transplanted 4 million luciferase-expressing HEL erythroleukemia cells intravenously into nonobese diabetic/severe combined immunodeficiency mice. After establishment of systemic disease at 24 days, we initiated treatment with the BCL-XL inhibitor A-1331852 twice a day, orally (Figure 7A). A-1331852 effectively reduced tumor burden as measured by bioluminescence imaging (Figure 7B-C). However, in some animals, the tumor cells persisted through treatment and continued to grow after drug withdrawal at 2 weeks (Figure 7B; supplemental Figure 11).
Efficacy of BCL-XL inhibition in a xenograft mouse model and in long-term combination treatments. (A) Schematic of the mouse xenograft experiment performed using HEL erythroleukemia cells. (B) Line graph showing tumor burden based on bioluminescence imaging for each mouse relative to start of treatment (day 0). Dashed line indicates stopping of the drug treatment. (C) Comparison of changes in tumor burden between BCL-XL inhibitor and vehicle treatment on day 4 of treatment relative to the start of treatment (day 0) based on bioluminescence imaging. P value was obtained using one-sided Wilcoxon rank-sum test. (D) Schematic of the drug combination screens and bar plot showing the synergy and efficacy score values of the combinations indicating combined efficacy and synergy in all cell lines ranked from highest to lowest on average. (E) Heatmaps of drug sensitivity in HEL erythroleukemia cells with the combinations of A-1331852 with ruxolitinib, venetoclax, and azacitidine across the tested concentration matrices. Percent inhibition values are indicated in the heatmaps. (F) Long-term drug treatment assays using TF1 (erythroid AML), CMK (megakaryocytic AML), and HEL-Luc (erythroid AML, used in mouse studies) cells. Gray-row shaded areas indicate duration of drug treatment.
Efficacy of BCL-XL inhibition in a xenograft mouse model and in long-term combination treatments. (A) Schematic of the mouse xenograft experiment performed using HEL erythroleukemia cells. (B) Line graph showing tumor burden based on bioluminescence imaging for each mouse relative to start of treatment (day 0). Dashed line indicates stopping of the drug treatment. (C) Comparison of changes in tumor burden between BCL-XL inhibitor and vehicle treatment on day 4 of treatment relative to the start of treatment (day 0) based on bioluminescence imaging. P value was obtained using one-sided Wilcoxon rank-sum test. (D) Schematic of the drug combination screens and bar plot showing the synergy and efficacy score values of the combinations indicating combined efficacy and synergy in all cell lines ranked from highest to lowest on average. (E) Heatmaps of drug sensitivity in HEL erythroleukemia cells with the combinations of A-1331852 with ruxolitinib, venetoclax, and azacitidine across the tested concentration matrices. Percent inhibition values are indicated in the heatmaps. (F) Long-term drug treatment assays using TF1 (erythroid AML), CMK (megakaryocytic AML), and HEL-Luc (erythroid AML, used in mouse studies) cells. Gray-row shaded areas indicate duration of drug treatment.
To find treatment regimens enabling long-term disease control, we explored potential combination treatments by testing 5 other compounds with the BCL-XL inhibitor A-1331852 in 8 × 8 concentration matrices (Figure 7D). We selected as combination candidate drugs used clinically in AML treatment (venetoclax, azacitidine, and idarubicin), drugs that showed high efficacy in erythroid/megakaryocytic AML in our screens (the JAK inhibitor ruxolitinib), and drugs targeting other members of the BCL-2 family (the MCL-1 inhibitor S-63845). Combining BCL-XL inhibition with ruxolitinib, venetoclax, or azacitidine showed potent efficacy and synergy across the studied 4 erythroid and 2 megakaryoblastic AML cell lines in the 3-day assay (Figure 7D-E; supplemental Figure 12; supplemental Table 6).
To test the potential of these combinations in achieving long-term disease control, we performed drug treatment assays, spanning over a month, in 2 erythroid (TF1, HEL) and a megakaryoblastic AML cell line (CMK) (Figure 7F). The combinations of A-1331852 with azacitidine or venetoclax achieved complete elimination of leukemia cells in individual cell lines (HEL), but not in all. Strikingly, the combination of BCL-XL and JAK inhibition resulted in the complete elimination of the tumor cells in all cell lines and a lack of outgrowth of the cells even after drug withdrawal.
Discussion
Here, we demonstrate that erythroid and megakaryoblastic AML cell lines and primary samples are highly dependent on the antiapoptotic protein BCL-XL but not on BCL-2 or MCL-1. Targeting BCL-XL in AML with erythroid or megakaryocytic differentiation represents a strategy exploiting the specific vulnerabilities of these lineages. In the healthy BM, BCL-XL is essential for effective erythropoiesis, particularly at the terminal stages of erythroblast differentiation,20,21 and for preventing apoptosis by restraining the proapoptotic proteins, BAX and BAK.53 BCL-XL expression is strongly increased during erythroid differentiation, and a lack of BCL-2 is characteristic of erythroblasts.20 BCL-XL also maintains platelet survival54 and contributes to the function and survival of megakaryocytic progenitors.55 Conditional BCL-XL knockout in hematopoietic progenitors in mice leads to severe anemia and thrombocytopenia.56 The essential role of BCL-XL in normal erythropoiesis and megakaryopoiesis provides a rationale for the observed BCL-2 family dependencies of their leukemic counterparts.
In contrast to differentiating erythroid cells and reticulocytes, BCL-XL is not essential for normal early-stage mouse erythroblasts.21,57 In our AEL and AMKL index cases, scRNA-seq demonstrated elevated BCL2L1 in major blast populations (MEPs and erythroblasts), accompanied by a lack of BCL2 expression, sensitivity to BCL-XL inhibition, and venetoclax resistance compared with other AML subtypes. Whether heterogeneity in the differentiation stage of the blasts in erythroid/megakaryoblastic leukemia or the myeloblastic compartment present commonly in erythroleukemia affects the BCL-XL dependence warrants further investigation.
Dependence on BCL-XL has been previously suggested as a mechanism driving venetoclax resistance in AML.58-60 Our findings suggest that erythroid/megakaryocytic differentiation may, in some cases, explain the dependence on BCL-XL as opposed to BCL-2. In our cohort, 6 out of 8 primary erythroid/megakaryoblastic leukemia samples were resistant to venetoclax ex vivo. The 2 venetoclax-sensitive patients harbored IDH2 and SRSF2 mutations, known markers for good venetoclax responses.18,49 In contrast, all 4 TP53-mutated patients were resistant to venetoclax and sensitive to BCL-XL inhibition. Importantly, 3 of these patients were treated with venetoclax plus hypomethylating agent with no clinical responses observed. TP53 loss/mutation has been linked to decreased BCL-2 expression,61-63 venetoclax resistance in AML,64,65 and potentially increased BCL-XL dependency.45 In our experiments, TP53 knockout significantly reduced sensitivity to venetoclax but did not induce BCL-XL sensitivity. Mutant TP53 thus appears to mediate resistance to BCL-2 but not to BCL-XL inhibition. Definitive understanding of whether erythroid/megakaryocytic differentiation confers venetoclax resistance in the clinical setting and how mutation profiles influence responses will require larger clinical cohorts of these rare AML subtypes.
BCL-XL inhibition may result in adverse effects such as thrombocytopenia, as observed in navitoclax-treated patients.66 Consistently, A-1331852 results in a reduction of circulating platelets similar to navitoclax in rats.35 However, this may not preclude the use of BCL-XL inhibitors in the setting of acute leukemia, where such adverse effects are often accepted in standard chemotherapy regimens. Supporting the feasibility of BCL-XL inhibition in patients, a recent trial found navitoclax in combination with ruxolitinib tolerable in patients with myelofibrosis, although thrombocytopenia was reported as the most common adverse effect.67 In AML, BCL-XL inhibition could potentially be used as a bridge therapy to allotransplantation, making it possible to administer platelet transfusions for the limited treatment period with a BCL-XL inhibitor. Other strategies to circumvent the adverse effects on normal thrombopoiesis could include a platelet-sparing BCL-XL agent such as a proteolysis-targeting chimera.68 Although BCL-XL inhibition and navitoclax reduced the colony formation of normal erythroid progenitors in our colony-forming assay, severe anemia has not been reported as common in patients treated with navitoclax.69
The combination of BCL-XL and JAK inhibition showed synergy and produced durable responses in vitro. Erythropoietin and thrombopoietin promote erythropoiesis70 and thrombopoiesis,71 respectively, by activating JAK-STAT signaling, which can drive BCL-XL expression.72-75 Indicating the importance of the JAK-STAT pathway also in malignancies arising from these lineages, JAK2/3 is commonly mutated in AMKL,7 and EPOR/JAK2 amplifications are frequent in AEL.5 Combined BCL-XL/JAK inhibition may therefore effectively exploit the characteristic dependencies of malignant erythroid/megakaryocytic cells. BCL-XL dependency of individual AML cell lines has been previously attributed to the JAK2 V617F mutation.35,76 In line with a previous report,77 our data suggest erythroid/megakaryocytic differentiation as a driver of BCL-XL dependency more broadly. In some cases, genetic alteration of JAK-STAT signaling may act as one of the possible mechanisms, as suggested by the BCL-XL-dependent FAB M1 patient sample harboring an EPOR mutation in our cohort.
AML cells with monocytic differentiation have reduced sensitivity to BCL-2 inhibition ex vivo, which is associated with increased MCL1 and decreased BCL2 expression during normal monocytic differentiation.19,78 This observation was consistent with the clinical data demonstrating decreased venetoclax efficacy in patients with monocytic AML, but further clinical data is warranted to validate these findings.46 The observation of BCL-XL sensitivity in AML of erythroid or megakaryocytic lineage provides further evidence that, in addition to the mutation profile, the differentiation stage may influence sensitivity to BCL-2 family inhibitors in AML. As pathological erythropoiesis and megakaryopoiesis can occur not only in erythroid/megakaryoblastic AML but also in MDS and myeloproliferative neoplasms (MPN), the sensitivity to BCL-XL inhibition could potentially apply to these diseases. Supporting this hypothesis, MPNs such as polycythemia vera have been found to highly express BCL-XL.79 The sensitivity of MPNs to BCL-XL inhibition in combination with JAK inhibitors has been suggested previously in JAK2 mutation-driven malignancies76,80 and is currently investigated in myelofibrosis (#NCT03222609).67 In contrast, treatments based on the BCL-2 inhibitor venetoclax may not be effective in malignancies with erythroid or megakaryocytic differentiation because of their dependence on BCL-XL. Indeed, poor response rates were reported in AML evolved from MPN treated with venetoclax-containing regimens.81 In conclusion, given the poor prognosis associated with erythroid and megakaryoblastic leukemias and the limited targeted therapy options, we propose BCL-XL as a viable target for further exploration in the treatment of these leukemia subtypes.
Acknowledgments
The authors thank Maria Nurmi, Marja Peltola, and Laura Turunen of the FIMM High Throughput Biomedicine Unit for preparing the drug plates, Imre Västrik for providing an in-house data analysis platform, Mari Rissanen and Heidi Haikala for helping with the mouse studies, Sandra Gordon for providing help with patient samples, Mikko Myllymäki for clinical insights, and Anna Näätänen and Jenni Lahtela of the FIMM Single-Cell Analytics unit supported by HiLIFE and Biocenter Finland for scRNA-seq sample processing. Animal studies were carried out with the support of the Helsinki Institute of Life Science (HiLIFE) Laboratory Animal Centre Core Facility, University of Helsinki, Helsinki, Finland. Animal imaging was performed at the Biomedicum Intravital Imaging Unit (BIU-IVI) of the University of Helsinki, supported by HiLIFE and Biocenter Finland. The authors also thank Alun Parsons, Natalia Mokrzecka, and Minna Suvela for their help in laboratory experiments.
This study was supported by the Cancer Foundation Finland, the Helsinki Institute of Life Science (HiLIFE) Fellow grants, the Academy of Finland (grant 1320185), the Sigrid Jusélius Foundation, the Finnish Cancer Institute, the Finnish Medical Foundation, University of Helsinki, and the Finnish special governmental subsidy for health sciences, research, and training. The FIMM High Throughput Biomedicine Unit is financially supported by the University of Helsinki (HiLIFE) and Biocenter Finland. O.D. was supported by the K. Albin Johansson Foundation, the Emil Aaltonen Foundation, and the Juhani Aho foundation.
Authorship
Contribution: H.K. and O.D. conceived and designed the study and wrote the manuscript; M.V.-K., O.D., and H.K. performed in vivo experiments; H.K., A.-M.L., I.V., P.N., J.K., J.B., and C.M. performed experiments; O.D. analyzed drug screening, genetic perturbation, and gene expression data; J.H., O.D., and P.P. analyzed scRNA-seq data; T.R. and H.K. performed the flow cytometry drug screening experiments; S.A. analyzed the colony-forming assay results; H.K., A.-M.L., I.V., J.S., J.M., Q.Z., C.M., J.K., and S.A. performed drug screening of the primary patient samples; S.E. analyzed the whole exome sequencing data of patient samples; M. Keränen, U.W.-K., K.T.-M., M. Konopleva, K.W., M. Kontro, and K.P. provided the patient material and clinical insights; M.H., K.W., M. Kontro, C.A.H., and S.M. edited the manuscript and supervised the work; and all authors contributed to the writing and approved the final manuscript.
Conflict-of-interest disclosure: H.K. reports research funding from AbbVie and personal fees from Faron outside the submitted work. U.W.-K. has received honoraria from Sanofi, Novartis, and Pfizer (not related to this study) and is a member of the advisory boards of Gilead, Pfizer, and Jazz Pharmaceuticals. C.A.H. has received research funding from Celgene, Kronos Bio, Novartis, Oncopeptides, Orion, and IMI2 projects HARMONY and HARMONY PLUS unrelated to this work. S.M. has received research funding and honoraria from BMS, Novartis, and Pfizer (not related to this study). The remaining authors declare no competing financial interests.
Correspondence: Satu Mustjoki, Hematology Research Unit Helsinki, University of Helsinki and Helsinki University Hospital Comprehensive Cancer Center, POB 700, 00290 Helsinki, Finland; e-mail: satu.mustjoki@helsinki.fi; Olli Dufva, Hematology Research Unit Helsinki, University of Helsinki and Helsinki University Hospital Comprehensive Cancer Center, 00290 Helsinki, Finland; e-mail: olli.dufva@helsinki.fi; and Heikki Kuusanmäki, Institute for Molecular Medicine Finland, University of Helsinki, 00290 Helsinki, Finland, and Biotech Research and Innovation Centre, University of Copenhagen, 2200 Copenhagen N, Denmark; e-mail: heikki.kuusanmaki@helsinki.fi.
References
Author notes
∗H.K. and O.D. are joint first authors.
†C.A.H. and S.M. are joint last authors.
The raw scRNA-seq data are deposited to EGA (EGAS00001006819). The processed scRNA-seq data are available at Synapse (https://doi.org/10.7303/syn24200411, https://www.synapse.org/bclxl_aml).
Drug sensitivity and other processed data used in the study are available at Synapse (https://doi.org/10.7303/syn24200411, https://www.synapse.org/bclxl_aml). The source code for bioinformatic analyses is available at GitHub (https://github.com/odufva/bclxl-aml).
The online version of this article contains a data supplement.
There is a Blood Commentary on this article in this issue.
The publication costs of this article were defrayed in part by page charge payment. Therefore, and solely to indicate this fact, this article is hereby marked “advertisement” in accordance with 18 USC section 1734.

