

Key Points
TP53 mutation and CN status are heterogeneous and vary across AML categories in untreated and refractory patients.
p53 protein expression is a sensitive and specific global readout tool for TP53 mutations and CN alterations across AML categories.

Abstract
Mutant TP53 is an adverse risk factor in acute myeloid leukemia (AML), but large-scale integrated genomic-proteomic analyses of TP53 alterations in patients with AML remain limited. We analyzed TP53 mutational status, copy number (CN), and protein expression data in AML (N = 528) and provide a compilation of mutation sites and types across disease subgroups among treated and untreated patients. Our analysis shows differential hotspots in subsets of AML and uncovers novel pathogenic variants involving TP53 splice sites. In addition, we identified TP53 CN loss in 70.2% of TP53-mutated AML cases, which have more deleterious TP53 mutations, as well as copy neutral loss of heterozygosity in 5/32 (15.6%) AML patients who had intact TP53 CN. Importantly, we demonstrate that mutant p53 protein expression patterns by immunohistochemistry evaluated using digital image-assisted analysis provide a robust readout that integrates TP53 mutation and allelic states in patients with AML. Expression of p53 by immunohistochemistry informed mutation status irrespective of TP53 CN status. Genomic analysis of comutations in TP53-mutant AML shows a muted landscape encompassing primarily mutations in genes involved in epigenetic regulation (DNMT3A and TET2), RAS/MAPK signaling (NF1, KRAS/NRAS, PTPN11), and RNA splicing (SRSF2). In summary, our data provide a rationale to refine risk stratification of patients with AML on the basis of integrated molecular and protein-level TP53 analyses.
Introduction
The biology and clinical behavior of acute myeloid leukemia (AML) are highly heterogeneous. The European LeukemiaNet1 and National Comprehensive Cancer Center Network2 list AML with mutated TP53 as an adverse-risk category.3-5 Recent data indicate that the impact of monoallelic TP53 mutations on treatment response and disease outcome can vary and may overlap with those of wild-type TP53 among patients with myelodysplastic syndrome (MDS).6 Although it remains unknown if this applies to AML, anecdotal evidence points to some subsets of patients with AML with TP53 mutation having nonadverse risk features.7 Accordingly, we hypothesized that the mere presence of a TP53 mutation in AML might not be predictive of adverse impact in the context of personalized cancer treatment. In recent years, TP53 status has emerged as an important determinant of therapy selection.8-11
Alterations involving the TP53 locus are complex and fall into 2 main categories: (1) TP53 gene deletion; and (2) TP53 mutations that compromise p53 function.12 Evolution has provided protective redundancy allowing cells to withstand the loss of a single TP53 gene locus without measurable immediate implications.13 However, ∼60% of cancers that have TP53 missense mutations harbor concomitant deletion of the other allele, loss of heterozygosity (LOH), likely through selective advantage mechanisms.14TP53 mutations entail additional layers of functional complexity; namely, pathogenic implications are further dependent on the site of TP53 missense mutation and the coexistence of other TP53 mutations. Most cancer-associated TP53 mutations, including those in AML, are missense mutations that involve the DNA-binding domain (DBD).15 Mutant premature termination codons and frameshift mutations result in strong disruption of p53 function, whereas the impact of mutations resulting in a single amino-acid substitution or deletion is dependent on their position within the DBD.16 Although the dominant negative effect of TP53 hotspot mutations has been described recently,17 less is known in AML about the functional and prognostic implications of TP53 mutations affecting other p53 domains or splicing sites. Together, these factors are postulated to play a role in determining the trajectory of a TP53-mutant AML clone, along with its clinical impact.
Accumulation of mutant p53 protein is a hallmark of cells harboring TP53 mutations and is influenced by factors including protein ubiquitination, phosphorylation, molecular chaperones, protein folding, etc.18 Few studies have evaluated the role of p53 immunohistochemistry in AML.19-21 Fernandez-Pol et al showed that detection of p53 accumulation by immunohistochemistry correlates independently with overall survival (OS) in patients with AML, with a hazard ratio (HR) for death that exceeded that of TP53 mutation or complex karyotype.21 However, p53 immunohistochemistry in that study was evaluated manually in a relatively small study group, and TP53 mutations were detected using Sanger sequencing. Cleven et al identified similar findings in therapy-related myeloid neoplasms, which included only a small group of patients with AML.20 Together, these studies suggest that the detection of p53 accumulation by immunohistochemistry in AML might add prognostic value independently as a readout tool for p53 aberrancy.
In this study, we evaluated the clinical impact and predictive value of TP53 mutation parameters and p53 protein stabilization levels in a large cohort of patients with AML.
Methods
Study group
We identified patients diagnosed with AML and treated at The University of Texas MD Anderson Cancer Center between November 2005 and August 2020. Patients fulfilled the diagnostic and typing criteria of AML as defined in the 2017 World Health Organization (WHO) classification. A total of 528 patients were included in this study selected based on a diagnosis of AML and availability of TP53 mutation status (supplemental Figure 1, available on the Blood Web site; see supplemental data for additional details). The retrospective group comprised 427 patients selected on the basis of mutant TP53. The prospective group consisted of 101 consecutive new patients with AML: 20 patients with TP53-mutant AML and 81 patients with wild-type TP53. The purpose of the prospective group was to serve as a validation set for analytic performance of p53 immunohistochemistry (supplemental Figure 1).
Patients were further grouped in accordance with the WHO classification as follows (WHO groups): AML with recurrent genetic abnormalities; AML with myelodysplasia-related changes (AML-MRC); therapy-related AML (t-AML); and AML not otherwise specified. In the AML-MRC group, 258/279 (92.5%) patients had myelodysplasia-related cytogenetics. Although not a specific category in the WHO classification, the study included a group of patients who developed AML postmyeloproliferative neoplasm (AMLpMPN).
Patients were labeled as “frontline” (FL) (n = 318) if they had presented without prior AML therapy; of these, 13 were evaluated but did not receive treatment at our institution. Of the FL patients treated at our institution, 221/305 (72.4%) were given low-dose/intensity (LD) therapy. Among patients receiving LD therapy, 131 (59.8%) patients received hypomethylating agent (HMA) or low-dose cytarabine (LDAC)-based combinations without venetoclax, and 90 (41.1%) patients received HMA and LDAC-based combinations with venetoclax (supplemental Table 1). Those who had received any prior AML therapy prior to presentation were designated as “salvage” patients (n = 114), and of these, 78 (68.4%) patients were given LD therapy. Patients who had received therapy for an antecedent hematologic malignancy (MDS/MPN) but not for AML were designated as treated-secondary FL (tsFL) (n = 60) as defined previously.22 Thirty-eight patients (7.2%) received allogeneic stem cell transplant (allo-SCT). Response criteria were based on European LeukemiaNet consensus guidelines.1 Patients who achieved complete response or incomplete hematologic recovery (CRi) were considered responders; all other patients were considered nonresponders.
This study was approved by the Institutional Review Board of The University of Texas MD Anderson Cancer Center and carried out in accordance with the Declaration of Helsinki.
Mutation analysis
See supplemental data for details.
Conventional karyotyping, FISH, and combined aCGH, and SNP analysis
See supplemental data for details. Copy number (CN) loss of a TP53 allele (TP53 CNloss) was determined by fluorescence in situ hybridization (FISH) and/or array comparative genomic hybridization (aCGH) in the majority (n = 312) of patients. Patients who had no TP53 CNloss and/or those who had normal diploid karyotype or a noncomplex karyotype lacking -17/17p- were designated as TP53 CNintact. Analysis for copy neutral loss of heterozygosity (cnLOH) at the TP53 locus was performed using aCGH + single nucleotide polymorphism (SNP) analysis in 32 TP53 CNintact cases.
Immunohistochemistry and digital image analysis
See supplemental data for details. We used the monoclonal anti‐p53 antibody clone DO‐7 (Dako, Carpinteria, CA), which recognizes an epitope (SDLWKL) between amino acids 20 to 25 of the human protein and detects both the wild‐type and the mutant forms.23 Stains were evaluated using digital image analysis on a clinical grade platform.
Statistical analysis
OS was calculated as the time from the date of AML diagnosis to the date of last follow‐up or death of any cause, whichever occurred first. Leukemia-free survival (LFS) was defined as the time from the date of response and the date of first evidence of disease recurrence or death, whichever occurred first; only patients who achieved complete response or CRi were considered for LFS calculations. Patients who received allo‐SCT were censored at the time of transplant. Confidence intervals (CIs) were set at 95% where applicable.
Results
Landscape of TP53 mutation types and VAF across AML subsets
The TP53-mutant AML group included 442 patients (422 in the retrospective group; 20 in the prospective group), 336 patients (76%) with 1 TP53 mutation and 106 patients (24%) with >1 TP53 mutations, harboring 560 TP53 mutations (supplemental Figure 2A). Missense mutations were most common (430; 76.8%) and involved the DBD predominantly (410/430; 95.3%; P < .001, χ2 test) in untreated and previously treated patients. Nonsense (45; 8%), frameshift (45, 8%), and deletion (11; 2%) mutations were less common and appeared to distribute randomly across all domains of the gene (Figure 1A-D). We also identified 29 (5.2%) splice site mutations distributed primarily around exons encoding the DBD domain (Figure 1E), 17 as a sole mutation, 10 coexisting with other mutation types, and 2 coexisting in a single patient. These splice site mutations were present primarily in AML-MRC and t-AML patients, all with complex karyotype, but independent of TP53 CN status (supplemental Figure 2C). Notably, these AML-MRC and t-AML groups harbor most TP53 mutations (supplemental Figure 2B), and comparing these 2 WHO groups in untreated patients (FL), hotspot missense mutations were similar while the truncating mutations differed; in the AML-MRC group, TP53 p.P153fs and in the t-AML group the TP53 p.R213* had higher relative frequencies, but the difference was not statistically significant (Figure 1B-C). Certain TP53 missense mutations (eg, TP53 p.R175H) were more prevalent among salvage patients in comparison with those in the FL group (Figure 1D). Of note, mutation types did not correlate with WHO subgroups, number of TP53 mutations, TP53 CN status, or cytogenetic category (supplemental Table 2).
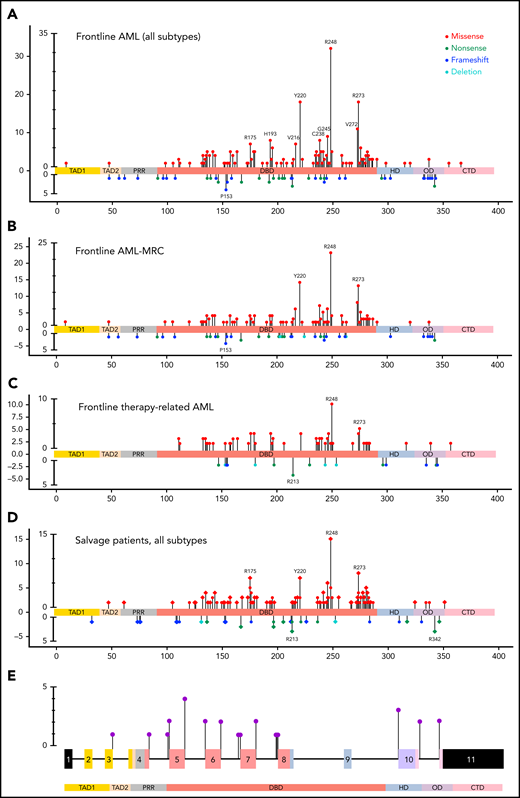
Lollipop plot illustrating TP53 mutational data in this study group. (A) FL AML (n = 354 patients). (B) FL AML-MRC (n = 196 patients). (C) FL t-AML (n = 80 patients). (D) Salvage and treated-secondary FL (n = 174 patients) (salvage depicted by square: treated-secondary FL depicted by circles). (E) Splice site mutations in all types of AML (n = 26 patients). Note: Circles are colored according to the corresponding mutation type. Missense (red circles) mutations are shown above the gene schematic diagram, and truncating mutations, including nonsense (green circles), frameshift (blue circles), and deletion (aqua circles), are shown below the diagram. Splice site mutations are depicted in purple circles. At a given locus, lollipop height is proportional to the number of times a mutation was observed in study subjects. The structural domains of the gene represented in the figure: TAD, transactivation domain (TAD1: residues 1 to 40, TAD2 41 to 60 residues); PRD, proline-rich domain (61 to 92 residues); DBD, DNA binding domain (94 to 292 residues); HD, hinge domain (293 to 325 residues); OD, oligomerization domain (326 to 353 residues); CTD, C-terminal domain (354 to 393 residues).37
Lollipop plot illustrating TP53 mutational data in this study group. (A) FL AML (n = 354 patients). (B) FL AML-MRC (n = 196 patients). (C) FL t-AML (n = 80 patients). (D) Salvage and treated-secondary FL (n = 174 patients) (salvage depicted by square: treated-secondary FL depicted by circles). (E) Splice site mutations in all types of AML (n = 26 patients). Note: Circles are colored according to the corresponding mutation type. Missense (red circles) mutations are shown above the gene schematic diagram, and truncating mutations, including nonsense (green circles), frameshift (blue circles), and deletion (aqua circles), are shown below the diagram. Splice site mutations are depicted in purple circles. At a given locus, lollipop height is proportional to the number of times a mutation was observed in study subjects. The structural domains of the gene represented in the figure: TAD, transactivation domain (TAD1: residues 1 to 40, TAD2 41 to 60 residues); PRD, proline-rich domain (61 to 92 residues); DBD, DNA binding domain (94 to 292 residues); HD, hinge domain (293 to 325 residues); OD, oligomerization domain (326 to 353 residues); CTD, C-terminal domain (354 to 393 residues).37
In combination, the TP53 variant allelic frequency (VAF) and bone marrow AML blast percentage reflect indirectly the disease burden harboring TP53 alteration(s) and, hypothetically, the extent of resultant p53 accumulation. Accordingly, we first sought to understand the correlation between these parameters. Notably, Spearman rank correlation analysis demonstrated a weak association between VAF and bone marrow blast percentage across the entire patient group (r = 0.17; P < .001), as well as within each of the AML-MRC and t-AML groups. These findings suggest that better tools are needed to understand the size of the TP53-mutant clone in bone marrow samples from patients with AML.
TP53 CN status correlates with TP53-mutant subsets
We identified the CN status at the TP53 locus on 312 patients with TP53 mutation. Interestingly, we noted that TP53 missense mutations in AML with CNloss are more deleterious in comparison with those with CNintact as estimated by the EAp53 score (78.7 vs 71.2; P = .001). We identified a correlation between TP53 CN status and WHO groups (P < .001), with 44/61 (72.1%) patients with t-AML and 168/217 (77.4%) patients with AML-MRC having CNloss. TP53 CNloss correlated with cytogenetic risk groups (P < .001) and was predictably significantly more common in AML with complex cytogenetics (210/260; 80.8% vs 9/52; 17.3%; P < .001). Of note, there was no significant difference between TP53 CNloss and CNintact cases in terms of protein domain involved by mutation (DBD vs other), mutation type (missense vs other), age (<60 vs ≥60 years), or secondary vs de novo AML. Among CNintact cases tested using aCGH+SNP, 5/32 (15.6%) patients had cnLOH; their characteristics are summarized in supplemental Table 3.
To analyze TP53 mutationand CN status, we divided cases in our study group henceforth on the basis of 1 vs >1 mutation and CNintact vs CNloss. Among 248 patients with 1 TP53 mutation, 186 (75%) patients had TP53 CNloss, whereas of 64 patients with >1 TP53 mutation, 33 (51.6%) patients had TP53 CNloss (P < .001) (Figure 2A). As anticipated, the TP53 VAF was significantly higher in cases with TP53 CNloss compared with CNintact (median VAF 50.8% vs 37.4%; P < .001), reflecting the impact of loss of the wild-type allele. Patients with 1 mutation and CNloss had the highest TP53 VAF. Among AML cases with 1 TP53 mutation and CNintact, single nonsense TP53 mutations had the highest median VAF, whereas single-splice site mutations had the highest median TP53 VAF among cases with CNloss (Figure 2B). Cases with TP53 cnLOH had a median VAF of 88.7% (range, 33.4% to 95.4%).
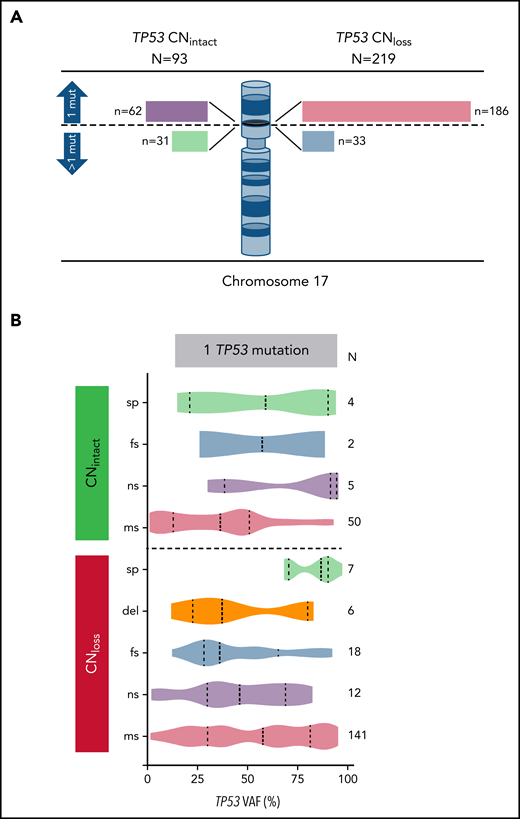
Correlation of TP53 CN status with TP53 mutation number, type, and VAF. (A) TP53 CN status among patients with AML with one or more TP53 mutations. Bar lengths drawn to scale. (B) TP53 mutation types and variant allelic frequencies within each of the TP53 CN groups. mut, mutation; sp, splice site; fs, frameshift; ns, nonsense; ms, missense.
Correlation of TP53 CN status with TP53 mutation number, type, and VAF. (A) TP53 CN status among patients with AML with one or more TP53 mutations. Bar lengths drawn to scale. (B) TP53 mutation types and variant allelic frequencies within each of the TP53 CN groups. mut, mutation; sp, splice site; fs, frameshift; ns, nonsense; ms, missense.
High analytic sensitivity and specificity of p53 immunohistochemistry as a readout for TP53 alterations
We hypothesized that p53 accumulation detected using immunohistochemistry would provide a reliable surrogate for TP53 mutations/CN status in AML. We posited that coupling p53 immunohistochemistry with a clinical-grade digital image analysis algorithm would enhance analytic consistency and reproducibility. To test our hypothesis, we performed digital image analysis on p53 immunohistochemistry stains from 211 patients with AML in this study group; these included all the patients in the prospective group of 101 consecutive patients with AML seen at our institution and evaluated clinically using immunohistochemistry alongside mutation and genomic profiling.
Accumulation of p53 in TP53-mutant AML was detected readily by immunohistochemistry manifesting primarily as high-level nuclear accumulation (Figure 3A). The p53 staining signal in patients with wild-type TP53 was weak and heterogeneous in intensity (wild-type pattern; p53wt) (supplemental Figure 3). In keeping with previous studies, the percentage of high-level nuclear p53 accumulation (3+ staining intensity, not 2+ or 1+) was regarded as the most informative metric for TP53 mutation status. In this study group, TP53-mutant AML cases had significantly higher numbers of cells with high-level p53 accumulation compared with wild-type cases (median 24.0%; range: 0.4% to 49.7% vs 1.2%; range: 0.0-15.9; P < .001) (Figure 3B). Close protein-genotype evaluation that included reassessment of raw next-generation sequencing (NGS) data of 4 cases originally thought to be TP53-mutated AML with discordant p53wt pattern by immunohistochemistry, demonstrated that 3 were overcalls that represented nonspecific reads, whereas 1 TP53 variant was a polymorphism that was miscalled as a mutation. These findings suggest that p53 protein expression status informs TP53 mutation evaluation studies.
![p53 expression patterns by immunohistochemistry as a readout for TP53 alterations. (A) p53 immunohistochemistry showing high-level (24%) mutant protein accumulation in a trephine bone marrow biopsy with AML (×20). (B) Violin plot showing median and quartiles, with smoothed width reflecting frequency distribution of p53 accumulation levels in bone marrow samples with TP53 mutant and wild-type AML. p53 accumulation is measured using digital image analysis-assisted immunohistochemistry; percentage values represent cells with strong (3+) staining intensity. Cases with mutant p53 truncating pattern are excluded. Dashed line intersecting x-axis depicts 7.2% cutoff. (C) p53 immunohistochemistry showing loss of signal (truncated) mutant pattern. Signal in background stromal elements presents internal control (×20). (D) ROC curve demonstrating an AUC of 0.965 (95% CI: 0.939-0.991), indicating a robust predictive ability for p53 immunohistochemistry to distinguish between AML with mutant and wild-type TP53. (E) Estimates of mutant p53 clone size by dominant VAF and protein expression among p53high and (F) p53truncated. (G) Combined aCGH and SNP analysis of the TP53 gene in AML case with intact TP53 CN; right panel shows corresponding p53high expression by immunohistochemistry [A, C, G: 20× magnification, hematoxylin counterstain].](https://ash.silverchair-cdn.com/ash/content_public/journal/blood/140/1/10.1182_blood.2021013983/2/m_bloodbld2021013983f3.png?Expires=1769630338&Signature=XPPh4eqHqM6c-hQhb6UgKab6Ioc89AvIIXCREa7U7U8KwH8OwIj9egZR6A49f-SZ45euxFRyw-hjnsbDbR2GuC7NMoj9VSuHMSqkbWsDJXinFUfooB7GnABBbOSgoz-IBM2TLqZCRH79REnNOzICHznd-GLTMhJNjGLrqZsFlV6NnIihqeTzRpQUvyzyvsC5yjMgrX9VbaazZHzNq-5pZxPLpYGyZJtH1WU7s03hIAPjLo2o1wts6xJD44-Uc4rnaT791DpdbOWUporb6UxYbjneo4ZcfZlwm58syuORBRtYqIZFZduQ6RONVk7KgwFibnrIz0pdoxfhrdmKs6ePzg__&Key-Pair-Id=APKAIE5G5CRDK6RD3PGA)
p53 expression patterns by immunohistochemistry as a readout for TP53 alterations. (A) p53 immunohistochemistry showing high-level (24%) mutant protein accumulation in a trephine bone marrow biopsy with AML (×20). (B) Violin plot showing median and quartiles, with smoothed width reflecting frequency distribution of p53 accumulation levels in bone marrow samples with TP53 mutant and wild-type AML. p53 accumulation is measured using digital image analysis-assisted immunohistochemistry; percentage values represent cells with strong (3+) staining intensity. Cases with mutant p53 truncating pattern are excluded. Dashed line intersecting x-axis depicts 7.2% cutoff. (C) p53 immunohistochemistry showing loss of signal (truncated) mutant pattern. Signal in background stromal elements presents internal control (×20). (D) ROC curve demonstrating an AUC of 0.965 (95% CI: 0.939-0.991), indicating a robust predictive ability for p53 immunohistochemistry to distinguish between AML with mutant and wild-type TP53. (E) Estimates of mutant p53 clone size by dominant VAF and protein expression among p53high and (F) p53truncated. (G) Combined aCGH and SNP analysis of the TP53 gene in AML case with intact TP53 CN; right panel shows corresponding p53high expression by immunohistochemistry [A, C, G: 20× magnification, hematoxylin counterstain].
p53 expression patterns by immunohistochemistry as a readout for TP53 alterations. (A) p53 immunohistochemistry showing high-level (24%) mutant protein accumulation in a trephine bone marrow biopsy with AML (×20). (B) Violin plot showing median and quartiles, with smoothed width reflecting frequency distribution of p53 accumulation levels in bone marrow samples with TP53 mutant and wild-type AML. p53 accumulation is measured using digital image analysis-assisted immunohistochemistry; percentage values represent cells with strong (3+) staining intensity. Cases with mutant p53 truncating pattern are excluded. Dashed line intersecting x-axis depicts 7.2% cutoff. (C) p53 immunohistochemistry showing loss of signal (truncated) mutant pattern. Signal in background stromal elements presents internal control (×20). (D) ROC curve demonstrating an AUC of 0.965 (95% CI: 0.939-0.991), indicating a robust predictive ability for p53 immunohistochemistry to distinguish between AML with mutant and wild-type TP53. (E) Estimates of mutant p53 clone size by dominant VAF and protein expression among p53high and (F) p53truncated. (G) Combined aCGH and SNP analysis of the TP53 gene in AML case with intact TP53 CN; right panel shows corresponding p53high expression by immunohistochemistry [A, C, G: 20× magnification, hematoxylin counterstain].
We identified 34 patients with complete absence of p53 signal by immunohistochemistry, a mutant protein expression pattern referred to henceforth as “truncated” (p53truncated) (Figure 3C). This pattern was detected in 34/128 (26.6%) patients with TP53-mutant AML evaluated by p53 immunohistochemistry. Lack of p53 protein signal by immunohistochemistry was easily discernible by manual visual evaluation with perfect correlation with TP53 mutation status. TP53 mutations in this group occurred between codons 32 and 283. Among this group, 29 patients had 1 TP53 mutation, including frameshift (12/29), nonsense (10/29), and splice site (7/29), and 5 patients had >1 TP53 mutations, including nonsense (6/11), frameshift (3/11), and missense (2/11); in total, 40 mutations comprised nonsense (16/40, 40%), frameshift (15/40; 37.5%), splice site (7/40; 17.5%), and missense (2/40; 5%). TP53 CN status was available on 26 patients, 21 with CNloss and 5 CNintact; all the latter had 1 TP53 mutation, and 4 with available cnLOH data were negative. The truncating pattern was detected in 25 patients with AML-MRC, 7 patients with t-AML, and 2 patients with AMLpMPN. Notably, 17 patients had untreated AML, 9 patients presented for salvage therapy, and 8 patients were tsFL. All patients had complex cytogenetics with myelodysplasia-related alterations.
The goal of incorporating the prospective study group was to evaluate the utility of p53 immunohistochemistry as a rapid (∼24 hours) and effective clinical tool to screen for TP53 genomic status early on in the process of therapy selection for patients with AML. The incidence of TP53 mutations in the prospective group was 19.8% (20/101); 14 patients had 1 TP53 mutation (5 CNintact; 8 CNloss; 1 CN unknown), and 6 patients had >1 TP53 mutations (2 CNintact; 3 CNloss; 1 CN unknown). During the course of accrual, it became clear that p53 immunohistochemistry offered advantages in terms of quick triage, with robust performance in terms of distinguishing TP53 wild-type cases from those that had high-level p53 accumulation. However, the prospective process of p53 readouts highlighted the need to determine an optimal cutoff for p53 accumulation in AML.
To address this gap, the analytic sensitivity of p53 immunohistochemistry in this AML cohort was evaluated next using any TP53 mutation status as a reference standard. Receiver operating characteristic (ROC) curve demonstrated an area under the curve (AUC) of 0.965 (95% CI: 0.939-0.991), indicating a robust predictive ability for p53 immunohistochemistry to distinguish between AML with mutant and wild-type TP53 (Figure 3D). We evaluated the predictive strength of various mathematical permutations derived from p53 immunohistochemistry digital image reads using different staining intensity combinations (0 + 1 vs 2 + 3; 0 vs 1 + 2+3; 0 vs 2 + 3; etc.); however, none provided substantive enhancements to AUC (data not shown). We concluded that a simple determination of the percentage of cells with high-level p53 accumulation (3+ staining intensity; ie, 0 + 1+2 vs 3) provided the simplest and most reliable global readout of TP53 alterations. This conclusion is in line with previously published findings.19,24 We then sought to calculate the optimal p53 immunohistochemistry cutoff based on the ROC curve using various computational tools. In this analysis, p53truncated cases were excluded. Optimal cutoff determinations were considered using the MAXSpSe, MinPvalue, Youden, and ROC01 methods. The MaxSpSe method yielded the best balance of sensitivity, specificity, and accuracy using a cutoff of 7.2% (supplemental Table 4). Accordingly, we used henceforth a cutoff of >7.2% cells to define high-level p53 accumulation mutant pattern (p53high). The analytic performance of the p53 stain using the 7.2% cutoff level and including the p53truncated is summarized in supplemental Table 5. The size of p53high clones tended to be lower relative to estimates based on dominant TP53 VAF; conversely, the size of p53truncated clones tended to be higher relative to estimates based on dominant TP53 VAF (Figure 3E-F).
p53 immunohistochemistry characteristics within clinical groups and diagnostics groups of AML
After having confirmed the analytic performance of p53 immunohistochemistry as a readout assay for p53 alterations in AML, we turned our attention to understanding the landscape of p53 accumulation across various clinical and diagnostics groups in conjunction with other known clinically relevant factors in AML. When compared on the basis of p53 expression patterns, patients with AML with p53wt and those with any mutant p53 expression pattern (p53high or p53truncated) differed significantly along clinicopathologic variables previously demonstrated to be dependent on TP53 mutation status. Those differences were among patients categorized on the basis of cytogenetic risk groups, TP53 CN status, WHO groups, FL vs salvage, venetoclax-based treatment regimens, and measurable residual disease status (Table 1). Notably, p53 expression patterns correlated with best response among patients treated on FL regimens (P < .001). Three patients in this study group had Li-Fraumeni syndrome; 2 patients evaluated had p53truncated, which corresponded to a frameshift mutation and CNloss in one and a splice site mutation and CNintact/cnLOH− in another.
Clinical characteristics of patients with AML by p53 protein expression patterns
| Characteristics | Mutant p53 expression pattern* | wt p53 expression pattern† | |||
|---|---|---|---|---|---|
| p53high (n = 93) | p53truncated (n = 34) | p53wt (n = 84) | P* | P† | |
| Age | 66.7 (21.7-86.9) | 66.9 (17.9-87.4) | 64.1 (18.7-89.0) | .613 | .274 |
| Age >60 y | 23 (24.7%) | 12 (35.3%) | 29 (34.5%) | .238 | .281 |
| Sex (Male) | 48 (51.6%) | 17 (50%) | 50 (59.5%) | .872 | .234 |
| Race | .539 | .136 | |||
| White | 66 | 20 | 60 | ||
| Black | 11 | 6 | 8 | ||
| Hispanic | 5 | 1 | 9 | ||
| Asian | 6 | 3 | 1 | ||
| Other | 5 | 4 | 6 | ||
| Blast count (range) | 38 (20-98%) | 42 (20-88%) | 57 (20-97%) | .671 | .001 |
| White blood count | 2.9 (0.1-171.6) | 5.1 (0.3-51.8) | 7.3 (0.8-251.1) | .283 | .002 |
| Serum lactate dehydrogenase | 561 (144-12 593) | 767 (220-10 721) | 348 (118-3083) | .015 | <.001 |
| Mutation type | <.001 | <.001 | |||
| Missense | 71 | 1 | 6 | ||
| Nonsense | 4 | 13 | 1 | ||
| Frameshift | 3 | 13 | 0 | ||
| Deletion | 3 | 0 | 0 | ||
| Splice site | 5 | 7 | 0 | ||
| Not applicable (wt) | 7 | 0 | 0 | ||
| Median TP53 VAF (range) | 47.4 (1.0-97.3%) | 54.3 (2.0-94.2%) | 43.75 (2.6-95.4%) | .570 | .933 |
| Mutation location (domains) | .001 | <.001 | |||
| TAD (1−44) | 0 | 1 | 0 | ||
| TAD2 (35−59) | 0 | 1 | 0 | ||
| DBD (109−288) | 78 | 21 | 7 | ||
| TETRAMER (319−355) | 2 | 0 | 1 | ||
| Other | 1 | 4 | 0 | ||
| Splicing site | 5 | 7 | 0 | ||
| Cytogenetic risk group | .504 | <.001 | |||
| Adverse | 85 | 33 | 19 | ||
| Intermediate | 5 | 0 | 57 | ||
| Favorable | 1 | 0 | 6 | ||
| Complex karyotype | 79 | 33 | 5 | .095 | <.001 |
| Del(5q)/-5 & del(7q)/-7 | 69 | 26 | 13 | n/a | n/a |
| Normal karyotype | 4 | 0 | 48 | n/a | n/a |
| TP53 mutation & allelic state | .415 | <.001 | |||
| wt & normal CN | 7 | 0 | 76 | ||
| 1 mutation & CNloss | 42 | 19 | 3 | ||
| 1 mutation & normal CN | 10 | 5 | 4 | ||
| >1 mutation & CNloss | 6 | 2 | 0 | ||
| >1 mutation & normal CN | 4 | 0 | 0 | ||
| TP53 CN loss | 48/69 | 21/26 | 3/83 | .275 | <.001 |
| Primary vs secondary AML | .690 | .001 | |||
| Primary | 65 | 25 | 6 | ||
| Secondary‡ | 28 | 9 | 1 | ||
| AML WHO category | .560 | <.001 | |||
| AML-MRC | 59 | 25 | 22 | ||
| t-AML | 24 | 7 | 6 | ||
| AMLpMPN | 4 | 2 | 2 | ||
| AML with recurrent genetic alterations | 5 | 0 | 38 | ||
| AML not otherwise specified | 1 | 0 | 16 | ||
| Treatment status | .720 | <.001 | |||
| FL | 51 | 17 | 77 | ||
| Secondary FL | 16 | 8 | 3 | ||
| Salvage | 26 | 9 | 4 | ||
| Venetoclax-based therapy | 26/76 (34.2%) | 10/25 (40%) | 52/70 (74.3%) | .600 | <.001 |
| Therapy intensity | .567 | .149 | |||
| High | 24 | 7 | 31 | ||
| Low | 52 | 18 | 39 | ||
| Stem cell transplant | 6 | 2 | 8 | n/a | n/a |
| Best response | <.001 | ||||
| Complete remission | 18 | 7 | 44 | ||
| Incomplete remission (CRi) | 11 | 3 | 10 | ||
| No response | 34 | 7 | 4 | ||
| Measurable residual disease | 18/28 | 5/7 | 0/2 | .722 | n/a |
Categorical variables are compared using Pearson χ2 test or Fisher's exact test. Continuous variables between patient groups are compared using the Mann-Whitney U test.
n/a, not applicable; TAD, transactivation domain; wt, wild-type.
Comparison between p53high and p53truncated.
Comparison between p53mutant (p53high+p53truncated) vs p53wt.
Includes AML arising after antecedent hematologic neoplasm and t-AML.
Boldface highlights significant P values.
Next, we compared patients with AML with p53high vs p53truncated mutant expression patterns. We identified significant differences in serum lactate dehydrogenase concentration, mutation types, and p53 domain involvement. However, there was no difference between these patient groups in terms of TP53 VAF, cytogenetic risk groups, TP53 CN status, FL vs salvage/tsFL, venetoclax-based treatment regimens, best response, or measurable residual disease status.
We then conducted in-depth analysis of p53 expression patterns in patients with AML with 1 TP53 mutation and CNintact status, as recent studies have suggested that TP53 mutations in such a context might not correlate with bona fide p53 pathway alterations in myeloid malignancies.6 Among 19 patients with these features, 15 (78.9%) patients had mutant pattern p53 protein expression (10 p53high; 5 p53truncated). The median TP53 VAF was 44.5% (range, 9.2-91.2), and 13/15 (86.7%) patients had complex cytogenetics. The 4 patients with p53wt included 3 with diploid karyotype, of whom 2 had a TP53 VAF <5%. p53 expression data were available on 3 (out of 5) patients with cnLOH. Notably, the only patient among these who had p53wt expression had TP53 mutation involving the tetramer domain; the other two had mutations involving the DBD and had p53high expression (Figure 3G). Furthermore, 22/93 (23.6%) patients had TP53 CNintact, and VAF >50%, among whom 4 were cnLOH+ and 5 cnLOH−, with mutant p53 expression demonstrable in 7/8 patients with available data (5 p53high; 2 p53truncated). These findings suggest that p53 expression pattern by immunohistochemistry supplements mutation and TP53 CN data.
TP53 VAF was <5% in 4/211 (1.9%) patients evaluated for p53 expression (all mutations involved DBD), and among these, 2 patients had p53wt (both TP53 CNintact), whereas 2 patients had mutant p53 expression (1 p53high; 1 p53truncated; both had TP53 CNloss). The patient with p53high had VAF = 2.16%, whereas the number of cells with 3+ p53 staining was 24%. Although these numbers are small, they further indicate that p53 expression provides a robust tool that integrates mutation and CN status and even in cases where TP53 VAF appears to be low.
To gain a focused understanding of the mutational landscape in TP53-mutated AML, we next evaluated somatic mutations detected on a clinically validated 81-gene NGS panel designed for the evaluation of myeloid neoplasms in the context of clinicopathologic parameters and other p53-related alterations. This analysis included 173 patients, 111 (64.2%) patients with FL, 38 (21.9%) salvage patients, and 24 (13.9%) ts-FL patients. Among FL patients, the most common genes comutated with TP53 included genes involved in epigenetic regulation (DNMT3A and TET2), RAS/MAPK signaling (NF1, KRAS/NRAS, PTPN11), and RNA splicing (SRSF2) (Figure 4A). These comutations were largely similarly prevalent in the ts-FL and salvage group (Figure 4B). Patients who had 1 TP53 mutation most commonly had comutations involving SRSF2, RUNX1, and ASXL1, whereas those with ≥2 TP53 mutations most commonly had comutations involving KRAS/NRAS and PTPN11 as well as RUNX1.
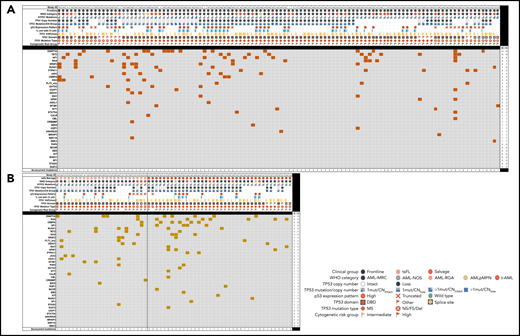
Landscape of comutations in TP53-mutant AML. (A) Untreated (FL). (B) Treated-secondary FL and salvage.
Landscape of comutations in TP53-mutant AML. (A) Untreated (FL). (B) Treated-secondary FL and salvage.
Outcome analysis of AML as a function of TP53 mutation, TP53 CN, and p53 protein expression status
Outcome analysis was performed on patients with AML with mutant TP53. Univariate analysis was first performed on the FL group, which included 238 patients, of whom 220 (92.4%) patients died, with a median OS time of 6.6 months (95% CI: 5.0-7.3). Notable variables that showed significant correlation with OS included cytogenetic risk group, number of TP53 mutations (1 vs ≥1), TP53 CN status, TP53 VAF, δTP53 VAF (difference between TP53 VAFmax and the VAF of a concomitant mutation if present) (Figure 5A). Although there was a significant difference in OS on the basis of WHO categories, this difference was driven primarily by AML-recurrent genetic abnormalities and AML-not otherwise specified, with patients with AML-MRC, t-AML, and AMLpMPN having similar OS (Figure 6A). There was no difference in OS on the basis of the dominant TP53 mutation type (MS vs NS/FS/del vs splice site) or p53high vs p53truncated. Among patients with 1 TP53 mutation, those with TP53 CNloss had significantly worse OS (HR = 1.649; 95% CI: 1.159-2.348; P = .0055) (Figure 6B). The predictive impact of TP53 CN status was not observed when AML harbored >1 TP53 mutation (P = .2785). Of note, when all FL patients were considered, p53 expression pattern by immunohistochemistry showed remarkable correlation with OS (p53wt HR = 0.22; 95% CI: 0.13-0.37; P < .001) (Figure 6C). Importantly, the predictive value of p53 expression pattern was retained in patients with AML with any TP53 mutation number and TP53 CNintact (p53mut HR = 4.814; 95% CI: 1.730-13.40; P = .0046) (Figure 6D). We evaluated higher p53high cutoffs, namely 20%, 30%, and 40%, for correlation with OS in the FL group. Univariate analysis showed significant correlation with OS at 20% (HR: 2.58; 95% CI: 1.23-5.42; P = .0123) and 30% (HR: 1.98; 95% CI: 1.03-3.82; P = .0414) but not at 40% (P = .3545).
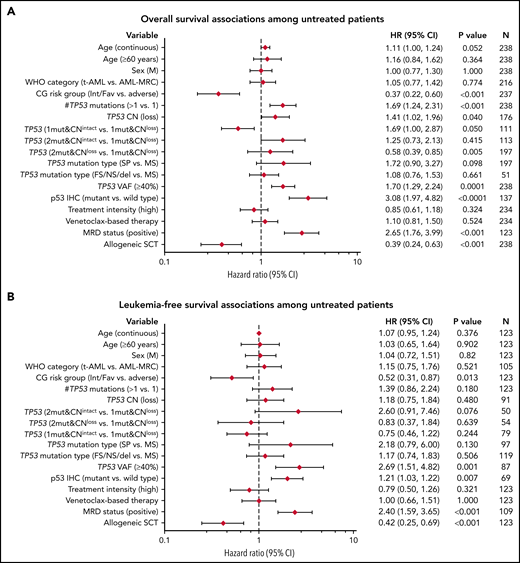
Univariate analysis of factors associated with survival outcomes among FL patients with AML. (A) OS; (B) LFS. This analysis included patients with at least 1 TP53 mutation, except for p53 IHC.
Univariate analysis of factors associated with survival outcomes among FL patients with AML. (A) OS; (B) LFS. This analysis included patients with at least 1 TP53 mutation, except for p53 IHC.
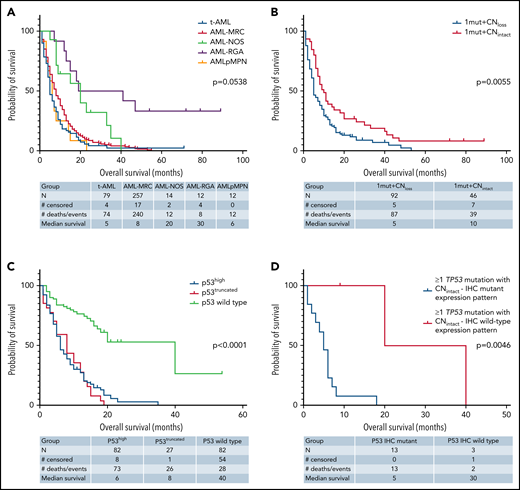
Kaplan-Meier curves showing outcomes of FL patients with AML by genotype/phenotype p53 status. (A) OS by diagnostic category among patients with mutant TP53. (B) OS by TP53 CN status among patients with 1 TP53 mutation. (C) OS comparison of patients with AML by p53 protein expression patterns detected by immunohistochemistry. (D) OS comparison by immunohistochemistry-based p53 protein expression pattern among patients with any TP53 mutation and intact TP53 CN. NOS, not otherwise specified; RGA, recurrent genetic alteration.
Kaplan-Meier curves showing outcomes of FL patients with AML by genotype/phenotype p53 status. (A) OS by diagnostic category among patients with mutant TP53. (B) OS by TP53 CN status among patients with 1 TP53 mutation. (C) OS comparison of patients with AML by p53 protein expression patterns detected by immunohistochemistry. (D) OS comparison by immunohistochemistry-based p53 protein expression pattern among patients with any TP53 mutation and intact TP53 CN. NOS, not otherwise specified; RGA, recurrent genetic alteration.
Variables that showed significant correlation with LFS included cytogenetic risk group, TP53 VAF (continuous and categorical at a cutoff of >40% reported previously by Short et al25), and δTP53 VAF. Here also, when all FL patients were considered, p53 expression pattern by immunohistochemistry showed remarkable correlation with LFS (p53wt HR: 0.26; 95% CI: 0.14-0.49; P < .001) (Figure 5B).
We then performed univariate analysis on salvage and tsFL patients with TP53 mutations. This group included 140 patients, of whom 128 (91.4%) patients died, with a median OS time of 4.3 months (95% CI: 3.5-5.4). Only the cytogenetic risk group showed significant correlation with OS. When all salvage and tsFL patients were considered, p53 expression pattern by immunohistochemistry showed remarkable correlation with OS in this group as well (p53wt HR: 0.06; 95% CI: 0.01-0.44; P = .006). Similar findings were identified for LFS in this group when all salvage and tsFL patients were considered, including a favorable correlation between p53 expression and LFS (p53wt HR = 0.26; 95% CI: 0.14-0.49; P < .001).
Multivariable analysis using the Cox proportional hazards model in the FL group showed independent correlation between cytogenetic risk groups (low/intermediate vs adverse), aSCT, number of TP53 mutations, and TP53 VAF (>40% vs ≤40%), and OS (Table 2). Of these, only the cytogenetic risk group correlated independently with LFS (supplemental Table 6). Notably, among FL patients with p53high, a cutoff of 20% showed independent correlation with OS (supplemental Table 7).
Cox proportional hazards multivariable analysis of factor association with OS among FL patients with 1 or more TP53 mutations
| Parameter* | Full model (N = 237 with 219 events) | Reduced model | ||||||||||||||
|---|---|---|---|---|---|---|---|---|---|---|---|---|---|---|---|---|
| HR (95% CI) | Individual P | Overall P | HR (95% CI) | Individual P | Overall P | |||||||||||
| Age, y, continuous | 1.01 (0.99, 1.02) | .3655 | .3655 | |||||||||||||
| Cytogenetic risk group | ||||||||||||||||
| Intermediate/favorable (N = 213; 89.9%) vs adverse (N = 24; 10.1%) | 0.43 (0.24, 0.77) | .0046 | .0046 | 0.45 (0.27, 0.74) | .0018 | .0018 | ||||||||||
| Allo-SCT† | ||||||||||||||||
| Yes (N = 23; 9.7%) vs no (N = 214; 90.3%) | 0.54 (0.31, 0.95) | .0313 | .0313 | 0.49 (0.30, 0.81) | .0052 | .0052 | ||||||||||
| TP53 CN | ||||||||||||||||
| Loss (N = 113; 64.2%) vs intact (N = 63; 35.8%) | 0.98 (0.67, 1.44) | .9191 | .5932 | |||||||||||||
| TP53 mutation | ||||||||||||||||
| >1 (N = 59; 24.9%) vs = 1 (N = 178; 75.1%) | 1.81 (1.30, 2.52) | .0004 | .0004 | 1.78 (1.30, 2.45) | .0004 | .0004 | ||||||||||
| TP53 VAF | ||||||||||||||||
| >40% (N = 130; 54.8%) vs ≤40% (N = 107; 45.2%) | 1.75 (1.32, 2.32) | .0001 | .0001 | 1.71 (1.29, 2.26) | .0002 | .0002 | ||||||||||
N = 237 except for allo-SCT, N = 176.
Analyzed as a time-dependent covariate.
Boldface highlights significant P values.
Discussion
In this study, we undertake an integrative multidimensional evaluation of the landscape of p53 dysregulation in AML, including the interplay of somatic mutations, CN alterations, and protein expression patterns evaluated by digital image-assisted immunohistochemistry. Our findings demonstrate that p53 protein expression status correlates with TP53 mutation and CN status, with p53high and p53truncated patterns being predictive of mutant TP53, whereas p53wt being predictive of wild-type TP53 status. These findings provide a basis to identify patients with substantive p53 dysregulation that goes beyond mere TP53 mutation and/or CN status.
Our work is the first large-scale study designed specifically to understand the landscape and correlates of p53 dysregulation in primary AML samples. We observed that the 3 most frequent TP53 hotspot mutations in AML are similar to those in MDS: R248, R273, and Y220. R175H is a well-known pan-cancer TP53 hotspot mutation. Interestingly, we did not observe this mutation at a high frequency in our FL group, yet it was among the most frequent hotspot mutants in the salvage/s-FL group akin to what was reported in MDS.6,17,26 This suggests that the TP53 mutation thread that contributes to MDS pathogenesis and eventually AML transformation favors TP53 hotspots that differ from those at play in the pathogenesis of de novo AML. We also identified frequent truncating mutations in AML: P153fs in the FL AML-MRC group, a fairly underreported mutation that has been reported only in colon cancer,27 and R213* in the FL t-AML and salvage groups, a reported mutation in solid tumors, eg, melanoma, as well as hematopoietic neoplasms, including MDS.28,29 Functional implications of these mutations remain to be determined in experimental models. Indeed, given the high frequency of these truncating mutations, efforts aimed at gene editing-targeted therapy of such mutations might hold promise. In addition, in this study, we identified that the most common genes comutated with TP53 included genes involved in epigenetic regulation (DNMT3A and TET2), RAS/MAPK signaling (NF1, KRAS/NRAS, PTPN11), and RNA splicing (SRSF2). This is similar to findings reported in a metaanalysis,30 albeit our finding of frequent mutations in SRSF2 in this context is novel.
One important aspect in p53 regulation is TP53 CN status, which spans whole chromosome 17 loss, whole 17p arm loss, and subarm loss.31 In clinical practice, such evaluation usually entails conventional karyotyping, FISH, and aCGH. CN status is also increasingly inferred from NGS analyses, with analytic performance that is hypothetically similar to that of aCGH+SNP evaluation. In this study, we based TP53 CN status on karyotyping, FISH, and/or aCGH data. Although this was a generally practical approach in our data set, we encountered rare cases with presumptive LOH and uniparental disomy based on TP53 VAF >50%. Data in a subset of these cases showed that mutant p53 expression may be identified in the presence or absence of cnLOH, suggesting that cnLOH may not be a critical determinant of mutant p53 expression in AML with TP53 CNintact. Although additional studies are needed to shed more light on TP53 cnLOH in AML, the lack of a full cnLOH data set in this study is posited to be a modest limitation. Another limitation related to the methods of CN determination is that we could not evaluate mutations in trans positions. Notwithstanding, we observed in this study that TP53 CN loss was more frequent in AML with deleterious TP53 missense mutations, as determined by the EAp53 score,32 and this in turn correlated with cytogenetic risk groups (complex karyotype). It is unknown whether such potent missense mutations exert an evolutionary fitness advantage through CN loss and abrogation of the protective effect of wild-type p53, or if they represent different mutagenic processes that occur at the outset of leukemogenesis. Indeed, a recent study showed that deletion of chromosome 17p in AML reflects not only p53 deficiency but also single-copy loss of multiple haploinsufficient tumor suppressors.14
p53 immunohistochemistry is widely available, but its use in AML has remained limited and lacking large-scale validation. The 2 key conclusions of our study in this regard, namely that 3+ staining intensity and a 7.2% cutoff for p53high are most predictive of TP53 mutation, establish a robust underpinning for future deployment of p53 immunohistochemistry as a rapid and cost-effective tool to detect patients with impactful TP53 mutations in AML. In addition, our findings suggest that p53 protein expression can further qualify TP53 mutation findings. A number of elegant studies21,33-35 have reported varying cutoff levels for p53 and used different criteria from those we propose herein. However, ours is the first evaluation of p53 immunohistochemistry in AML at a large scale using digital image analysis. We focused considerable efforts on analyzing study data to determine the most informative elements of p53 immunohistochemistry in terms of staining intensity and extent. We used rigorous staining and quality control processes36 and a clinically validated digital image analysis software algorithm optimized for nuclear staining to provide a standardized evaluation. After analyzing all permutations of p53 intensity for correlation with mutation status, a simple focus on 3+ staining emerged as most informative, corroborating prior observations in MDS by our group24 and others.34 Although our analysis rested on digital image-assisted analysis, in our experience, p53 immunohistochemistry can be easily interpreted manually, as the vast majority of AML cases show clear wild-type or mutant protein expression pattern. These attributes are of particular interest for risk stratification of patients with AML, particularly in limited resource settings. Our practical approach in the absence of digital image analysis entails careful manual quantitative assessment of p53 immunohistochemistry staining on bone marrow trephine biopsy or clot sections to quantify the proportion of cells with 3+ staining. We count at least 500 cells at high-power magnification. As a precise cutoff of 7.2% would still be difficult to ascertain in such a setting, we use <5% and >10% as cutoffs for p53wt and p53high, respectively. Cases showing 5% to 10% staining are deemed indeterminate. As indicated above, cases with p53truncated have been generally easy to identify in our experience.
Acknowledgments
The authors are grateful to the staff of the Immunohistochemistry Laboratory and the Image Analysis Laboratory at The University of Texas Anderson Cancer Center for their support. The authors also thank Dr. Guillermina (Gigi) Lozano, Professor and Chair, Department of Genetics, The University of Texas Anderson Cancer Center, for advice and critique of the manuscript.
Authorship
Contribution: J.D.K. and M.T. designed the concept, developed the study, and wrote the original draft; T.K., S.L., N.D., R.K.-S., S.P., D.S., P.W., F.K., Z.T., M.R., C.A.B., E.J.J., L.J.M., K.B., H.M.K., and F.R. performed the experimental studies, analyzed the data, and were in charge of resources. All authors contributed to the final version of the manuscript.
Conflict-of-interest disclosure: The authors declare no competing financial interests.
The current affiliation for J.D.K. is University of Nebraska Medical Center, Omaha, NE.
Correspondence: Joseph D. Khoury, Department of Pathology and Microbiology, University of Nebraska Medical Center, 985900 Nebraska Medical Center, Omaha, NE 68198-5900; e-mail: jkhoury@unmc.edu.
Requests for data may be made by contacting the corresponding author, Joseph Khoury, at jkhoury@unmc.edu.
The online version of this article contains a data supplement.
The publication costs of this article were defrayed in part by page charge payment. Therefore, and solely to indicate this fact, this article is hereby marked “advertisement” in accordance with 18 USC section 1734.

Comments
Immunohistochemistry for p53 has a high false positive rate in de novo acute myeloid leukemia
References
1. Tashakori M, Kadia TM, Loghavi S, et al. TP53 Copy Number and Protein Expression Inform Mutation Status across Risk Categories in Acute Myeloid Leukemia. Blood. Published online April 7, 2022:blood.2021013983. doi:10.1182/blood.2021013983
2. Grob T, Al Hinai ASA, Sanders MA, et al. Molecular characterization of mutant TP53 acute myeloid leukemia and high-risk myelodysplastic syndrome. Blood. 2022;139(15):2347-2354. doi:10.1182/blood.2021014472
3. Weinberg OK, Siddon AJ, Madanat Y, et al. TP53 mutation defines a unique subgroup within complex karyotype de novo and therapy-related MDS/AML. Blood Adv. Published online January 24, 2022:bloodadvances.2021006239. doi:10.1182/bloodadvances.2021006239