

Key Points
Asxl1−/− accelerated CMML progression and promoted CMML transformation to AML in NrasG12D/+ mice.
A suppressive immune microenvironment and upregulation of AP-1 TFs promote CMML transformation to AML.

Abstract
Mutations in chromatin regulator ASXL1 are frequently identified in myeloid malignancies, in particular ∼40% of patients with chronic myelomonocytic leukemia (CMML). ASXL1 mutations are associated with poor prognosis in CMML and significantly co-occur with NRAS mutations. Here, we show that concurrent ASXL1 and NRAS mutations defined a population of CMML patients who had shorter leukemia-free survival than those with ASXL1 mutation only. Corroborating this human data, Asxl1−/− accelerated CMML progression and promoted CMML transformation to acute myeloid leukemia (AML) in NrasG12D/+ mice. NrasG12D/+;Asxl1−/− (NA) leukemia cells displayed hyperactivation of MEK/ERK signaling, increased global levels of H3K27ac, upregulation of Flt3. Moreover, we find that NA-AML cells overexpressed all the major inhibitory immune checkpoint ligands: programmed death-ligand 1 (PD-L1)/PD-L2, CD155, and CD80/CD86. Among them, overexpression of PD-L1 and CD86 correlated with upregulation of AP-1 transcription factors (TFs) in NA-AML cells. An AP-1 inhibitor or short hairpin RNAs against AP-1 TF Jun decreased PD-L1 and CD86 expression in NA-AML cells. Once NA-AML cells were transplanted into syngeneic recipients, NA-derived T cells were not detectable. Host-derived wild-type T cells overexpressed programmed cell death protein 1 (PD-1) and T-cell immunoreceptor with immunoglobulin and ITIM domains (TIGIT) receptors, leading to a predominant exhausted T-cell phenotype. Combined inhibition of MEK and BET resulted in downregulation of Flt3 and AP-1 expression, partial restoration of the immune microenvironment, enhancement of CD8 T-cell cytotoxicity, and prolonged survival in NA-AML mice. Our study suggests that combined targeted therapy and immunotherapy may be beneficial for treating secondary AML with concurrent ASXL1 and NRAS mutations.
Introduction
Additional sex combs-like 1 (ASXL1) is a mammalian homolog of fly Asx.1Asx deletion leads to a homeotic phenotype characteristic of both Polycomb group (PcG; repressive complex associated with H3K27me3) and Trithorax group (activating function associated with H3K4me3) gene deletions. In addition, Asxl1 forms a deubiquitinase complex with Bap1 to remove mono-ubiquitin from H2AK119Ub. Mutations in ASXL1 are frequently identified in myeloid malignancies, in particular ∼40% of patients with chronic myelomonocytic leukemia (CMML). These mutations are predominantly nonsense or frameshift, which generate a truncated protein. Although truncated Asxl1 proteins are detectable in myeloid malignancies,2 the Asxl1-Bap1 complex is undetectable.3 Deletion of Asxl1 does not significantly affect global level of H2AK119Ub, but it does lead to significant downregulation of H3K27me3 as a result of the loss of Asxl1-mediated recruitment of PRC2 key components (such as Ezh2) to the chromatin.3,4 In addition, a novel Asxl1-Ogt axis was identified to regulate H3K4 methylation in myeloid malignancies.5 Unlike Bap1−/− mice that develop severe and early onset CMML-like phenotypes,6Asxl1 loss in mice results in myelodysplasia that could transform to myeloid leukemia with age.4,7 These studies suggest that Asxl1 deficiency cooperates with additional mutations to induce myeloid leukemias.
Activating mutations in the NRAS gene are frequently identified in CMML,8 particularly enriched in a myeloproliferative variant of CMML.9 Consistent with human genetics, all the oncogenic Nras mice we and others characterized (NrasG12D/+, NrasG12D/G12D, and NrasQ61R/+) develop CMML-like phenotypes.10-14 In human CMML, ASXL1 mutations predict inferior overall survival (OS) and are significantly associated with NRAS mutations.8,15-17 Not surprisingly, knocking down Asxl1 cooperates with retroviral overexpression of oncogenic Nras to accelerate myeloproliferation in vivo,3 but the mechanisms underlying this cooperative effect remain elusive.
Here, we show that, similar to patients with CMML who have concurrent NRAS and ASXL1 mutations, Asxl1−/−;NrasG12D/+ (NA) mice developed accelerated CMML, approximately half of which transformed to acute myeloid leukemia (AML). Molecular analysis revealed an AP-1 transcription factor (TF)–mediated oncotranscriptome and a suppressive immune microenvironment in NA-AML mice. Combinatorial treatment with MEK and BET inhibitors targeted both leukemia and CD8 T cells and prolonged the survival of NA-AML mice.
Materials and methods
Whole-exome sequencing (WES) of human CMML cells
Primary human CMML samples were obtained from the University of Wisconsin Carbone Cancer Center Translational Science Biocore Biobank with approval of the Institutional Review Board. Genomic DNA was extracted using Gentra Puregene Cell Kit (QIAGEN) and was submitted to Otogenetics for exome capture and next-generation sequencing. The coverage for CMML-8 was ∼40×, whereas the coverage for CD3+ T cells (nonleukemia control) and the remaining bone marrow cells from CMML-34 was ∼150×. Data were aligned to the hg19 reference genome and analyzed by BioInfoRx.
Mice
All mouse lines were maintained in a pure C57BL/6 genetic background (>N10). Genotyping of NrasLSL G12D/+, Asxl1fl/fl (stock #025665; The Jackson Laboratory), and Vav-Cre was performed as previously described.10,18,19 CD45.1+ congenic C57BL/6 recipient mice were purchased from The Jackson Laboratory (stock #002014). All animal experiments were conducted in accordance with the Guide for the Care and Use of Laboratory Animals and were approved by an Animal Care and Use Committee at the University of Wisconsin-Madison. The program is accredited by the Association for Assessment and Accreditation of Laboratory Animal Care. Additional methods are described in supplemental Materials and methods (available on the Blood Web site).
Results
Concurrent ASXL1 and NRAS mutations associate with poor prognosis in CMML patients
We and others previously showed that oncogenic Nras mutation is sufficient to induce a CMML-like disease in mice.12,13,20 However, whether this mutation serves as a founding or progression secondary mutation in human CMML is unknown. To address this, we first investigated which populations of hematopoietic stem and progenitor cells harbored RAS mutations. Three primary bone marrow mononuclear cell samples from untreated patients with CMML were immunophenotypically sorted for long-term and short-term hematopoietic stem cells (HSCs), 2 known aberrant HSC phenotypes (A2HSC and A3HSC), common myeloid progenitors, and granulocyte-macrophage progenitors.21,22 Mesenchymal stromal cells (MSCs) from each sample were cultured in low oxygen conditions and passaged twice to serve as germline controls (MSC2). Myeloid cells (CD33+), T cells (CD3+), and all hematopoietic cells (CD45+) were also sorted as controls. As expected, mutations in epigenetic modifiers (eg, TET2 and ASXL1) and RAS pathway genes (eg, NRAS and KRAS) were identified. In patients 1 and 2, RAS mutations were identified at the HSC level at high variant allele frequencies (VAFs), whereas in patient 3, RAS mutation was detectable only in more committed myeloid cells (supplemental Figure 1A). Collectively, these data suggest that RAS mutations can be present in a founding clone or a founding clone–derived subclone. We then performed WES on several samples from patients with a myeloproliferative variant of CMML, which were enriched for RAS pathway mutations.9 In CMML-8, we identified that VAFs were ∼50% of NRASG12D and TET2T270fs mutations (supplemental Figure 1B). By contrast, in CMML-34, we identified a novel DGKZD624G mutation at 50% VAF, whereas the NRASQ61R mutation was at 24% VAF (supplemental Figure 1B). Our data suggest that NRAS mutations could serve as founding or progression secondary mutations in patients with CMML. This is consistent with our previous study, in which we sequenced individual myeloid colonies derived from CMML patients and found that NRAS mutations could arise in founder clones.23
We established an international multicenter CMML cohort (n = 1155) to further investigate the impact of NRAS and other genetic mutations on survival of CMML patients (Figure 1). Consistent with previous studies,8,15-17 we found that NRAS mutations were significantly associated with ASXL1 mutations (19.1% in ASXL1-mutant [MT] vs 13.5% in ASXL1 wild-type [WT]; P = .012) (Figure 1A). We stratified CMML patients into 4 groups based on the status of NRAS and ASXL1 mutations: ASXL1WT;NRASWT, ASXL1WT;NRASMT, ASXL1MT;NRASWT, and ASXL1MT;NRASMT (Figure 1B). We found that compared with ASXL1WT;NRASWT patients, ASXL1MT;NRASWT patients had significantly shorter OS (P < .0001) and leukemia-free survival (P < .0001). Compared with ASXL1MT;NRASWT patients, OS tended to be shorter (P = .07) and leukemia-free survival was significantly shorter (P = .047) in ASXL1MT;NRASMT patients. These data demonstrate that concurrent NRAS and ASXL1 mutations define a population of CMML patients who have poor outcomes.

Concurrent NRAS and ASXL1 mutations associate with poor prognosis in CMML. (A) Percentages of CMML patients with NRAS mutation in patients with MT or WT ASXL1 are shown. P value was determined using the χ2 test. (B) Overall survival and leukemia-free survival of CMML patients stratified on the basis of ASXL1 and NRAS mutation status. P values were determined using the log-rank test.
Concurrent NRAS and ASXL1 mutations associate with poor prognosis in CMML. (A) Percentages of CMML patients with NRAS mutation in patients with MT or WT ASXL1 are shown. P value was determined using the χ2 test. (B) Overall survival and leukemia-free survival of CMML patients stratified on the basis of ASXL1 and NRAS mutation status. P values were determined using the log-rank test.
Asxl1−/− accelerates CMML progression and promotes AML transformation in NrasG12D/+ mice
To determine whether Asxl1 mutation cooperates with oncogenic Nras to promote CMML, we generated Asxl1fl/fl;Vav-Cre or Asxl1fl/–;Vav-Cre (Asxl1−/−), NrasLSL G12D/+;Vav-Cre (NrasG12D/+), and NrasLSL G12D/+;Asxl1fl/fl;Vav-Cre or NrasLSL G12D/+;Asxl1fl/–;Vav-Cre (NA) mice as previously described.24,25Vav-Cre mice19 were used as controls throughout the study. At age 6 weeks, Asxl1−/− mice were asymptomatic compared with control mice, whereas NrasG12D/+ mice displayed moderate CMML-like phenotypes, including splenomegaly with extramedullary hematopoiesis (Figure 2A; data not shown), leukocytosis (Figure 2B), and an increased number of monocytes (Mac1+Gr1–) in peripheral blood (Figure 2C). These phenotypes became more severe in NA mice (Figure 2A-C) and older NrasG12D/+ mice (age 10 weeks; supplemental Figure 2), suggesting that Asxl1−/− accelerates CMML progression in NrasG12D/+ mice.
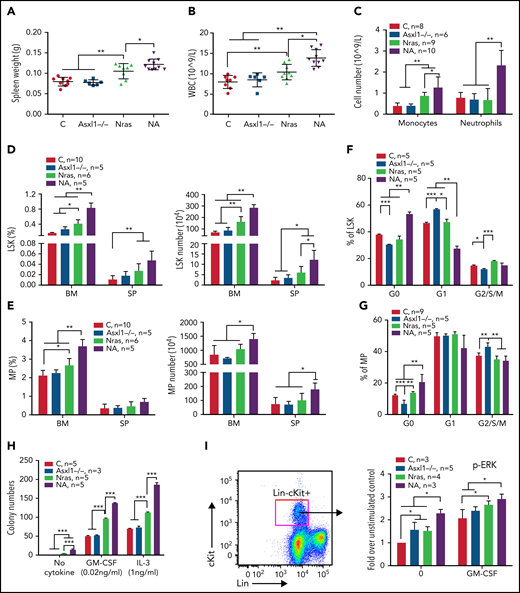
Asxl1−/− promotes ERK hyperactivation and CMML-like phenotypes in NrasG12D/+ mice. Control (C; Vav-Cre), Asxl1−/− (Asxl1−/−), NrasG12D/+ (Nras), and NrasG12D/+;Asxl1−/− (NA) mice were euthanized at age 6 weeks. Quantification of (A) spleen weight, (B) white blood cells (WBCs) in peripheral blood, and (C) numbers of monocytes and neutrophils in peripheral blood. (D-E) Frequencies and absolute numbers of (D) LSK cells and (E) MP cells in bone marrow (BM; including femurs and tibias) and spleen (SP). (F-G) Cell cycle analysis of (F) LSK cells and (G) MP cells from bone marrow using Ki67 and 4′,6-diamidino-2-phenylindole (DAPI). (H) A total of 5 × 10⁴ bone marrow cells were plated in duplicate and cultured in semisolid medium with or without granulocyte-macrophage colony-stimulating factor (GM-CSF) or interleukin-3 (IL-3). Colony numbers were counted after 7 days in culture. (I) Bone marrow cells were serum- and cytokine-starved for 2 hours at 37°C. Cells were then stimulated with or without 2 ng/mL of murine GM-CSF for 10 minutes at 37°C. Levels of pERK1/2 were measured using phospho-flow cytometry in Lin–/lowc-Kit+ cells. Data are presented as mean + standard deviation (SD). *P < .05; **P < .01; ***P < .001.
Asxl1−/− promotes ERK hyperactivation and CMML-like phenotypes in NrasG12D/+ mice. Control (C; Vav-Cre), Asxl1−/− (Asxl1−/−), NrasG12D/+ (Nras), and NrasG12D/+;Asxl1−/− (NA) mice were euthanized at age 6 weeks. Quantification of (A) spleen weight, (B) white blood cells (WBCs) in peripheral blood, and (C) numbers of monocytes and neutrophils in peripheral blood. (D-E) Frequencies and absolute numbers of (D) LSK cells and (E) MP cells in bone marrow (BM; including femurs and tibias) and spleen (SP). (F-G) Cell cycle analysis of (F) LSK cells and (G) MP cells from bone marrow using Ki67 and 4′,6-diamidino-2-phenylindole (DAPI). (H) A total of 5 × 10⁴ bone marrow cells were plated in duplicate and cultured in semisolid medium with or without granulocyte-macrophage colony-stimulating factor (GM-CSF) or interleukin-3 (IL-3). Colony numbers were counted after 7 days in culture. (I) Bone marrow cells were serum- and cytokine-starved for 2 hours at 37°C. Cells were then stimulated with or without 2 ng/mL of murine GM-CSF for 10 minutes at 37°C. Levels of pERK1/2 were measured using phospho-flow cytometry in Lin–/lowc-Kit+ cells. Data are presented as mean + standard deviation (SD). *P < .05; **P < .01; ***P < .001.
We analyzed HSC-enriched Lin–Sca1+cKit+ (LSK) cells and myeloid progenitors (MPs). Despite comparable LSK and MP compartments to control (Figure 2D-E), Asxl1−/− LSK and MP cells showed decreased percentages at G0 phase with a corresponding increase in G1 (LSK cells) or G2/S/M (MP) phase (Figure 2F-G). Consistent with previous reports,20,26 both LSK and MP compartments were expanded in NrasG12D/+ mice and further expanded in NA mice (Figure 2D-E). NA LSK and MP cells showed increased percentages in G0 phase, suggesting an increased number of quiescent cells (Figure 2F-G). When plated in semisolid culture, as we previously showed,10,11NrasG12D/+ cells formed spontaneous colonies in the absence of cytokines and increased numbers of colonies in the presence of interleukin-3 (IL-3) or granulocyte-macrophage colony-stimulating factor compared with controls (Figure 2H). In the absence or presence of cytokines, colony numbers were further increased in NA cells. Corroborating the colony assay results, phosphorylated ERK (pERK) levels in NrasG12D/+ and NA Lin–cKit+ cells were higher at the basal level (without cytokines) and upon stimulation with granulocyte-macrophage colony-stimulating factor (Figure 2I).
We continuously monitored all the cohorts of mice for monocytosis, a phenotypic hallmark of CMML. Asxl1−/− mice did not manifest any detectable monocytosis up to age 42 weeks, whereas NrasG12D/+ and NA mice developed monocytosis (defined as absolute monocyte number in peripheral blood above threefold the average of controls) over time (Figure 3A). In general, NA mice displayed a sharp increase in monocyte numbers, and they reached the moribund stage at a faster rate than NrasG12D/+ mice. Not surprisingly, NA mice had a significantly shortened survival compared with NrasG12D/+ mice (50% survival: 218 vs 405 days) (Figure 3B). Of note, the survival of NrasG12D/+ vs Asxl1−/− mice does not correlate with that of ASXL1WT;NRASMT vs ASXL1MT;NRASWT patients with CMML because the survival of these patients may be influenced by additional genetic mutations. All of the NrasG12D/+ mice died with a CMML-like disease that was characterized by splenome-galy, leukocytosis, anemia, low platelet number, and monocytosis (Figure 3C-G). By contrast, half the NA mice died with CMML-like phenotypes (NA-CMML) compared with NrasG12D/+ mice, whereas the other half died as a result of CMML with pathologic evidence of AML transformation (NA-AML) (Figure 3G). NA-AML was characterized by the presence of sheets of undifferentiated blast cells in the spleen and liver that were absent in NrasG12D/+ and NA-CMML mice (Figure 3H; data not shown). These blast cells often displayed a Mac1+cKit+ immunophenotype (Figure 3I). Upon transplantation, NA-CMML cells re-established CMML-like phenotypes after a prolonged latency (50% survival; 342 days) as we previously reported,20 whereas recipients with NA-AML cells died within 3 weeks with monocytic AML-like phenotypes (Figure 3J).
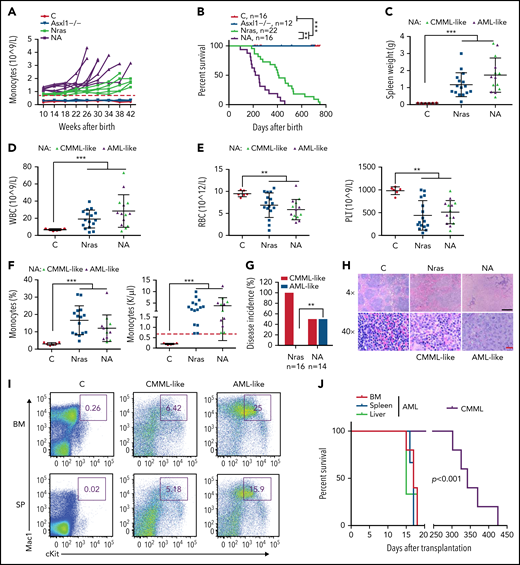
Asxl1−/− co-operates with NrasG12D/+ to promote CMML progression and AML transformation. (A) The absolute numbers of monocytes in peripheral blood of control (Vav-Cre), Asxl1−/−, Nras, and NA mice were monitored regularly. Monocytosis (red dash line) is defined as threefold over the average number of control monocytes. (B) Kaplan-Meier survival curves were plotted against days after birth. P values were determined using the log-rank test. (C-I) Moribund Nras and NA mice and age-matched control mice were analyzed. (C-F) Quantification of (C) spleen weight, (D) numbers of WBCs, (E) numbers of red blood cells (RBCs), and platelets (PLT), and (F) frequencies and numbers of monocytes in peripheral blood. Green triangles: NA mice with CMML; purple triangles, NA mice with AML. Red dashed line (F) indicates monocytosis as described above. (G) Quantification of disease incidence (χ2 analysis). (H) Representative spleen hematoxylin and eosin–stained sections from Control, Nras, and NA mice. Black scale bar, 500 μm; red scale bar, 20 μm. (I) Mac1 and c-Kit analysis of bone marrow and spleen cells from control and NA mice with CMML-like or AML-like disease. (J) Malignant cells from moribund NA mice with CMML-like or AML-like disease were transplanted into sublethally irradiated recipient mice (CD45.1+). Kaplan-Meier survival curves were plotted against days after transplantation. P values were determined using the log-rank test. Data are presented as mean + SD. *P < .05; **P < .01; ***P < .001.
Asxl1−/− co-operates with NrasG12D/+ to promote CMML progression and AML transformation. (A) The absolute numbers of monocytes in peripheral blood of control (Vav-Cre), Asxl1−/−, Nras, and NA mice were monitored regularly. Monocytosis (red dash line) is defined as threefold over the average number of control monocytes. (B) Kaplan-Meier survival curves were plotted against days after birth. P values were determined using the log-rank test. (C-I) Moribund Nras and NA mice and age-matched control mice were analyzed. (C-F) Quantification of (C) spleen weight, (D) numbers of WBCs, (E) numbers of red blood cells (RBCs), and platelets (PLT), and (F) frequencies and numbers of monocytes in peripheral blood. Green triangles: NA mice with CMML; purple triangles, NA mice with AML. Red dashed line (F) indicates monocytosis as described above. (G) Quantification of disease incidence (χ2 analysis). (H) Representative spleen hematoxylin and eosin–stained sections from Control, Nras, and NA mice. Black scale bar, 500 μm; red scale bar, 20 μm. (I) Mac1 and c-Kit analysis of bone marrow and spleen cells from control and NA mice with CMML-like or AML-like disease. (J) Malignant cells from moribund NA mice with CMML-like or AML-like disease were transplanted into sublethally irradiated recipient mice (CD45.1+). Kaplan-Meier survival curves were plotted against days after transplantation. P values were determined using the log-rank test. Data are presented as mean + SD. *P < .05; **P < .01; ***P < .001.
The phenotypic heterogeneity in NA mice suggests that additional genetic mutations were acquired during disease development. To identify these mutations, we performed WES analysis in 4 independent NA-CMML samples and 6 independent NA-AML samples with their corresponding tail samples as non-leukemia controls. Although numerous genes were recurrently mutated (nonsynonymous or frameshift mutations) in NA-CMML (41 in 3 or more NA-CMML samples; supplemental Figure 3A) and/or NA-AML (12 in 4 or more NA-AML samples; supplemental Figure 4A), their orthologs were rarely mutated in human CMML (n = 174) (supplemental Figure 3A), de novo AML (supplemental Figure 4A), or CMML-transformed AML (n = 36) (supplemental Figure 4A). Interestingly, in all of the patient samples with mutated ortholog genes, they simultaneously carried Ras pathway and/or ASXL1/2 mutations (S.N., unpublished data). We performed Gene Ontology analysis of the recurrently mutated genes. We found that the recurrently mutated genes in NA-CMML (≥2 of 4 in NA-CMML) are mainly enriched in Ras signaling, epigenetic regulation, and cell-cell interaction (supplemental Figure 3B), whereas the recurrently mutated genes in NA-AML (≥3 of 6 in NA-AML) are involved in cytoskeleton and cell cycle regulation (supplemental Figure 4B). Interestingly, the spectrum of mutated genes in NA-CMML was largely distinct from that in NA-AML (supplemental Figure 4C).
RNA-seq analysis identifies aberrant regulation of the immune system and upregulation of AP-1 complex genes associated with NA-AML
To investigate the molecular mechanisms underlying CMML progression and transformation to AML in NA mice, we performed RNA sequencing (RNA-seq) analysis using Lin–cKit+ cells from moribund NA-CMML and NA-AML mice and age-matched control, Asxl1−/−, and NrasG12D/+ mice (n = 3 in each group) (Figure 4). Of note, in this study, Asxl1−/− mice did not show monocytosis, whereas NrasG12D/+ mice developed sustained monocytosis. We identified a total of 298 differentially expressed genes (DEGs) (fold change >2 and false discovery rate <0.05) in NA-CMML vs control (93 were downregulated and 205 were upregulated) (Figure 4A). These gene transcriptional changes were partially displayed in Asxl1−/− and/or NrasG12D/+ cells, suggesting that the NA-CMML gene signature largely resulted from additive effects of both genetic mutations. Gene Ontology analysis and gene set enrichment analysis identified that gene signatures associated with MAPK cascade and immune response were enriched in NA-CMML cells (Figure 4B-C). We then compared the DEGs in NA-CMML with those in Asxl1−/− and NrasG12D/+ cells and found that Flt3 was uniquely upregulated in NA-CMML cells (Figure 4D). The gene signatures enriched in NA-CMML and FLT3 upregulation were also observed in human CMML with concurrent NRAS and ASXL1 mutations compared with controsl (supplemental Figure 5).
![RNA-seq analysis identifies aberrant regulation of immune system and upregulation of AP-1 complex genes associated with NrasG12D/+;Asxl1−/− AML. Lin–c-Kit+ cells were sorted from moribund NA mice with CMML (NA-CMML) or AML (NA-AML) and age-matched controls (Vav-Cre), Asxl1−/−, and Nras mice for RNA-seq analysis. (A-D) RNA-seq analysis of NA-CMML cells. (A) Heatmap of DEGs in NA-CMML cells compared with control cells (fold change ≥2 and false discovery rate [FDR] <0.05). (B) Gene Ontology (GO) analysis of DEGs in NA-CMML cells. The representative biological processes are shown with numbers of genes in each category and corresponding FDR in parentheses. (C) Gene set enrichment analysis (GSEA) identified dysregulated gene signatures in NA-CMML vs control. (D) Venn diagrams of up- or downregulated DEGs among NA-CMML, Nras, and Asxl1−/− cells. (E-J) RNA-seq analysis of NA-AML cells. (E) Heatmap of DEGs in NA-AML cells compared with control cells (fold change ≥2; FDR <0.05). (F) GO analysis of DEGs in NA-AML cells. The representative biological processes are shown with numbers of genes in each category and corresponding FDR in parentheses. (G) GSEA identified dysregulated gene signatures in NA-AML vs control. (H) Venn diagrams of up- or downregulated DEGs among NA-AML, Nras, and Asxl1−/− cells. (I) Volcano plot illustrating DEGs in NA-AML vs control, highlighting AP-1 complex genes and Flt3. (J) Quantification of AP-1 complex genes (Fos, Fosb, Jun, Junb, Jund, and Atf3) and Flt3 messenger RNA (mRNA) levels using quantitative reverse transcriptase polymerase chain reaction (qRT-PCR) in sorted Lin–c-Kit+ cells (n = 5 in each group). Data are presented as mean + SD. *P < .05; **P < .01; ***P < .001. NES, normalized enrichment score.](https://ash.silverchair-cdn.com/ash/content_public/journal/blood/139/7/10.1182_blood.2021012519/5/m_bloodbld2021012519f4.png?Expires=1769941281&Signature=g5ZYeEhdufPZXrYXZ9xOL0iKyauzTNmw-bE38bXiDpfeUpAADw5XVUqdPmQ50k00pakuOmCuJbU~q-J~~SwAsiLNhJnqjDKhb-HRcfhyGtMjjoTpp75SQX8aI8mKUp46xiGQZL~31fCBED~AN4e~jZzFRFVpDf9r7JfXbd2SSu58l855PXW0ZOpW2xwpooFnJ0UPwJBI4WZXl8Z-uOIAQf-BPn3xyBRH2uCR75El6KZbQfu4N~m7~5CZfrkWnkzL~5zWkE5Rd6LwSHutuRhqs-bLtQjsOYKknBrLzpVJS-sAXGDs1OETnWdNZjmW5x8glu~ohOvYUyAI2S5jHCq0zw__&Key-Pair-Id=APKAIE5G5CRDK6RD3PGA)
RNA-seq analysis identifies aberrant regulation of immune system and upregulation of AP-1 complex genes associated with NrasG12D/+;Asxl1−/− AML. Lin–c-Kit+ cells were sorted from moribund NA mice with CMML (NA-CMML) or AML (NA-AML) and age-matched controls (Vav-Cre), Asxl1−/−, and Nras mice for RNA-seq analysis. (A-D) RNA-seq analysis of NA-CMML cells. (A) Heatmap of DEGs in NA-CMML cells compared with control cells (fold change ≥2 and false discovery rate [FDR] <0.05). (B) Gene Ontology (GO) analysis of DEGs in NA-CMML cells. The representative biological processes are shown with numbers of genes in each category and corresponding FDR in parentheses. (C) Gene set enrichment analysis (GSEA) identified dysregulated gene signatures in NA-CMML vs control. (D) Venn diagrams of up- or downregulated DEGs among NA-CMML, Nras, and Asxl1−/− cells. (E-J) RNA-seq analysis of NA-AML cells. (E) Heatmap of DEGs in NA-AML cells compared with control cells (fold change ≥2; FDR <0.05). (F) GO analysis of DEGs in NA-AML cells. The representative biological processes are shown with numbers of genes in each category and corresponding FDR in parentheses. (G) GSEA identified dysregulated gene signatures in NA-AML vs control. (H) Venn diagrams of up- or downregulated DEGs among NA-AML, Nras, and Asxl1−/− cells. (I) Volcano plot illustrating DEGs in NA-AML vs control, highlighting AP-1 complex genes and Flt3. (J) Quantification of AP-1 complex genes (Fos, Fosb, Jun, Junb, Jund, and Atf3) and Flt3 messenger RNA (mRNA) levels using quantitative reverse transcriptase polymerase chain reaction (qRT-PCR) in sorted Lin–c-Kit+ cells (n = 5 in each group). Data are presented as mean + SD. *P < .05; **P < .01; ***P < .001. NES, normalized enrichment score.
RNA-seq analysis identifies aberrant regulation of immune system and upregulation of AP-1 complex genes associated with NrasG12D/+;Asxl1−/− AML. Lin–c-Kit+ cells were sorted from moribund NA mice with CMML (NA-CMML) or AML (NA-AML) and age-matched controls (Vav-Cre), Asxl1−/−, and Nras mice for RNA-seq analysis. (A-D) RNA-seq analysis of NA-CMML cells. (A) Heatmap of DEGs in NA-CMML cells compared with control cells (fold change ≥2 and false discovery rate [FDR] <0.05). (B) Gene Ontology (GO) analysis of DEGs in NA-CMML cells. The representative biological processes are shown with numbers of genes in each category and corresponding FDR in parentheses. (C) Gene set enrichment analysis (GSEA) identified dysregulated gene signatures in NA-CMML vs control. (D) Venn diagrams of up- or downregulated DEGs among NA-CMML, Nras, and Asxl1−/− cells. (E-J) RNA-seq analysis of NA-AML cells. (E) Heatmap of DEGs in NA-AML cells compared with control cells (fold change ≥2; FDR <0.05). (F) GO analysis of DEGs in NA-AML cells. The representative biological processes are shown with numbers of genes in each category and corresponding FDR in parentheses. (G) GSEA identified dysregulated gene signatures in NA-AML vs control. (H) Venn diagrams of up- or downregulated DEGs among NA-AML, Nras, and Asxl1−/− cells. (I) Volcano plot illustrating DEGs in NA-AML vs control, highlighting AP-1 complex genes and Flt3. (J) Quantification of AP-1 complex genes (Fos, Fosb, Jun, Junb, Jund, and Atf3) and Flt3 messenger RNA (mRNA) levels using quantitative reverse transcriptase polymerase chain reaction (qRT-PCR) in sorted Lin–c-Kit+ cells (n = 5 in each group). Data are presented as mean + SD. *P < .05; **P < .01; ***P < .001. NES, normalized enrichment score.
We identified a total of 844 DEGs (fold change >2 and false discovery rate <0.05) in NA-AML compared with controls (329 were downregulated and 515 were upregulated) (Figure 4E). Similar to NA-CMML, NA-AML gene signatures largely reflected additive effects from both Asxl1−/− and NrasG12D/+. Gene signatures associated with MAPK cascade and immune response were enriched in NA-AML cells (Figure 4F-G). Flt3 was also upregulated in NA-AML cells (Figure 4H). We validated Flt3 upregulation in NA-AML cells by using quantitative reverse transcriptase polymerase chain reaction (Figure 4J) and flow cytometry (supplemental Figure 6). Because Flt3 was upregulated in both NA-CMML and NA-AML cells, we tested whether these cells are more sensitive to Flt3 Type I and/or Type II inhibitors than control bone marrow cells are (supplemental Figure 7). Interestingly, other than the differential response to quizartinib (a Type II Flt3 inhibitor) between control and NA-AML cells in 1- to 5-μM concentrations, the response of NA-CMML and NA-AML cells to the Flt3 inhibitors was indistinguishable from that of control cells. These data suggest that despite Flt3 upregulation, inhibiting Flt3 is not a viable therapeutic strategy in NA leukemia. In addition to the common features shared between NA-CMML and NA-AML cells, we found that the AP-1 oncotranscriptome was enriched in NA-AML cells (Figure 4G), which was associated with upregulation of several AP-1 TFs, including Fos, Fosb, Jun, Junb, Jund, and Atf3 (Figure 4H-J). Our data suggest that upregulation of Flt3 and AP-1 TFs as well as dysregulation of the immune system may promote CMML progression and transformation to AML.
AP-1 TF Jun regulates expression of PD-L1 and CD86 and contributes to the suppressive immune microenvironment in NA-AML mice
We surveyed the known immune checkpoint pathways to determine whether the immune microenvironment was altered in NA mice. In NA-AML mice, a higher percentage of bone marrow Mac1+cKit+ cells expressed the inhibitory immune checkpoint ligands, including programmed death-ligand 1 (PD-L1)/PD-L2, CD155, CD80, and CD86 (Figure 5A). In contrast, NA-CMML cells demonstrated increased expression of only CD155 and CD80 compared with control cells, whereas age-matched Asxl1−/− and NrasG12D/+ cells were comparable to control cells. We further explored the potential mechanisms regulating the expression of these ligands. We mined the ENCODE database for the chromatin immunoprecipitation sequencing data for histone marks and AP-1 TFs in K562 cells, a human AML cell line. Consistent with our flow analysis, both PD-L1 and CD86 loci show AP-1 TF binding at the potential enhancers (supplemental Figure 8A). These binding sites are conserved in mouse lymphoma CH12 cells as well (supplemental Figure 8B), suggesting that PD-L1 and CD86 may be upregulated via AP-1 TFs downstream of hyperactivated Ras/MEK/ERK signaling. To test this idea, we first performed chromatin immunoprecipitation sequencing-quantitative polymerase chain reaction at the Jun binding sites of the PD-L1 and CD86 loci. Only NA-AML cells showed significant enrichment of Jun binding at these 2 gene loci (Figure 5B). Downregulating Jun expression by short hairpin Jun (shJun) lentiviral constructs led to reduced PD-L1 and CD86 messenger RNA levels (Figure 5C) and surface expression (Figure 5D). Similarly, treating NA-AML cells with SR11302 (an AP-1 inhibitor)27,28 also resulted in decreased surface expression of PD-L1 and CD86 (Figure 5E). Together, our data demonstrated that AP-1 TF Jun regulates PD-L1 and CD86 expression in NA-AML cells.
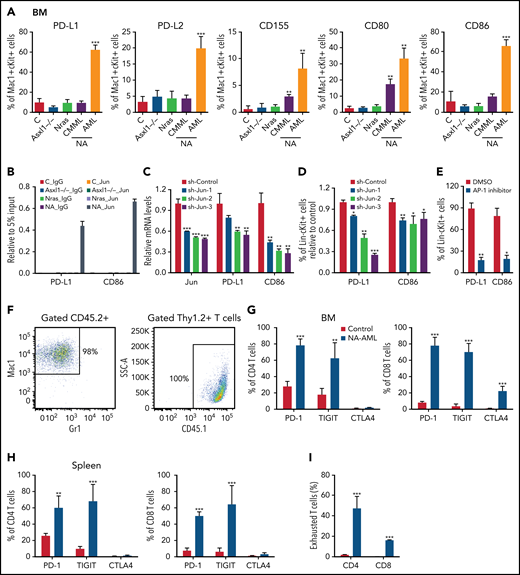
AP-1 TF Jun regulates PD-L1 and CD86 expression and contributes to the suppressive immune microenvironment in NA-AML mice. (A) Quantification of bone marrow Mac1+c-Kit+ cells expressing immune checkpoint ligands PD-L1/PD-L2, CD155, and CD80/CD86 in moribund NA mice with CMML (NA-CMML) or AML (NA-AML) and age-matched control (Vav-Cre), Asxl1−/−, and Nras mice. (B) Enrichment of Jun binding at PD-L1 and CD86 enhancer/promoter regions was analyzed using chromatin immunoprecipitation (ChIP)-qPCR in bone marrow cells of moribund NA-AML and age-matched controls, Asxl1−/−, and Nras mice. Immunoglobulin G (IgG) was used as a negative control. The enrichment was normalized to 5% input (n = 3). (C-D) NA-AML cells were cultured in vitro and infected with pGIPZ lentiviral vectors encoding short hairpin Control (shControl) or shJun. At 72 hours after infection, (C) mRNA levels of Jun, PD-L1, and CD86 were analyzed in sorted c-Kit+GFP+ cells using qRT-PCR, and (D) surface expression of PD-L1 and CD86 were analyzed in Lin–c-Kit+GFP+ cells using flow cytometry. (E) NA-AML cells were cultured in vitro and treated with dimethyl sulfoxide (DMSO) or 4 μΜ SR11302 (AP-1 inhibitor) for 5 days. Surface expression of PD-L1 and CD86 were analyzed in Lin–c-Kit+ cells using flow cytometry. (F-I) Sublethally irradiated mice were transplanted with 2.5 × 10⁵ bone marrow cells from moribund NA-AML mice or age-matched control mice. (F) In NA-AML recipients, donor-derived (CD45.2+) cells were exclusively Mac1+ leukemia cells, whereas T cells (Thy1.2+) were derived from the host (CD45.1+). (G-H) Quantification of (G) bone marrow and (H) spleen CD4 and CD8 T cells expressing immune checkpoint receptors PD-1, TIGIT, and CTLA4. (I) Quantification of exhausted T cells (PD-1+TIGIT+LAG3+) in spleen CD4 and CD8 T cells in NA-AML and control recipients. Data are presented as mean + SD. *P < .05; **P < .01; ***P < .001. SSC, side scatter.
AP-1 TF Jun regulates PD-L1 and CD86 expression and contributes to the suppressive immune microenvironment in NA-AML mice. (A) Quantification of bone marrow Mac1+c-Kit+ cells expressing immune checkpoint ligands PD-L1/PD-L2, CD155, and CD80/CD86 in moribund NA mice with CMML (NA-CMML) or AML (NA-AML) and age-matched control (Vav-Cre), Asxl1−/−, and Nras mice. (B) Enrichment of Jun binding at PD-L1 and CD86 enhancer/promoter regions was analyzed using chromatin immunoprecipitation (ChIP)-qPCR in bone marrow cells of moribund NA-AML and age-matched controls, Asxl1−/−, and Nras mice. Immunoglobulin G (IgG) was used as a negative control. The enrichment was normalized to 5% input (n = 3). (C-D) NA-AML cells were cultured in vitro and infected with pGIPZ lentiviral vectors encoding short hairpin Control (shControl) or shJun. At 72 hours after infection, (C) mRNA levels of Jun, PD-L1, and CD86 were analyzed in sorted c-Kit+GFP+ cells using qRT-PCR, and (D) surface expression of PD-L1 and CD86 were analyzed in Lin–c-Kit+GFP+ cells using flow cytometry. (E) NA-AML cells were cultured in vitro and treated with dimethyl sulfoxide (DMSO) or 4 μΜ SR11302 (AP-1 inhibitor) for 5 days. Surface expression of PD-L1 and CD86 were analyzed in Lin–c-Kit+ cells using flow cytometry. (F-I) Sublethally irradiated mice were transplanted with 2.5 × 10⁵ bone marrow cells from moribund NA-AML mice or age-matched control mice. (F) In NA-AML recipients, donor-derived (CD45.2+) cells were exclusively Mac1+ leukemia cells, whereas T cells (Thy1.2+) were derived from the host (CD45.1+). (G-H) Quantification of (G) bone marrow and (H) spleen CD4 and CD8 T cells expressing immune checkpoint receptors PD-1, TIGIT, and CTLA4. (I) Quantification of exhausted T cells (PD-1+TIGIT+LAG3+) in spleen CD4 and CD8 T cells in NA-AML and control recipients. Data are presented as mean + SD. *P < .05; **P < .01; ***P < .001. SSC, side scatter.
When bone marrow cells from primary NA-AML mice (CD45.2+) were transplanted into sublethally irradiated mice (CD45.1+), >98% of reconstituted donor cells were Mac1+ NA-AML cells, and T cells were derived exclusively from recipients (Figure 5F). This was in sharp contrast to recipients transplanted with control bone marrow cells, in which donor cells contributed to all lineages of hematopoietic cells (X.Y., unpublished data). Our results suggest that NA-derived T cells are defective compared with WT T cells. This is consistent with what we observed in patients with NA-CMML: NRAS and ASXL1 mutations are either not detectable or are underrepresented in their T cells (supplemental Table 1). Corresponding to the enhanced expression of inhibitory immune checkpoint ligands in NA-AML cells, a much higher percentage of bone marrow and spleen CD4 and CD8 T cells expressed the checkpoint receptors programmed cell death protein 1 (PD-1) and T-cell immunoreceptor with immunoglobulin and ITIM domains (TIGIT) in NA-AML recipients compared with recipients transplanted with control cells (Figure 5G-H). As expected, the percentages of exhausted T cells (PD-1+TIGIT+LAG3+) were increased in both CD4 and CD8 T-cell compartments (Figure 5I). Our results indicated that a suppressive immune microenvironment was established in NA-AML mice.
Combined inhibition of MEK and BET targets both leukemia cells and T cells and prolongs the survival of NA-AML recipients
Because Asxl1 is a known epigenetic regulator in histone modifications, we sought to examine various histone marks in splenocytes from young (6-8 weeks old) and old (28-30 weeks old) control, Asxl1−/−, NrasG12D/+, and NA mice. Consistent with the previous drosophila Asx study,1 we observed that global levels of H3K4me1, H3K4me3, and H3K27me3 were progressively lower in Asxl1−/− cells compared with control cells (Figure 6A). In NrasG12D/+ and NA cells, the H3K27ac levels were higher than that in controls whereas the levels of other histone marks were comparable to those in controls (Figure 6A). To determine whether H3K27ac levels correlated with transcriptional levels, we analyzed H3K27ac levels at several gene loci: Fos, Jun, Jund, PD-L1, and CD86 (supplemental Figure 9A). Despite the comparable global H3K27ac levels, H3K27ac levels at most of the gene loci we tested were significantly higher in Asxl1−/− cells compared with control cells. However, the H3K27ac levels did not correlate with the transcriptional levels of these genes (supplemental Figure 9B).
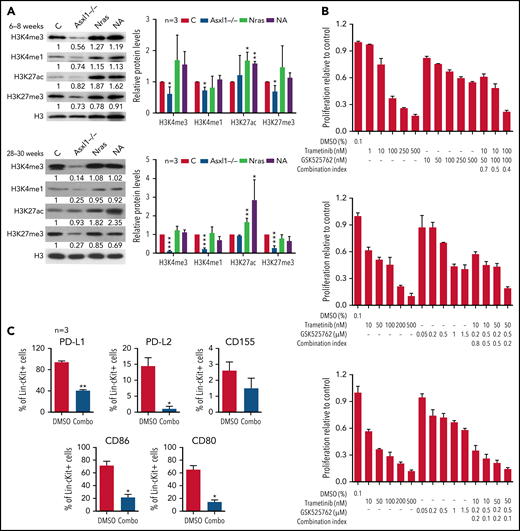
Combined inhibition of MEK and BET downregulates surface expression of inhibitory immune checkpoint ligands and inhibits NrasG12D/+;Asxl1−/− AML cell growth in vitro. (A) Expression levels of H3K4me3, H3K4me1, H3K27ac, H3K27me3, and total H3 in bone marrow cells from age 6 to 8 weeks or age 28 to 30 weeks controls (C), Asxl1−/−, Nras, and NA mice were analyzed using western blot. (B) NA-AML cells were cultured in triplicate in 96-well plates in the presence of DMSO or various concentrations of trametinib and/or GSK525762 for 7 days. Cell proliferation was quantified using the CellTiter-Glo assay. Combination Index was calculated using a CompuSyn algorithm. An index value <1 indicates synergism. (C) NA-AML cells were cultured in vitro and treated with DMSO or trametinib and GSK525762 (combined) for 5 days. Surface expression of PD-L1, PD-L2, CD155, CD86, and CD80 were analyzed in Lin–c-Kit+ cells using flow cytometry. Data are presented as mean + SD. *P < .05; **P < .01; ***P < .001.
Combined inhibition of MEK and BET downregulates surface expression of inhibitory immune checkpoint ligands and inhibits NrasG12D/+;Asxl1−/− AML cell growth in vitro. (A) Expression levels of H3K4me3, H3K4me1, H3K27ac, H3K27me3, and total H3 in bone marrow cells from age 6 to 8 weeks or age 28 to 30 weeks controls (C), Asxl1−/−, Nras, and NA mice were analyzed using western blot. (B) NA-AML cells were cultured in triplicate in 96-well plates in the presence of DMSO or various concentrations of trametinib and/or GSK525762 for 7 days. Cell proliferation was quantified using the CellTiter-Glo assay. Combination Index was calculated using a CompuSyn algorithm. An index value <1 indicates synergism. (C) NA-AML cells were cultured in vitro and treated with DMSO or trametinib and GSK525762 (combined) for 5 days. Surface expression of PD-L1, PD-L2, CD155, CD86, and CD80 were analyzed in Lin–c-Kit+ cells using flow cytometry. Data are presented as mean + SD. *P < .05; **P < .01; ***P < .001.
Because increased H3K27ac levels may result in enhanced binding of BET proteins to this histone mark and confer the sensiti-vity of cancer cells to BET inhibitors,29 we tested whether NA-AML cells were sensitive to MEK and/or BET inhibition in vitro. Primary NA-AML cells were cultured in the presence of various concentrations of trametinib, an MEK inhibitor approved by the US Food and Drug Administration for treating melanoma,30 and GSK525762, a pan-BET inhibitor under preclinical development.31 Trametinib demonstrated a more potent growth inhibition function than GSK525762 (50% inhibitory concentration: 10-100 nM vs >500 nM), whereas treatment with the combined agents seemed to be more effective than treatment with either as a single agent (Figure 6B). We also tested CMML cells from NrasG12D/+ and NA mice, and their behavior was similar to that of NA-AML cells (supplemental Figure 10). In addition, the combined treatment downregulated surface expression of multiple inhibitory checkpoint ligands, including PD-L1/PD-L2 and CD80/CD86 (Figure 6C). Our data suggest that the combined inhibition of MEK and BET not only inhibits NA-AML cell growth directly but may also alleviate the suppressive immune microenvironment.
We further validated this combination treatment in vivo. NA-AML cells were transplanted into sublethally irradiated recipients. Two weeks posttransplant, the recipients were randomly separated into 2 groups and treated with vehicle or trametinib and GSK525762 combined. After ∼3 weeks of treatment, all the mice treated with vehicle became moribund. We euthanized all the recipients and analyzed their disease phenotypes. Compared with vehicle-treated mice, recipients treated with both MEK and BET inhibitors displayed much less leukemia burden, including reduced hepatosplenomegaly (Figure 7A), reduced size of leukemia cell nodules in bone marrow, spleen, and liver, and elimination of AML cell infiltration to the lungs (supplemental Figure 11A). Associated with alleviated leukemia phenotypes in combo treated recipients, percentages of leukemia cells expressing PD-L1 and CD80/86 were reduced in bone marrow (Figure 7B), spleen, and liver (supplemental Figure 11B). Percentages of CD4 and CD8 T cells expressing PD-1 and TIGIT were also decreased in bone marrow (Figure 7C), spleen, and liver (supplemental Figure 11C). The reduced expression of inhibitory immune checkpoint receptors on T cells was associated with reduced percentages of exhausted T cells and a corresponding increase of both CD4 and CD8 T cells in the spleen (Figure 7D). To determine whether combination treatment enhances the cytotoxicity of CD8 T cells, we sorted NA-AML cells (target) from vehicle-treated mice and cultured them with splenic CD8 T cells (effector) isolated from vehicle- or drug-treated mice (Figure 7E). We found that coculture with CD8 T cells led to a reduced number of NA-AML cells. More importantly, CD8 T cells from drug-treated mice displayed more potent anti-leukemia activity than those from vehicle-treated mice, indicating that combination treatment indeed improved CD8 T cell cytotoxicity. In addition, the combination treatment led to reduced expression of Flt3 and AP-1 TFs (Figure 7F) and downregulated global H3K27ac levels (supplemental Figure 12) in sorted leukemia cells. As expected, combined inhibition of MEK and BET prolonged the survival of NA-AML recipients and their effect as a combination was better than that of single-agent treatments (Figure 7G-H). In immunodeficient NSGS mice xenografted with human RAS;ASXL1 CMML cells, combination treatment moderately but significantly prolonged their survival as well (Figure 7I). Together, our results demonstrated that combined inhibition of MEK and BET alleviated all the oncogenic events we identified, including upregulation of Flt3, AP-1 TFs, and the suppressive immune microenvironment, and prolonged the survival of NA-AML mice.

Combined inhibition of MEK and BET downregulates inhibitory immune checkpoint pathways and AML transformation gene signature and prolongs the survival of NrasG12D/+;Asxl1−/− AML mice. Sublethally irradiated mice (CD45.1+) were transplanted with 2.5 × 10⁵ bone marrow cells from moribund primary NA-AML recipients. Two weeks after transplantation, mice were randomly separated into (A-G) 2 groups and treated with vehicle (Veh) or a combination (Combo) of trametinib and GSK525762 once per day or (H) 4 groups treated with vehicle, trametinib (Tra), and/or GSK525762 (GSK) once per day. (A-F) Recipients were euthanized at ∼5 weeks posttransplant. Quantification of (A) spleen and liver weights; (B) bone marrow leukemia cells (CD45.2+) expressing PD-L1, CD86, CD80, PD-L2, or CD155 using flow cytometry; (C) bone marrow CD4 and CD8 T cells expressing PD-1, TIGIT, or CTLA-4; and (D) exhausted T cells (PD-1+TIGIT+LAG3+) in spleen CD4 and CD8 T cells. (E) T-cell cytotoxicity assay. CD45.2+ leukemia cells (Target) were sorted from moribund NA-AML recipients treated with vehicle. The same number of Target cells were cocultured with splenic CD8 T cells (Effector), which were sorted from recipients treated with vehicle (Veh) or combination (Com) of drugs at different ratios. The live leukemia cells were quantified 48 hours after coculture. (F) Quantification of AP-1 complex genes (Fos, Fosb, Jun, Junb, Jund, and Atf3) and Flt3 mRNA levels using qRT-PCR in sorted leukemia cells (CD45.2+). (G-H) Kaplan-Meier survival curves were plotted against days after transplantation using NA-AML cells from different donors. (I) 1.78 million bone marrow mononuclear cells from a RAS and ASXL1 double-mutant CMML patient were transplanted into irradiated NRGS mice (n = 4 mice per group). Five days after transplantation, mice were randomly separated into 2 groups and treated with vehicle or trametinib plus GSK525762 until moribund stage as described in “Materials and methods.” Kaplan-Meier survival curves were plotted against days after transplantation. (G-I) Data are presented as mean + SD. P values were determined using the log-rank test. *P < .05; **P < .01; ***P < .001.
Combined inhibition of MEK and BET downregulates inhibitory immune checkpoint pathways and AML transformation gene signature and prolongs the survival of NrasG12D/+;Asxl1−/− AML mice. Sublethally irradiated mice (CD45.1+) were transplanted with 2.5 × 10⁵ bone marrow cells from moribund primary NA-AML recipients. Two weeks after transplantation, mice were randomly separated into (A-G) 2 groups and treated with vehicle (Veh) or a combination (Combo) of trametinib and GSK525762 once per day or (H) 4 groups treated with vehicle, trametinib (Tra), and/or GSK525762 (GSK) once per day. (A-F) Recipients were euthanized at ∼5 weeks posttransplant. Quantification of (A) spleen and liver weights; (B) bone marrow leukemia cells (CD45.2+) expressing PD-L1, CD86, CD80, PD-L2, or CD155 using flow cytometry; (C) bone marrow CD4 and CD8 T cells expressing PD-1, TIGIT, or CTLA-4; and (D) exhausted T cells (PD-1+TIGIT+LAG3+) in spleen CD4 and CD8 T cells. (E) T-cell cytotoxicity assay. CD45.2+ leukemia cells (Target) were sorted from moribund NA-AML recipients treated with vehicle. The same number of Target cells were cocultured with splenic CD8 T cells (Effector), which were sorted from recipients treated with vehicle (Veh) or combination (Com) of drugs at different ratios. The live leukemia cells were quantified 48 hours after coculture. (F) Quantification of AP-1 complex genes (Fos, Fosb, Jun, Junb, Jund, and Atf3) and Flt3 mRNA levels using qRT-PCR in sorted leukemia cells (CD45.2+). (G-H) Kaplan-Meier survival curves were plotted against days after transplantation using NA-AML cells from different donors. (I) 1.78 million bone marrow mononuclear cells from a RAS and ASXL1 double-mutant CMML patient were transplanted into irradiated NRGS mice (n = 4 mice per group). Five days after transplantation, mice were randomly separated into 2 groups and treated with vehicle or trametinib plus GSK525762 until moribund stage as described in “Materials and methods.” Kaplan-Meier survival curves were plotted against days after transplantation. (G-I) Data are presented as mean + SD. P values were determined using the log-rank test. *P < .05; **P < .01; ***P < .001.
Discussion
In this study, we generated and characterized a novel NA model that is distinct from NrasG12D/+;Ezh2−/−32 and Nf1+/−;Asxl1+/− models33 in spite of the fact that they share common genetic mutations. Phenotypically, all the NrasG12D/+;Ezh2−/− mice developed myeloproliferative neoplasms (MPNs), closely resembling advanced primary myelofibrosis, and half the mice displayed leukemic transformation consistent with post-MPN leukemias or blast-phase MPNs.32 Approximately 50% of Nf1+/−;Asxl1+/− mice developed mixed MPN/myelodysplastic syndrome, ∼25% developed MPN or myelodysplastic syndrome, and the remaining mice developed myeloid leukemia.33 By contrast, all the NA mice developed a CMML-like disease and half of them progressed to AML (Figure 3). At the molecular level, in the NrasG12D/+;Ezh2−/− model,32Ezh2 loss cooperated with oncogenic Nras to reactivate BCAT1 and enhance branched-chain amino acid metabolism. In the Nf1+/−;Asxl1+/− model,33 MYC and BRD9 transcription programs were hyperactivated and were associated with increased H3K4me3 levels at the promoter regions of these genes. By contrast, we found that BCAT1 and BCAA metabolism were not upregulated in the NA model and the NA-induced DEGs did not overlap with those identified in the Nf1+/−;Asxl1+/− model (data not shown). Instead, we demonstrated upregulation of the AP-1 oncotranscriptome and establishment of a suppressive immune microenvironment in NA-AML mice. Although the function of mammalian Asxl1 was initially proposed to be mainly through its interaction with PRC2 key components (eg, Ezh2),3,18 the data from the NrasG12D/+;Ezh2−/− model and NA mice clearly demonstrated a PRC2-independent function of Asxl1 in oncogenic Nras-driven myeloid leukemias.
We identified several mechanisms that may contribute to accelerated NA-CMML and/or transformation to NA-AML. First, Flt3 upregulation, reflected on expansion of Flt3+ hematopoietic stem and progenitor cells and overexpression on their cell surface (supplemental Figure 6), was associated with NA-CMML (Figure 4D) and NA-AML (Figure 4H,J) in mice and NA-CMML in humans (supplemental Figure 5). Because Flt3 messenger RNA levels in Asxl1−/− and NrasG12D/+ cells were comparable to that in control cells (Figure 4J), Flt3 upregulation in NA-AML cells likely resulted from the synergism of both mutations. Conceivably, overexpression of Flt3 (a receptor-like tyrosine kinase) may promote hyperactivation of WT Ras proteins and further enhance the downstream MEK/ERK signaling. This is consistent with a previous report that overexpression of receptor-like tyrosine kinases on the cell surface leads to signaling rebound and adaptive resistance to trametinib.34 Because Flt3 upregulation was absent in Nras-induced CMML (Figure 4D,H) and its downregulation was associated with the prolonged survival of NA mice upon combinatorial treatment (Figure 7F-H), we believe that this event contributes to the accelerated CMML development in NA mice. However, both NA-CMML and NA-AML cells responded to Flt3 inhibitors in a manner largely comparable to that of control bone marrow cells (supplemental Figure 7), suggesting that once leukemia is established, NA cells may not depend on Flt3 for survival.
Second, overexpression of AP-1 TFs, mediated by the additive or synergistic effects of NrasG12D/+ and Asxl1−/− (Figure 4J), is particularly associated with NA-AML but not NA-CMML (Figure 4D,H). Consistent with our mouse data, we did not observe AP-1 overexpression in human NA-CMML samples either (data not shown). Of note, the AP-1 TFs form a prominent regulatory node in all the de novo AML subsets, and expression of a dominant negative form of AP-1 blocked FLT3-internal tandem duplication (FLT3-ITD) and t(8;21) AML in mice.35,36 Altogether, these data suggest that the AP-1–mediated oncotranscriptome drives both de novo and secondary AML (eg, CMML transformation to AML) formation. Consistent with this idea, combined inhibition of MEK and BET decreased the expression of AP-1 TFs and prolonged the survival of NA-AML mice (Figure 7F-H).
Third, we found that a suppressive immune microenvironment was established in NA-AML mice (Figure 5). All the inhibitory immune checkpoint ligands (PD-L1/PD-L2, CD155, and CD80/CD86) were overexpressed in the NA-AML cells. The ENCODE data (supplemental Figure 8), RNA-seq analysis (Figure 4), and combined drug treatment in vitro (Figure 6) and in vivo (Figure 7) suggest that the upregulation of PD-L1 and CD86 is likely mediated by the MEK/ERK/AP-1 pathway. Indeed, we showed that AP-1 TF Jun regulates PD-L1 and CD86 expression (Figure 5B-D), which contributes to the establishment of an inhibitory immune microenvironment in NA-AML mice. Jun-mediated PD-L1 overexpression was also reported in previous studies in solid tumors.37,38
Transplantation of NA-AML cells into sublethally irradiated mice established a suppressive immune microenvironment by inducing expression of inhibitory immune checkpoint receptors on host-derived T cells and a predominant exhausted T-cell phenotype (Figure 7). Treatment with combined drugs partially reversed the suppressive immune microenvironment, enhanced CD8 T-cell cytotoxicity, and prolonged the survival of NA-AML recipients (Figure 7). Thus, our data suggest that an altered immune microenvironment promotes leukemia progression and transformation in vivo. In support of this notion, drug treatment that either inhibits T-cell–mediated tumor killing activity (eg, ruxolitinib; X.Y., unpublished data) or was performed in immunodeficient mice (Figure 7I) exhibited no or moderate benefits. Together, our results provide a strong rationale for combining targeted therapies and immunotherapies to treat patients with CMML that transformed to AML with concurrent NRAS and ASXL1 mutations.
Acknowledgments
The authors thank the physicians of the Groupe Francophone des Myélodysplasies for providing samples from the French cohort and the University of Wisconsin Carbone Cancer Center for use of its Shared Services (Flow Cytometry Laboratory and Experimental Pathology Laboratory) to complete this research. They acknowledge the Henry J. Predolin Leukemia grant at the Mayo Clinic (Rochester, MN) for biobanking and molecular profiling of CMML samples.
This work was supported by grants from the National Institutes of Health, National Cancer Institute (R01 CA236356) (W.X.), (P01 CA108671) (R.L.L.), (R37 CA234021) (E.P.), (R01 CA152108) (J.Z.), and (P30 CA014520) (UW Carbone Comprehensive Cancer Center).
Authorship
Contribution: X.Y., F.L., M.B., and A.V. designed and performed the experiment and helped write and review the manuscript; T.L., Z.W., X.G., E.F., A.R., Y.Z., C.F., A.M., R.L., and G.K. provided technical support; E.A.R. analyzed the histopathology of mice; N.D., A.M.H., S.N., M.B., O.A.-W., R.L.L., B.W., K.V.G.N., D.Y., K.G., E.S., and W.X. provided material support and review the manuscript; and E.P., M.M.P., and J.Z. supervised the study, helped design the experiment, and helped write and review the manuscript.
Conflict-of-interest disclosure: O.A.-W. served as a consultant for H3B Biomedicine, Foundation Medicine, Merck, Prelude Therapeutics, and Janssen; is on the Scientific Advisory Board of Envisagenics, AIChemy, and Pfizer Boulder; and received previous research funding from H3B Biomedicine and LOXO Oncology unrelated to this manuscript. R.L.L. is on the supervisory board of QIAGEN and is a scientific advisor to Imago, Mission Bio, Zentalis, Ajax, Auron, Prelude, C4 Therapeutics, and Isoplexis; received research support from and has consulted for Celgene and Roche; has consulted for Incyte, Janssen, Astellas, Morphosys, and Novartis; and has received honoraria from Roche, Eli Lilly, and Amgen for invited lectures and from Gilead for grant reviews. The remaining authors declare no competing financial interests.
Correspondence: Eric Padron, Moffitt Cancer Center Magnolia Campus, 12902 University of South Florida Magnolia Dr, Tampa, FL 33612; e-mail: eric.padron@moffitt.org; Mrinal M. Patnaik, Mayo Clinic College of Medicine, 200 First St SW, Rochester, MN 55905; e-mail: patnaik.mrinal@mayo.edu; and Jing Zhang, University of Wisconsin School of Medicine and Public Health, Wisconsin Institutes for Medical Research Tower II, 7437, 1111 Highland Ave, Madison, WI 53705; e-mail: zhang@oncology.wisc.edu.
RNA-seq data have been deposited in the National Center for Biotechnology Information Sequence Read Archive under accession number PRJNA774277.
The online version of this article contains a data supplement.
The publication costs of this article were defrayed in part by page charge payment. Therefore, and solely to indicate this fact, this article is hereby marked “advertisement” in accordance with 18 USC section 1734.

This feature is available to Subscribers Only
Sign In or Create an Account Close Modal