

Key Points
14q32 rearrangements, activating BCL11B, provide a novel biomarker for a new entity among immature acute leukemias.

Abstract
Acute leukemias (ALs) of ambiguous lineage are a heterogeneous group of high-risk leukemias characterized by coexpression of myeloid and lymphoid markers. In this study, we identified a distinct subgroup of immature acute leukemias characterized by a broadly variable phenotype, covering acute myeloid leukemia (AML, M0 or M1), T/myeloid mixed-phenotype acute leukemia (T/M MPAL), and early T-cell precursor acute lymphoblastic leukemia (ETP-ALL). Rearrangements at 14q32/BCL11B are the cytogenetic hallmark of this entity. In our screening of 915 hematological malignancies, there were 202 AML and 333 T-cell acute lymphoblastic leukemias (T-ALL: 58, ETP; 178, non-ETP; 8, T/M MPAL; 89, not otherwise specified). We identified 20 cases of immature leukemias (4% of AML and 3.6% of T-ALL), harboring 4 types of 14q32/BCL11B translocations: t(2,14)(q22.3;q32) (n = 7), t(6;14)(q25.3;q32) (n = 9), t(7;14)(q21.2;q32) (n = 2), and t(8;14)(q24.2;q32) (n = 2). The t(2;14) produced a ZEB2-BCL11B fusion transcript, whereas the other 3 rearrangements displaced transcriptionally active enhancer sequences close to BCL11B without producing fusion genes. All translocations resulted in the activation of BCL11B, a regulator of T-cell differentiation associated with transcriptional corepressor complexes in mammalian cells. The expression of BCL11B behaved as a disease biomarker that was present at diagnosis, but not in remission. Deregulation of BCL11B co-occurred with variants at FLT3 and at epigenetic modulators, most frequently the DNMT3A, TET2, and/or WT1 genes. Transcriptome analysis identified a specific expression signature, with significant downregulation of BCL11B targets, and clearly separating BCL11B AL from AML, T-ALL, and ETP-ALL. Remarkably, an ex vivo drug-sensitivity profile identified a panel of compounds with effective antileukemic activity.
Introduction
The current World Health Organization (WHO) classification of acute leukemia (AL) has been guided by molecular-cytogenetic entities and their clinical impact. Recurrent molecular-cytogenetic rearrangements serve as both diagnostic markers and as independent prognostic factors for risk group assignment and treatment choice. However, heterogeneous subgroups of leukemia are lacking genetic characterization, with no clear evidence of differentiation into a single lineage. In addition, some have variable combinations of myeloid and T- or B-cell components (mixed phenotypes). These leukemias, defined by the WHO classification as acute leukemias of ambiguous lineage (ALALs), include acute undifferentiated leukemia, acute leukemias with ambiguous lineage, and mixed-phenotype acute leukemias (MPALs).1 So far, only 2 cytogenetic markers [t(9;22)(q34;q22)/BCR-ABL1 and KMT2A rearrangements], mainly associated with B/myeloid MPAL, have been incorporated to improve diagnosis and risk stratification.1 Notably, 2 recent studies have begun to elucidate the genetic basis of pediatric ALAL, and adult MPAL, identifying recurrent genetic and/or epigenetic events that overlap with those found in acute myeloid leukemia (AML) and B- or T-cell acute lymphoblastic leukemia (ALL).2,3
An additional WHO entity, termed early T-cell precursor ALL (ETP-ALL), is a subgroup of high-risk T-ALLs4,5 with very immature T progenitors that retain myeloid differentiation potential.6 ETP-ALL cases lack a unifying cytogenetic marker.7
In this study, we focused on 14q32 rearrangements involving BCL11B, a transcription factor interacting with the nucleosome remodeling and deacetylase (NuRD) complex,8,9 which is essential for T-cell development and for maintenance of T-cell identity.10,11 We found that 14q32 rearrangements that activate BCL11B are the hallmark of a leukemia entity, referred to herein as BCL11B-a (activated) AL, and characterized by expression of both myeloid and T-lymphoid antigens with a distinct transcriptomic profile.
Methods
Patients
Patients were recruited from the Hematology Departments, at the Universities of Perugia, Parma, and Bologna, Italy; Venezia-Mestre and Avellino Hospitals, Italy; the Centre for Human Genetics, University of Leuven, Belgium; and the Leukemia Research Cytogenetics Group, Translational and Clinical Research Institute Newcastle University Centre for Cancer, United Kingdom. All patients or their parents/guardians provided informed consent for sample collection and its use in approved research studies. This study was approved by the local bioethics committee (Bioethics Committees: University of Perugia, number 2014-0259; University of Leuven, number S53745; University Centre for Cancer, Newcastle-upon-Tyne, number 2007-004013-34; and Bioethics Committee of the Canton of Zurich, number 2014-0383). Molecular analyses were performed in agreement with the Declaration of Helsinki.
Cytogenetics, fluorescence in situ hybridization, reverse transcription polymerase chain reaction, and single-nucleotide polymorphism array
Conventional cytogenetic analysis was performed after G banding (supplemental Material, available on the Blood Web site). Fluorescence in situ hybridization (FISH) testing was performed to refine the 14q32 breakpoints and the breakpoints of chromosome partners, by using the DNA clones listed in supplemental Table 1. Reverse transcription polymerase chain reaction (RT-PCR) and western blot analysis were performed according to standard procedures (supplemental Material). Single-nucleotide polymorphism array (SNPa) analysis determined copy number variants (CNVs) and copy-neutral loss of heterozygosity (cnLOH; supplemental Material).
Quantitative RT-PCR
Quantitative RT-PCR was used to assess the expression of BCL11B, SPI1/PU.1, and ZEB2. Details are provided in the supplemental Material.
RNA sequencing
RNA sequencing (RNA-Seq) experiments are described in the supplemental Material. AML12 and T-ALL13 series, which were used as references, belong to the cBioPortal data sets14,15 (The Cancer Genome Atlas [TCGA] for AML and TARGET for T-ALL projects) and GDC Data Portal data sets16 (projects TCGA-LAML for AML and TARGET-ALL-P2 for T-ALL). Normalized counts from all BCL11B-a AL samples were used for differential expression and Gene Set Enrichment Analyses. See the supplemental Material for details.
Targeted sequencing and whole-exome sequencing
Gene variants were investigated by targeted sequencing with the Myeloid Solution SOPHiA Genetics (Saint‐Sulpice, Switzerland), which covers 30 relevant genes associated with myeloid hemopathies, and/or by whole-exome sequencing (supplemental Material). Sanger sequencing was used to validate next-generation sequencing (NGS) findings and to study hot-spot mutations in selected cases. Detailed procedures and analyses of the data are provided in the supplemental Material.
Drug sensitivity and resistance profiling
We tested 65 clinical and preclinical compounds on 5 BCL11B-a AL samples with available material [case 4 with t(2;14); cases 9, 10, and 12 with t(6;14); and case 18 with t(7;14); Table 1] and compared drug sensitivity with that in 23 cases of T-ALL.17 Primary cells were recovered from cryopreserved bone marrow aspirates. Drug responses were assessed in leukemia cells cocultured on hTERT-immortalized primary human bone marrow mesenchymal stromal cells, as previously described.17 Detailed procedures are provided in the supplemental Material.
Details of BCL11B-a AL cases
| Case | Code | Sex/age, y | FAB/WHO diagnosis | Immunophenotype | Karyotype |
|---|---|---|---|---|---|
| t(2;14)(q22;q32) | |||||
| 1 | UPN#455 | M/72 | AML | NA | 46,XY,t(2;14)(q22;q32)[4]/46,XY[9] |
| 2 | UPN#456 | M/52 | T/myeloid MPAL | CD2+, CD117+, CD34+, HLA-DR+, CD13+, TdT+, cCD3+, CD56+, MPO+, cCD79a+, CD7−, CD3−, CD5−, CD33−, CD14−, CD15−, CD22−, CD20− | 46,XY,t(2;14)(q22;q32)[19]/47,idem,+4[3] |
| 3 | UPN#457 | M/37 | AML M0 | CD2+, CD117+, CD34+, HLA-DR+, CD13+, TdT+, CD7+, CD15+, MPO+/−, CD33+/−, CD14−, CD11c−, CD3−, CD4−, CD8−, CD5−, CD10−, CD19− | 46,XY,t(2;14)(q22;q32)[15] |
| 4 | UPN#141 | F/76 | AML M0 | CD2+, CD117+, CD34+, HLA-DR+, CD13+, CD7+, MPO+, CD11b+, CD38+, CD33−, CD14−, CD15−, cCD3−, CD3−, CD4−, CD56−, CD10−, cCD79a−, CD19− | 46,XX,t(2;14)(q22;q32),del(5) (q13q31)[15] |
| 5 | UPN#458 | F/68 | AML M1 | CD2+, CD117+, CD34+, HLA-DR+, CD13+, CD7+, MPO+/−, CD33+, CD14−, TdT−, CD3−, CD4−, CD8−, CD1a−, CD10−, CD19−, CD22− | 46,XX,t(2;14)(q22;q32)[12]/ 46,idem,add(12)(q24)[5]/ 46,XX[3] |
| 6 | UPN#151 | M/18 | AML M1 | CD2+, CD117+, CD34+, HLA-DR+, CD13+, CD15+, CD56+, MPO−, CD33−, CD14−, CD7−, cCD3−, CD3−, CD4−, CD5−, CD19−, cCD79a− | 46,XY,t(2;14)(q22;q32),del(16) (q21)[15] |
| 7 | UPN#459 | M/64 | ETP-ALL | CD2+, CD117+, CD34+, HLA-DR+, CD13+, CD11b+, CD56+, TdT+, CD7+, CD38+, cCD3+, MPO−, CD33−, CD4−, CD5−, CD1a−, CD10−, CD19−, CD20−, cCD79a− | 46,XY[24].ish t(2;14)(q22;q32) (WI2-2194I13+; WI2-2001J18+)[5] |
| t(6;14)(q25;q32) | |||||
| 8 | UPN#143 | M/17 | AML-M1 | CD2+, CD117+, CD34+, HLA-DR+, CD13+, TdT+, CD33+, MPO+, CD56+, CD15+, CD14−, CD7−, cCD3−, CD3−, CD4−, CD5−, CD10−, CD19−, CD20−, cCD79a− | 46,XY,t(6;14)(q25;q32)[15] |
| 9 | UPN#145 | M/59 | T/myeloid MPAL | CD2+, CD117+, CD34+, CD13+, CD7+, TdT+, cCD3+, CD3−, CD8−, CD4−, CD5−, CD1a−, CD10−, cCD79a−, CD2+, CD13+, CD33+, CD11b+, MPO+, CD14+, CD34−, CD117−, CD10−, cCD79a− | 46,XY,t(6;14)(q25;q32),del(11) (p13p15)[15] |
| 10 | UPN#460 | M/48 | ETP-ALL | CD2+, CD117+, CD34+, HLA-DR+, CD13+, CD7+, TdT+, CD33+, CD38+, CD45+, CD99+, CD133+, cCD3+, CD3−, CD4−, CD5−, CD8−, CD52−, CD56−, CD65−, CD79a−, MPO−, TCR A/B−, TCR G/D−, CD10−, CD19−, cCD79a− | 46,XY,add(19)(q13)[10]/ 46,XY[5].ish ins(6;14) (q25;q32q32) (WI2-2194I13+; WI2-2934J16+)[6] |
| 11 | UPN#260 | M/4 | ETP-ALL | CD2+, CD117+, CD34+, HLA-DR+, CD33+, CD7+, TdT+, CD38+, CD45+, cCD3+, CD11b+, MPO+/−, CD99+, CD3−, CD4−, CD5−, CD8−, CD1a−, CD56−, CD13−, CD14−, CD14−, CD65−, CD10−, CD19− | 46,XY[10].ish t(6;14)(q25;q32) (WI2-2194I13+; WI2-2001J18+)[5] |
| 12 | UPN#462 | F/78 | ETP-ALL | CD2+, CD117+, CD34+, HLA-DR+, CD13+, CD7+, CD38+, cCD3+, TdT−, CD4−, CD8−, CD3−, CD5−, CD56−, CD79a−, CD15−, CD33−, MPO−, CD61−, CD10−, CD19−, CD20−, CD22−, cCD79a− | 47,XX,+4[8]/46,XX[8].nuc ish(WI2-2001J18X2),(WI2-2194I13X2),(WI2-2001J18 sep WI2-2194I13X1) [70/100] |
| 13 | UPN#463 | M/18 | T-ALL unspecified | NA | 47,XY,+4[15]/46,XY[15].ish t(6; 14)(q25;q32)(WI2-2194I13+; WI2-2001J18+)[3] |
| 14 | UPN#464 | M/29 | T-ALL unspecified | NA | nuc ish(WI2-2001J18X2),(WI2- 2194I13X2),(WI2-2001J18 sep WI2-2194I13X1)[70/106] |
| 15 | UPN#465 | M/12 | ETP-ALL | NA | 46,XY,t(6;14)(q25;q32),del(12) (p11p13)[9]/46,XY[6] |
| 16 | UPN#466 | M/44 | ETP-ALL | CD2+, CD117+, CD34+, HLA-DR+, CD13+, CD7+, CD38+, TdT+, CD33−, sCD3−, CD4−, CD8−, CD5−, CD56−, CD10−, CD19− | 46,XY,t(6;14)(q25;q32) [9]/46,XY[3] |
| t(7;14)(q22;q32) | |||||
| 17 | UPN#149 | M/51 | ETP-ALL | CD2+, CD117+, CD34+, HLA-DR+/−, cCD3+, TdT+, CD7+/−, CD15+/−, sCD3−, CD5−, CD4−, CD8−, MPO−, CD13−, CD33−, CD10−, cCD79a− | 46,XY,t(7;14)(q21;q32) [16]/46,XY[5] |
| 18 | UPN#147 | M/50 | T/myeloid MPAL | CD2+, CD117+, CD34+, HLA-DR+, CD7+, CD38+, CD15+, CD3+, CD2+, CD117+, CD34+, HLA-DR+, CD33dim, CD13dim, CD7+, CD38+, CD15+, MPO+, CD36+, CD123+, CD10−, CD19−, CD22−, cCD79a− | 46,XY,t(7;14)(q21;q32) [9]/46,XY[1] |
| t(8;14)(q24;q32) | |||||
| 19 | UPN#461 | M/65 | AML M0 | CD2+, CD117+, CD34+, HLA-DR+/−, CD13+, CD7+, cCD3−, CD3−, CD4−, CD1a−, CD5−, CD8−, MPO−, TdT−, CD10−, CD19− | 46,XY,t(2;5)(p21;q13)[10]/46,XX[9].nuc ish(WI2-2194I13X2),(WI2-2934J16X2),(WI2-2194I13 sep WI2-2934J16)[100/120] |
| 20 | UPN#467 | M/51 | AML M0 | CD2+, CD117+, CD34+, HLA-DR+, CD13+, CD7+, MPO−, CD33−, cCD3−, CD3−, CD8−, CD5−, CD56−, CD19−, cCD79a− | 46,XY[10].nuc ish(WI2-2194I13X2),(WI2-2934J16X2),(WI2-2194I13 sep WI2-2934J16)[91/100] |
Positive antigens common to all cases with available immunophenotype and the 14q32/BCL11B translocation are indicated in bold. NA, not available.
Results
Identification and molecular characterization of 4 recurrent 14q32/BCL11B translocations
We collected 915 cases with lymphoid and myeloid malignant hemopathies (supplemental Table 2). They included 96 cases of chronic lymphocytic leukemia, 76 of multiple myeloma, 96 of myelodysplastic syndrome, and 647 of acute leukemia. Of the acute leukemias, 29 were acute promyelocytic leukemia, 83 B-ALL, 202 AML (supplemental Table 3), and 333 T-ALL (178, non-ETP-ALL; 58, ETP-ALL; 8, T/M MPAL; and 89, not otherwise specified).
FISH screening for BCL11B, which is oriented from telomere to centromere and maps centromeric to the IGH locus, detected known BCL11B rearrangements in T-ALL: t(5;14)(q35;q32)/BCL11B-TLX3 (n = 45), t(5;14)(q34;q32)/BCL11B-NKX2.5 (n = 1), t(7;14)(p15;q32)/BCL11B-HOXA (n = 1), and inv(14)(q13q32)/BCL11B-NKX2-1 (n = 1). In addition, we found 20 cases (8 of 202 AML [4%], M0 or M1 subtype, and 12 of 333 T-ALL [3.6%], including 7 ETP-ALL, 3 T/M MPAL, and 2 T-ALL not otherwise specified) with more telomeric clusters of breakpoints at 14q32/BCL11B (Figure 1A; Table 1; supplemental Table 4) that were all specifically identified by fosmids WI2-2168J13 and WI2-2934J16 (supplemental Figures 1A, 2A, 3A, and 4A). The immunophenotype, available in 18 of 20 cases, showed an immature phenotype in both AML (8 of 8) and T-ALL (10 of 10).
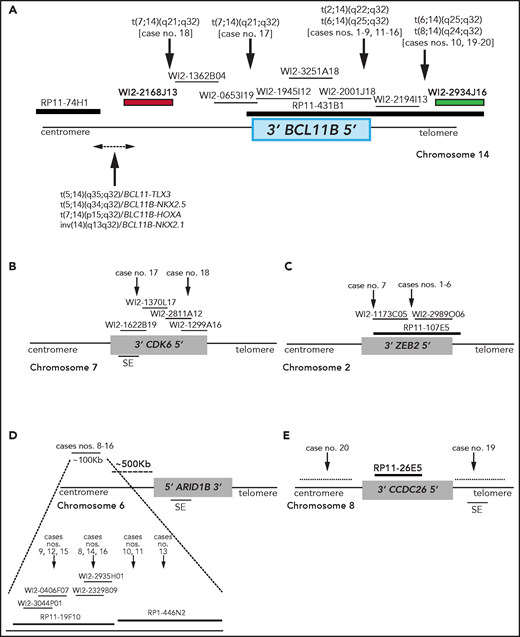
Breakpoint characterization in BCL11B-a AL. (A) Break-apart FISH assay differentiating t(2;14), t(6;14), t(7;14), and t(8;14) translocations (fosmid WI2-2168J13, red and fosmid WI2-2934J16, green) from 4 known rearrangements in T-ALL. The thin black horizontal lines represent fosmids that were used to narrow the 14q32 breakpoints. Arrows indicate the mapping of the breakpoint in each case. (B-E) Mapping of breakpoints at CDK6/7q21.2 (B); ZEB2/2q22.3 (C); 6q25.3 (D); 8q24 (E). Patient case numbers refer to Table 1. The figure panels are not to scale. SE, superenhancer.
Breakpoint characterization in BCL11B-a AL. (A) Break-apart FISH assay differentiating t(2;14), t(6;14), t(7;14), and t(8;14) translocations (fosmid WI2-2168J13, red and fosmid WI2-2934J16, green) from 4 known rearrangements in T-ALL. The thin black horizontal lines represent fosmids that were used to narrow the 14q32 breakpoints. Arrows indicate the mapping of the breakpoint in each case. (B-E) Mapping of breakpoints at CDK6/7q21.2 (B); ZEB2/2q22.3 (C); 6q25.3 (D); 8q24 (E). Patient case numbers refer to Table 1. The figure panels are not to scale. SE, superenhancer.
Overall, there were 4 translocations: t(7;14)(q21.2;q32) (n = 2) (supplemental Figure 1A); t(2;14)(q22.3;q32) (n = 7; supplemental Figure 2A); t(6;14)(q25.3;q32) (n = 9; supplemental Figure 3A); and t(8;14)(q24.2;q32) (n = 2; supplemental Figure 4A).
Molecular characterization of t(7;14)(q21.2;q32)
In the 2 cases with t(7;14)(q21.2;q32), the 14q32 breakpoints were narrowed between fosmids WI2-2168J13 and WI2-1945I12, an 85-kb region downstream of BCL11B (Figure 1A). The 7q21.2 breakpoints fell within CDK6 (Figure 1B). In both cases, the full length of BCL11B moved to der(7), at the 3' end of CDK6 (supplemental Material).
Molecular characterization of t(2;14)(q22.3;q32)
In the 7 cases with t(2;14)(q22.3;q32), the 14q32 breakpoints fell between fosmids WI2-2001J18 and WI2-2194I13 (Figure 1A), whereas the 2q22.3 breakpoints mapped within the zinc finger E-box binding homeobox 2 (ZEB2) gene (Figure 1C). By cloning and sequencing, we found an in-frame ZEB2-BCL11B fusion transcript in all cases. Whereas breakpoints in ZEB2 were alternatively located in exon 2 or 4 (NM_ 014795.3), the breakpoint in BCL11B invariably fell in exon 2 (nucleotide 554; NM_138576.3; supplemental Figure 2B). Therefore, regulation of BCL11B transcription moved under the control of the ZEB2 promoter. The predicted ZEB2-BCL11B proteins retained all the BCL11B functional domains (supplemental Figure 2C-D).
Molecular characterization of t(6;14)(q25.3;q32)
Rearrangements between 6q25.3 and 14q32 consisted of a balanced t(6;14)(q25.3;q32) (n = 8) or an ins(6;14)(q25.3;q32q32) (n = 1) (Table 1). The 14q32 breakpoints were slightly variable and localized between fosmids WI2-2001J18 and WI2-2934J16 (Figure 1A). The 6q25 breakpoints were detected by clone RP11-19F10 (7 cases) or clone RP11-446N2 (2 cases) in a region of ∼100-kb without known genes (Figure 1D). In all cases, rearrangements did not produce fusion transcripts but relocated ARID1B and its regulatory sequences closes to BCL11B at der(6) (case 10) or der(14) (cases 8, 9, and 11-16; Figure 1D).18,19
Molecular characterization of t(8;14)(q24.2;q32)
In the 2 cases with t(8;14)(q24.2;q32), the 14q32 breakpoints, upstream of BCL11B, mapped between fosmids WI2-2194I13 and WI2-2934J16 (Figure 1A), whereas the 8q24.2 breakpoints, telomeric to MYC, were narrowed by clone RP11-26E5, which maps ∼50 kb centromeric to the BENC enhancer region and encompasses CCDC26. This clone was retained on der(8) in case 19, whereas it moved to der(14) in case 20 (Figure 1E; supplemental Material).
Karyotype was available in 19 of 20 cases (Table 1) and 14q32/BCL11B translocations were detected in 12 cases. In 9 of them, the translocation was the only chromosomal change (Table 1). SNPa results were available in 15 of 20 cases and confirmed a low burden of co-occurring abnormalities (mean, 1.6; range, 0-6; supplemental Table 5). Additional chromosomal abnormalities (ACAs) included trisomy 4 in 3 cases (2, 12, and 13; Table 1), a 16q deletion encompassing CTCF gene in 2 cases (6 and 17; Table 1), and a del(5q) in 1 case (4; Table 1). Notably, a 4q trisomy has been reported in immature T-ALL by Takahashi et al,3 and the interstitial deletion of 5q is a recurrent CNV described in ETP-ALL by our group.20 Moreover, common cnLOHs were found at 2p25.3-p24.1 and 2p22.3-p13.2 (cases 2 and 19) and at 9p24.3-p21 (cases 9 and 20).
Clinical and phenotypic features of BCL11B-a AL
BCL11B-a AL cases showed male predominance (M/F: 17/3) and a median age of 50.5 years (range, 4-78) (Table 1). Immunophenotypic characterization was available in 16 cases, all of which shared an immature immunophenotype characterized by expression of the hematopoietic stem cell markers HLA-DR, CD117, and/or CD34. All cases shared positivity for the T-lineage surface marker CD2. Fifteen cases were positive for myeloid antigens CD13 and/or CD33; MPO was positive or weak in 8 cases. Positivity for CD7 and cCD3 was found in 13 and 8 cases, respectively. More mature T-lineage antigens, such as CD1a, CD5, and CD8, were always absent (Table 1).
Overlapping features emerged in 6 cases in which morphological revision of May-Grunwald-Giemsa–stained bone marrow smears was performed. Blasts were variable in size, with a high nuclear/cytoplasmic ratio and an agranular cytoplasm. In variable percentages (20% to 90%), kidney-shaped nuclei with invagination/indentation, prominent nucleoli, and some hand mirror cells were observed (supplemental Figure 5).
14q32 rearrangements result in BCL11B activation
In BCL11B-a AL cases, BCL11B was activated, showing a significant upregulation compared with AML (P < .0001) and similar levels of expression compared with cases of T-ALL and ETP-ALL (Figure 2A). Activation was found at diagnosis, but not at hematological and cytogenetic remission (Figure 2B). Moreover, in the t(2;14)-associated BCL11B-a AL, a specific test showed low expression of the wild-type BCL11B, indicating that upregulation involved only the fusion transcript (supplemental Figure 6A-B). Whether overexpression was related to 1 or both alleles in all the other BCL11B-a ALs could not be determined.
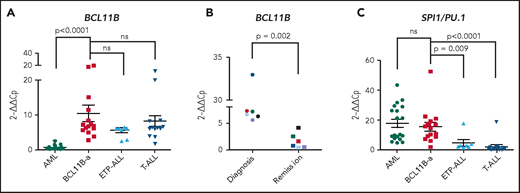
14q32 rearrangements result in the activation of BCL11B and SPI1/PU.1. (A) Expression of BCL11B in 15 BCL11B-a AL cases (1-4, 6-13, 17-18, and 20; Table 1) compared with in-house series of AML (n = 19), ETP-ALL (n = 8), and T-ALL (n = 15) cases. (B) One of 3 independent experiments showing longitudinal expression of BCL11B in 6 paired diagnosis-remission BCL11B-a AL cases: case 4 (black), case 6 (blue), case 8 (red), case 9 (green), case 17 (light blue), and case 18 (violet). Patient case numbers refer to Table 1. (C) Expression of SPI1/PU.1 in 15 BCL11B-a cases (1-4, 6-13, 17-18, 20; Table 1) compared with in-house series of AML (n = 19), ETP-ALL (n = 7), and T-ALL (n = 15) cases. Values are expressed as means ± standard error of the mean. Cp, crossing point; ns, not significant.
14q32 rearrangements result in the activation of BCL11B and SPI1/PU.1. (A) Expression of BCL11B in 15 BCL11B-a AL cases (1-4, 6-13, 17-18, and 20; Table 1) compared with in-house series of AML (n = 19), ETP-ALL (n = 8), and T-ALL (n = 15) cases. (B) One of 3 independent experiments showing longitudinal expression of BCL11B in 6 paired diagnosis-remission BCL11B-a AL cases: case 4 (black), case 6 (blue), case 8 (red), case 9 (green), case 17 (light blue), and case 18 (violet). Patient case numbers refer to Table 1. (C) Expression of SPI1/PU.1 in 15 BCL11B-a cases (1-4, 6-13, 17-18, 20; Table 1) compared with in-house series of AML (n = 19), ETP-ALL (n = 7), and T-ALL (n = 15) cases. Values are expressed as means ± standard error of the mean. Cp, crossing point; ns, not significant.
It is worth noting that, in the thymus, BCL11B and SPI1/PU.1 show an inverse modulation during T-lineage commitment.11,21 ; SPI1/PU.1 expression declines, whereas the BCL11B gene switches on and progressively increases. Thus, we investigated SPI1/PU.1 levels in our cohort of patients and found that it was significantly higher in BCL11B-a AL than in ETP-ALL (P = .009) and non-ETP T-ALL (P < .0001), whereas no differences emerged in the comparison with AML (Figure 2C). We also investigated the expression of ZEB2, which was rearranged in cases with the t(2;14) translocation. BCL11B-a AL showed a significant overexpression of ZEB2 when compared with T-ALL (P < .0001) and ETP-ALL (P = .009), but not when compared with AML (supplemental Figure 7A). Likewise, the single case of t(2;14)/ZEB2-BCL11B described by Goossens et al belonged to the immature subgroup of T-ALL, which showed a significantly higher expression of ZEB2 than the more mature T-ALLs.22 Moreover, we found a similar ZEB2 expression at both diagnosis and remission (supplemental Figure 7B). This finding may be explained by ZEB2 expression in the normal myeloid compartment.23
A distinct expression profile marks BCL11B-a AL cases
Unsupervised analysis of normalized counts obtained from RNA-seq separated BCL11B-a AL from T-ALL, ETP-ALL, and AML in the first principal component, showing a total variance of 60% (Figure 3A). Differential expression analysis identified 5144 deregulated genes. Upregulation (4852 upregulated and 292 downregulated genes) characterized the signature (Figure 3B). Functional analysis identified the cytokine-cytokine receptor interaction pathway as the most upregulated. Pathways related to T-cell differentiation, T-cell receptor signaling and primary immunodeficiency were the most downregulated (supplemental Table 6). Gene Set Enrichment Analysis showed that BCL11B targets were significantly deregulated in the signature of BCL11B-a AL cases (false discovery rate [FDR] = 0.07; Figure 3C). Although the analysis of differentially expressed genes revealed a marked skewness toward upregulation at the global level, the same analysis, focusing on BCL11B direct transcriptional targets, identified an opposite pattern, with a prevalent downregulation involving 107 of 179 (60%) known BCL11B target genes (Figure 3D). This result suggests that 14q32 translocations cause activation of the BCL11B transcriptional repressor program. Although RNA-seq confirmed the hyperexpression of SPI1/PU.1 in BCL11B-a AL compared with other leukemias, known target genes of PU.1 were not significantly enriched in BCL11B-a AL (data not shown).
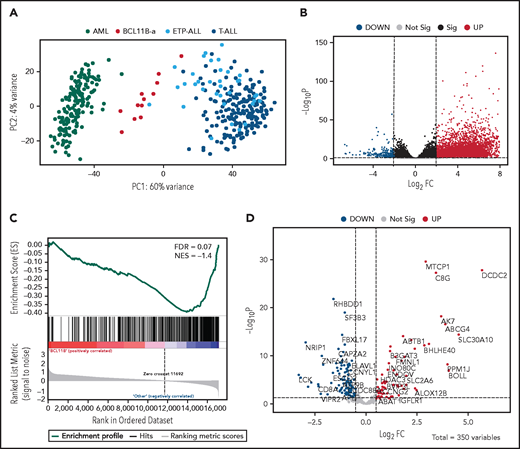
Distinct expression profile in BCL11B-a AL. (A) Scatter plot showing variance distribution of BCL11B-a AL, AML, ETP-ALL, and T-ALL cases emphasized by principal component analysis 1 (PC1). (B) Volcano plot showing the gene expression in BCL11B-a AL cases compared with AML, ETP-ALL, and T-ALL. Log2FC is plotted against the −Log10-adjusted P value. Black indicates genes with a significant FDR (≤0.05). Red and blue represent upregulated and downregulated differentially expressed genes, respectively (FDR ≤ 0.05, |Log2 FC| ≥2). Gray, nonsignificantly expressed genes. (C) Gene set enrichment analysis of BCL11B target genes in BCL11B-a AL cases vs other leukemic groups (AML, ETP-ALL, and T-ALL). (D) Volcano plot showing the distribution of 350 BCL11B targets in BCL11B-a AL cases compared with other leukemias. Log2FC is plotted against the −Log10-adjusted P value. Red and blue represent significant (FDR ≤0.05) upregulated and downregulated targets, respectively; NES, normalized enrichment score; FC, fold change.
Distinct expression profile in BCL11B-a AL. (A) Scatter plot showing variance distribution of BCL11B-a AL, AML, ETP-ALL, and T-ALL cases emphasized by principal component analysis 1 (PC1). (B) Volcano plot showing the gene expression in BCL11B-a AL cases compared with AML, ETP-ALL, and T-ALL. Log2FC is plotted against the −Log10-adjusted P value. Black indicates genes with a significant FDR (≤0.05). Red and blue represent upregulated and downregulated differentially expressed genes, respectively (FDR ≤ 0.05, |Log2 FC| ≥2). Gray, nonsignificantly expressed genes. (C) Gene set enrichment analysis of BCL11B target genes in BCL11B-a AL cases vs other leukemic groups (AML, ETP-ALL, and T-ALL). (D) Volcano plot showing the distribution of 350 BCL11B targets in BCL11B-a AL cases compared with other leukemias. Log2FC is plotted against the −Log10-adjusted P value. Red and blue represent significant (FDR ≤0.05) upregulated and downregulated targets, respectively; NES, normalized enrichment score; FC, fold change.
Compared with the T-ALL series and with ETP-ALL cases as a separate group, BCL11B-a AL cases showed a significant upregulation: 6265 and 5787 genes, respectively (supplemental Figure 8A-B). Functional analysis showed that the cytokine-cytokine receptor interaction was the most upregulated pathway vs both T-ALL and ETP-ALL. It included positive regulators of JAK/STAT signaling, such as IFNL1, IFNL3, IFNA, IL6, IL7, IL19, IL20, IL24, IL27, OSMR, IL13RA1, and PRLR (supplemental Table 6).24,25 A significant downregulation of 390 genes vs T-ALL and of 324 genes vs ETP-ALL was found (supplemental Figure 8A-B). Functional analysis identified hematopoietic cell lineage and T-cell receptor signaling as the most downregulated pathways (supplemental Table 6), suggesting that the T-lymphoid program is not yet fully activated in this immature entity. These pathways included genes encoding T-cell surface antigens (ie, CD1A, CD1B, CD1E, CD3D, CD3E, CD3G, CD5, CD8A, and CD28) and T-cell signaling molecules (TCF7, LCK, RASGRP1, JUN, and RAG1).
When compared with AML, BCL11B-a AL showed upregulation of 5118 genes and downregulation of 680 genes (supplemental Figure 8C). Ribosome biogenesis (including genes encoding ribosomal protein subunits) and protein translation pathways (ie, EIF3CL and EIF4A1) emerged as the most upregulated (supplemental Table 6).
The mutational landscape of BCL11B-a acute leukemia
NGS revealed a burden of variants ranging from 2 to 13 per case (mean, 5.7 events). Overall, 95 variants were found in BCL11B-a AL cases (Figure 4), 29 of which are not reported in the main variant databases (ie, gnomAD, dbSNP, 1000 Genome Project, Clinvar, HGMD, Ensembl, or COSMIC). For each variant, the degree of pathogenicity is shown in supplemental Table 7 and the supplemental Material. All investigated cases had FLT3 mutations, which comprised internal tandem duplication (ITD; n = 12), nucleotide substitution at the tyrosine-kinase domain (n = 4), or both (n = 1). No NOTCH1 or FBXW7 mutations were detected in the BCL11B-a ALs tested (supplemental Material). However, a NOTCH2 somatic mutation was found in ETP-ALL case 10 (supplemental Table 7). RUNX1 mutations were present in 3 cases. A variety of epigenetic modulator genes (WT1 [n = 8], DNMT3A [n = 6], TET2 [n = 4], EZH2, EP300, and ASXL2 [n = 2, each]) were affected in all but 1 case (Figure 4; supplemental Table 7). All other events involving epigenetic genes were not recurrent. In 3 cases, targeted sequencing on paired diagnosis-remission samples, showed that DNMT3A mutations remained present in hematological and cytogenetic remission (supplemental Table 8). Additional sporadic variants in genes involved in cell signaling, RNA processing, cell adhesion, cell cycle, and transcriptional regulation were also found (Figure 4; supplemental Table 7).

Mutational profile of BCL11B-a AL. Oncoprint heat map showing all sequence variants detected in BCL11B-a AL cases. In addition to somatic mutations (dark green), variants in which the somatic or germline origin could not be definitively assessed (light green) are indicated. Additional gene alterations are represented by different colors. Mutational analysis was not performed in cases 15 and 19 because of lack of material. cnLOH, copy neutral loss of heterozygosity.
Mutational profile of BCL11B-a AL. Oncoprint heat map showing all sequence variants detected in BCL11B-a AL cases. In addition to somatic mutations (dark green), variants in which the somatic or germline origin could not be definitively assessed (light green) are indicated. Additional gene alterations are represented by different colors. Mutational analysis was not performed in cases 15 and 19 because of lack of material. cnLOH, copy neutral loss of heterozygosity.
BCL11B-a ALs are sensitive to tyrosine kinase and JAK/STAT inhibitors
To detect functional vulnerabilities, we performed ex vivo drug response profiling in 5 cases with BCL11B-a AL cultured on human mesenchymal stromal cells. Comparing the specific drug sensitivities to an unrelated cohort of T-ALL cases,17 in BCL11B-a AL cases, we found a striking decrease in activity for the genotoxic agents used in both AML and T-ALL, such as docetaxel, mitoxantrone, idarubicin, etoposide, doxorubicin, cytarabine, gemcitabine, and topotecan (Figure 5; supplemental Figure 9). Corroborating the genomic data, that suggest activated FLT3 and JAK/STAT pathways, we found higher sensitivity to tyrosine kinases (sunitinib, crenolanib) and JAK/STAT inhibitors (NVP-BVB808, momelotinib, fedratinib, and NVP-BSK805) in BCL11B-a AL cases compared with other T-ALL samples (Figure 5; supplemental Figure 9). Of note, the tyrosine kinase inhibitor midostaurin showed low activity in BCL11B-a AL cases, despite the presence of FLT3 mutations, indicating that drug sensitivities may depend on more complex factors than candidate gene mutations (Figure 5; supplemental Figure 9).
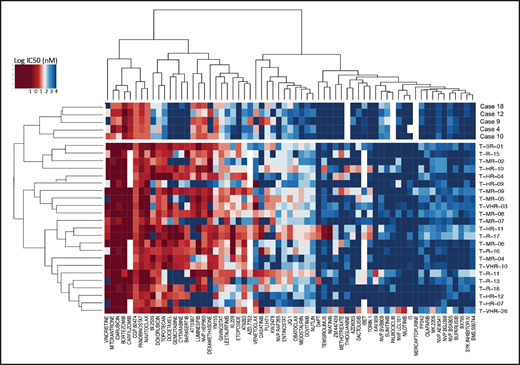
Drug response profile of BCL11B-a AL. Heat map indicating the response of BCL11B-a AL (5 cases: 4, 9, 10, 12, and 18) compared with T-ALL (23 cases)17 to 65 compounds and represented by 50% inhibitory concentration values (IC50). Samples (rows) are in order according to clinical classification (BCL11B-a AL and T-ALL), and compounds are reported in columns.
Drug response profile of BCL11B-a AL. Heat map indicating the response of BCL11B-a AL (5 cases: 4, 9, 10, 12, and 18) compared with T-ALL (23 cases)17 to 65 compounds and represented by 50% inhibitory concentration values (IC50). Samples (rows) are in order according to clinical classification (BCL11B-a AL and T-ALL), and compounds are reported in columns.
Discussion
In this study, different types of leukemia, variably classified as immature AML, ETP-ALL, or T/M MPAL according to immunophenotype, converged into genetic disease characterized by 14q32 translocations activating BCL11B.
BCL11B is a C2H2 zinc-finger transcription factor also defined as a “guardian of T-cell fate”26 for its role in the maintenance of T-cell identity.10,11 In human T-ALL, it undergoes translocations that alternatively activate TLX3, HOXA, NKX2-1, and NKX2-5 genes.13,27‐30 It may also act as a tumor suppressor undergoing loss-of-function mutations and deletions in 13% and 3% of T-ALL and ETP-ALL cases, respectively.31 The physiological expression of BCL11B starts in the transition between the stages DN2a and DN2b of the thymocyte, and it is maintained along the entire lineage until reaching mature T cells.11,32 High levels of BCL11B have been reported in T-cell leukemia/lymphoma (ATLL), T-ALL, and immature AML.33‐35
In our FISH screening of malignant hemopathies, BCL11B was shown to be involved in known T-ALL translocations and in a subset of acute leukemias characterized by recombination of 14q32 with 4 alternative chromosomes partners: 2q22.3, 6q25.3, 7q21.2, and 8q24.2. Interestingly, for the last 3 regions, the full-length BCL11B translocated to regions without known genes and was likely activated by elements that were previously involved in oncogenesis: the superenhancer of ARID1B at 6q25.318,19,35 ; a superenhancer located inside the CDK6 gene, at 7q21.218,28 ; and the BENC superenhancer at 8q24.2.36,37 Rearrangements involving 2q22.3 as the chromosome partner, instead generated a ZEB2-BCL11B fusion gene that was highly expressed in the leukemic cells. As a member of the ZEB family, ZEB2 controls cellular motility, stem cell properties, apoptosis and senescence, and it is crucial for epithelial-mesenchymal transition.38 Interestingly, both ZEB2 and BCL11B act as transcriptional repressors by interacting with the NuRD corepressor complex.8,9,39,40 As in the fusion protein, ZEB2 maintains its NuRD interaction motif RRKQxxP at the N terminal and BCL11B maintains its C2H2-ZEB at the C terminal,41 an effect of their chimeric product at the transcriptional level is plausible. In our study, we found high expression of both genes, not only in the leukemic bone marrow of cases bearing the fusion, but also in the other BCL11B-a AL cases. However, our results from individual longitudinal analyses pointed to BCL11B deregulation as the major pathogenetic event, as BCL11B, but not ZEB2, decreased at hematological and cytogenetic remission, as expected for clonal driver changes. Nevertheless, because the function of ZEB2 has been emphasized in both myeloid and ETP-ALL leukemogenesis,22,23 a hypothetical role for ZEB2 expression in the leukemic process of BCL11B-a AL should be further investigated.
To provide a diagnostic test to differentiate BCL11B-activating rearrangements from other typical T-ALL–associated translocations,42 in which known oncogenes are activated by BCL11B downstream enhancer,13,27‐30 we set up a specific FISH assay that was useful for diagnosing the new BCL11B-a AL entity by discriminating the cluster of breakpoints at the BCL11B/14q32 that fall telomeric to the clusters of the other 14q32/BCL11B translocations that activate oncogenes.
The transcriptome profile grouped the variety of AL with BCL11B activation and identified a new entity in which the BCL11B driver effect was emphasized by the impact of its targets within the specific signature. A common phenotypic denominator of these leukemic blasts emerged, with expression of immature, myeloid, and T-lymphoid antigens, suggesting potential toward both lymphoid and myeloid programs in the leukemic progenitor. Interestingly, SPI1/PU.1 expression in the BCL11B-a AL signature was similar to that observed in AML, but was significantly higher than the level found in T-ALL. As SPI1/PU.1 is a well-characterized, double-faced T-lymphoid and myeloid differentiation player, depending on cell context and epigenetics,43,44 it is a good candidate to support myeloid potential in BCL11B-a AL. A putative oncogenic role of SPI1/PU.1 in this leukemia subset is suggested by the occurrence of recurrent SPI1/PU.1 fusions in immature T-ALL.43,45
A focus on the mutational landscape showed that both FLT3 and epigenetic genes were affected in the BCL11B-a AL cases. Interestingly, WT1, DNMT3A, and TET2, the most frequently mutated epigenetic genes in this study, have been reported in acute leukemia with expression of myeloid and/or T-lymphoid antigens.46‐48 Furthermore, the persistence of DNMT3A gene mutations at remission has been described in both AML49 and T-ALL.50 These findings suggest that DNMT3A mutations identify preleukemic clonal hematopoiesis underlying the development of different leukemia subtypes.48 With respect to FLT3 mutations, including the ITD and D835 variants, they did not discriminate immunological and cytogenetic leukemia subsets. However, they have been traced as important second hits, so-called class 2 mutations, supporting malignant proliferation.48,51 Remarkably, an in vivo mouse model has shown that, when combined, FLT3-ITD and DNMT3A loss-of-function mutations recapitulated a variety of human leukemias, including mixed-lineage leukemia expressing both myeloid and T-cell markers.52 Altogether, these findings suggest a 3-hit model in the pathogenesis of BCL11B-a AL, in which epigenetic event(s) may act by opening the chromatin in a totipotent progenitor, thus favoring BCL11B rearrangements; FLT3 mutations behave as a crucial hit to support proliferation.48
Functional drug response further supported the specific biologic profile of BCL11B-a AL and provided some new insights. In addition to the poor sensitivity to genotoxic agents used in either AML or T-ALL induction therapy, a higher sensitivity to distinct tyrosine kinase and JAK/STAT pathway inhibitors emerged. Although the lack of sensitivity to genotoxic agents appeared not to be predicted by genomic lesions, they were instead in keeping with sensitivity to JAK/STAT and tyrosine kinase inhibition.
In summary, in this new leukemia entity, genomic findings overstep immunological classification of immature blasts, providing new insights for precise diagnosis and for tailored therapy in prospective clinical trials.
Acknowledgments
The authors thank Lucia Brandimarte for invaluable help during the development of this work.
C. Mecucci was supported by PRIN2017 (Ministero Italiano Università e Ricerca [MIUR]) code 2017PPS2X4. J.-P.B. and B.B. were supported by the Empiris Foundation.
Authorship
Contribution: C. Mecucci, R.L.S., V.P., S. Arniani, and M.M. performed and analyzed the cytogenetics, FISH, and SNPa; D.D.G., P.G., F.P., C. Matteucci, Z.K.A., K.D.K., S. Aerts, J.C., and R.P. performed and analyzed molecular and NGS studies; C. Mecucci, R.L.S., C.J.H., N.T., G.D.S., G.R., R.B., and P.V. collected samples and patient data; B.B. and J.-P.B. performed the drug profile; C. Mecucci conceived the study; and C. Mecucci, D.D.G., and R.L.S. collected all the data and wrote the manuscript.
Conflict-of-interest disclosure: The authors declare no competing financial interests.
Correspondence: Cristina Mecucci, Hematology, University of Perugia, CREO, P.le Menghini 9, 06132 Perugia, Italy; e-mail: cristina.mecucci@unipg.it.
The data reported in this article have been deposited in the National Center for Biotechnology Information, Gene Expression Omnibus (GEO) (accession numbers GSE162283, GSE162000 for SNParray, GSE162280 for RNA-Seq, and GSE162282 for sequencing data).
The online version of this article contains a data supplement.
There is a Blood Commentary on this article in this issue.
The publication costs of this article were defrayed in part by page charge payment. Therefore, and solely to indicate this fact, this article is hereby marked “advertisement” in accordance with 18 USC section 1734.

This feature is available to Subscribers Only
Sign In or Create an Account Close Modal