

Key Points
CCUS is a precursor condition for myeloid neoplasms with myelodysplasia with a highly variable risk of disease progression.
Clone metrics enables estimation of disease progression risk and may inform clinical decision making in patients with clonal cytopenia.

Abstract
Clonal cytopenia of undetermined significance (CCUS) is associated with an increased risk of developing a myeloid neoplasm with myelodysplasia (MN). To identify the features of the mutant clone(s) that is associated with clinical phenotype and progression, we studied the following cohorts of individuals: 311 patients with idiopathic cytopenia of undetermined significance (ICUS), 532 community-dwelling individuals without hematologic phenotype (n = 355) or with unexplained anemia (n = 177), and 592 patients with overt MN. Ninety-two of 311 (30%) patients with ICUS carried a somatic genetic lesion that signaled CCUS. Clonal hematopoiesis (CH) was detected in 19.7% and 27.7% of nonanemic and anemic community-dwelling individuals, respectively. Different mutation patterns and variant allele frequencies (VAFs) (clone metrics parameters) were observed in the conditions studied. Recurrent mutation patterns exhibited different VAFs associated with marrow dysplasia (0.17-0.48), indicating variable clinical expressivity of mutant clones. Unsupervised clustering analysis based on mutation profiles identified 2 major clusters, characterized by isolated DNMT3A mutations (CH-like cluster) or combinatorial mutation patterns (MN-like cluster), and showing different overall survival (HR, 1.8). In patients with CCUS, the 2 clusters had different risk of progression to MN (HR, 2.7). Within the MN-like cluster, distinct subsets with different risk of progression to MN were identified based on clone metrics. These findings unveil marked variability in the clinical expressivity of myeloid driver genes and underline the limitations of morphologic dysplasia for clinical staging of mutant hematopoietic clones. Clone metrics appears to be critical for informing clinical decision-making in patients with clonal cytopenia.
Medscape Continuing Medical Education online
In support of improving patient care, this activity has been planned and implemented by Medscape, LLC and the American Society of Hematology. Medscape, LLC is jointly accredited by the Accreditation Council for Continuing Medical Education (ACCME), the Accreditation Council for Pharmacy Education (ACPE), and the American Nurses Credentialing Center (ANCC), to provide continuing education for the healthcare team.
Medscape, LLC designates this Journal-based CME activity for a maximum of 1.00 AMA PRA Category 1 Credit(s)™. Physicians should claim only the credit commensurate with the extent of their participation in the activity.
Successful completion of this CME activity, which includes participation in the evaluation component, enables the participant to earn up to 1.0 MOC points in the American Board of Internal Medicine’s (ABIM) Maintenance of Certification (MOC) program. Participants will earn MOC points equivalent to the amount of CME credits claimed for the activity. It is the CME activity provider’s responsibility to submit participant completion information to ACCME for the purpose of granting ABIM MOC credit.
All other clinicians completing this activity will be issued a certificate of participation. To participate in this journal CME activity: (1) review the learning objectives and author disclosures; (2) study the education content; (3) take the post-test with a 75% minimum passing score and complete the evaluation at http://www.medscape.org/journal/blood; and (4) view/print certificate. For CME questions, see page 1001.
Disclosures
Editor Andrew Roberts's organization, the Walter and Eliza Hall Institute, received grants for clinical research from AbbVie Inc, and Janssen Pharmaceuticals, Inc. The Walter and Eliza Hall Institute also received royalties related to venetoclax and will control any distribution based on their institutional policies about scientific contribution to commercial income. CME questions author Laurie Barclay, freelance writer and reviewer, Medscape, LLC, and the authors declare no competing financial interests.
Learning objectives
Upon completion of this activity, participants will:
- 1.
Describe features of the mutant clone(s) associated with clinical phenotype and progression in a prospective cohort of 311 patients with idiopathic cytopenia of undetermined significance who were sequentially investigated at the time of diagnosis and during follow-up, either in a phase of stable disease or at the time of progression to a myeloid neoplasm with myelodysplasia (MN), and in cohorts of 532 community-dwelling individuals (355 without hematologic conditions; 177 with unexplained anemia) and of 592 patients with overt MN
- 2.
Determine use of molecular profiling and clone metrics in patients with clonal cytopenia of undetermined significance (CCUS), including mutation signatures causative of cytopenia and factors contributing to the clinical expressivity of clones
- 3.
Identify clinical implications of features of the mutant clone(s) associated with clinical phenotype and progression in patients with CCUS, community-dwelling individuals, and patients with MN
Release date: September 16, 2021; Expiration date: September 16, 2022
Introduction
In the past decade, massive parallel DNA sequencing studies have unveiled the genomic landscape of myelodysplastic syndromes (MDSs) and related myeloid neoplasms with myelodysplasia (MNs). By using targeted gene sequencing in large patient cohorts, independent studies detected somatic mutations in several genes belonging to different biological pathways, and showed that most patients have combinatorial mutation patterns.1-3 At the same time, population-based studies searched for somatic mutations of these genes in individuals not known to have any hematologic abnormalities.4,5 These investigations have shown that selected somatic mutations, mainly those in genes of DNA methylation and histone modification, are commonly acquired during aging, resulting in clonal hematopoiesis of indeterminate potential (CHIP), a condition with normal peripheral blood cell counts but increased risk of developing hematologic malignancies.4-6 Somatic mutations in myeloid malignancy–related genes have also been detected in patients with aplastic anemia and have been found to be associated with worse outcomes, including progression to MDS.7,8 Moreover, a recent population-based study showed higher prevalence of clonal hematopoiesis (CH) in elderly individuals with unexplained anemia.9
From a clinical standpoint, demonstrating the clonal nature of hematopoiesis is particularly important in those disorders that do not fulfill the current diagnostic criteria for myeloid malignancy,1,10 such as clonal cytopenia of undetermined significance (CCUS) or clonal monocytosis.10-14 However, how to use molecular profiling in these patients is still unclear.15-17 In particular, several issues related to CCUS remain to be clarified, including mutation signatures truly causative of cytopenia and factors contributing to the clinical expressivity of clones, as well as mechanisms of progression to overt malignancy.
In this study, we examined a prospective cohort of patients with CCUS who were sequentially investigated at the time of diagnosis and during follow-up, either in a phase of stable disease or at the time of progression to an MN. In addition, we studied cohorts of community-dwelling individuals and of patients with MN, to better define the associations between molecular profiles and hematologic phenotypes with clinical outcomes.
Patients and methods
Population cohorts, patient characteristics, and clinical procedures
This study included 4 distinct cohorts of individuals: (1) 311 patients who had received a provisional diagnosis of ICUS at the Department of Hematology, Policlinico San Matteo and University of Pavia, Italy, from 2003 through 2019 ; (2) 592 patients who had received a diagnosis of MN (MDS, myelodysplastic/myeloproliferative neoplasm [MDS/MPN], or acute myeloid leukemia with myelodysplasia-related change) at the same institution over the same period of time; (3) 177 individuals aged 60 or older, identified through 3 population-based studies (detailed in supplemental Methods, available on the Blood Web site), with unexplained anemia of the elderly (AoE; ie, not explained by any nutritional or iron deficiency, renal failure, or inflammation); (4) 355 healthy individuals aged ≥60 years recruited from the same population-based studies (supplemental Figure 1). Demographic and clinical and features of the subjects included in the study are reported in Table 1. A portion of the 311 patients with ICUS belonged to a cohort that had been reported.13 Diagnostic procedures were performed according to recent recommendations.18-21 Accordingly, a diagnosis of ICUS required bone marrow examination, whereas community-dwelling individuals with AoE did not undergo such an investigation.
Clinical and hematological features of individuals included in the study
| Variable | Healthy subjects | Anemia of the elderly | Cytopenia of undetermined significance | Myeloid neoplasm with myelodysplasia |
|---|---|---|---|---|
| Patients, n | 355 | 177 | 311 | 592 |
| Sex, male/female | 154/201 | 87/90 | 144/167 | 365/227 |
| Age, y, median (range) | 70 (60-94) | 72 (60-102) | 58 (19-89) | 67 (18-93) |
| Hb, g/dL, median (range) | 14.4 (12.1-18.4) | 12.0 (6.8-17.6) | 12.7 (5.9-16.4) | 10.2 (3.33-17.4) |
| MCV, fL, median (range) | 90.6 (74.0-99.6) | 94.0 (60.3-114.3) | 91.9 (61.7-121.0) | 98.0 (56.1-134.6) |
| WBC, ×109/L, median (range) | 5.94 (2.79-12.44) | 6.07 (3.53-12.9) | 3.48 (0.87-16.0) | 4.66 (0.7-164.0) |
| ANC, ×109/L, median (range) | 3.36 (1.42-7.88) | 3.66 (1.54-6.3) | 1.63 (0.05-10.9) | 2.16 (0.04-109.62) |
| PLT, ×109/L, median (range) | 224 (101-421) | 230.5 (113-481) | 152 (10-917) | 148 (6-1383) |
| BM blasts, %, median (range) | — | — | 2 (1-3) | 2 (1-98) |
| WHO category | ||||
| MDS | — | — | — | 405 |
| MDS/MPN | — | — | — | 152 |
| AML-MRC | — | — | — | 35 |
ANC, absolute neutrophil count; BM, bone marrow; Hb, hemoglobin; MCV, mean corpuscular volume; PLT, platelet; WBC, white blood cell; WHO, World Health Organization.
This study was approved by the Ethics Committee of the IRCCS Policlinico San Matteo Foundation (Pavia, Italy). The procedures followed were in accordance with the Declaration of Helsinki of 1975, as revised in 2000, and samples were obtained after the patients provided written informed consent.
Mutation analysis
A core panel of 40 genes selected based on prior implication in myeloid disease (supplemental Table 1) was analyzed in the whole study cohort on peripheral blood granulocytes, as previously described.13 Details of the sequencing analysis are provided in the supplemental Material.
Statistical analysis
Statistical analyses were performed with Stata SE 16.1 (StataCorp LP, College Station, TX, http://www.stata.com) and R 3.6.2 (https://www.r-project.org) software. Details of the statistical analysis are reported in “Methods” of the supplemental Material.
Results
Clonal features and risk of progression to an MN in patients with cytopenia of undetermined significance
In the prospective cohort of 311 patients with ICUS, we performed sequential mutation analyses, and studied the relationships between mutation features (that is, mutated driver genes, variant allele frequency [VAF], and clonal dynamics), and clinical outcome.
Overall, 92 of the 311 patients (30%) carried at least 1 genetic lesion that led to a diagnosis of CCUS: 87 patients carried 1 or more somatic mutations, whereas 5 patients with no mutations harbored a cytogenetic abnormality (Table 2; supplemental Table 2; supplemental Figure 2). Median VAF was 0.27 (range 0.02-0.55; Figure 1; supplemental Figure 3).
Clinical and hematological features of patients with cytopenia of undetermined significance according to mutation status
| Variable | Total | Unmutated (ICUS) | Mutated (CCUS) |
|---|---|---|---|
| Patients, n | 311 | 219 | 92 |
| Sex. male/female | 144/167 | 94/125 | 50/42 |
| Age. y, median (range) | 58 (19-89) | 53 (19-89) | 68 (32-87) |
| Hb, g/dL, median (range) | 12.7 (5.9-16.4) | 12.5 (5.9-16.4) | 12.9 (8.9-16.1) |
| MCV, fL, median (range) | 91.9 (61.7-121.0) | 91.9 (61.7-121.0) | 91.2 (76.9-113.0) |
| WBC, ×109/L, median (range) | 3.48 (0.87-16.0) | 3.5 (0.87-10.6) | 3.4 (1.2-16.0) |
| ANC, ×109/L, median (range) | 1.63 (0.05-10.9) | 1.61 (0.05-7.42) | 1.70 (0.36-10.9) |
| PLT, ×109/L, median (range) | 152 (10-917) | 152 (26-559) | 150.5 (10-917) |
| Number of cytopenic lineages, 1/2/3 (%) | 54/33/13 | 56/31/13 | 53/35/12 |
| BM blasts (%), median (range) | 2 (0-3) | 2 (0-3) | 2 (0-3) |
ANC, absolute neutrophil count; BM, bone marrow; Hb, hemoglobin; MCV, mean corpuscular volume; PLT, platelet; WBC, white blood cell.

Distribution of VAF throughout the spectrum of clinical phenotypes. (A) Distribution of VAFs in individuals with CHIP (n = 70); (B) in individuals with unexplained anemia and clonal hematopoiesis (CH-AoE; n = 49); (C) in patients with CCUS (n = 87); and (D) in patients with MN (n = 518). For the purpose of this analysis, maximum VAF was analyzed in patients harboring ≥2 mutations.
Distribution of VAF throughout the spectrum of clinical phenotypes. (A) Distribution of VAFs in individuals with CHIP (n = 70); (B) in individuals with unexplained anemia and clonal hematopoiesis (CH-AoE; n = 49); (C) in patients with CCUS (n = 87); and (D) in patients with MN (n = 518). For the purpose of this analysis, maximum VAF was analyzed in patients harboring ≥2 mutations.
A significant association was found between mutation status and cumulative incidence of progression to MN estimated with a competing-risk approach (HR, 4.9; P < .001). In addition, a significant association was found between cumulative incidence of progression and number of mutations per subject (HR, 1.9; P < .001). When patients with somatic mutations were compared with those with no mutations, the risk increase was marginal in patients with 1 somatic mutation (HR, 2.8; P = .045), whereas it was marked in those with 2 or more mutations (HR, 7.9; P < .001). Significant associations were also found between mutated driver genes and risk of progression to MN, with patients harboring mutant splicing factors, ASXL1, or TET2 showing significantly increased risks (HR, 7.4, 4.2, and 3.7, respectively; P < .005). Conversely, no significant risk was found in patients carrying a DNMT3A mutation (supplemental Figure 4).
A significant association was found between VAF and cumulative incidence of progression to MN (HR, 11.6; P = .03). The risk of progression did not differ from that of patients with no mutations in subjects with VAF < 0.10 (P = .74), whereas it was significantly increased in those with VAF ≥ 0.1 (HR, 7.5; P < .001; supplemental Figure 4).
Clonal dynamics in patients with cytopenia of undetermined significance and transition to an MN
Ninety patients were sequentially studied during follow-up, including 44 patients with ICUS and nonmutated status at the time of diagnosis and 46 with CCUS. Sixty-three of the 90 patients (37 ICUS and 26 CCUS) had a repeated sequencing analysis in a stage of cytopenia of undetermined significance (median time between samples 28 months; range, 3-180). Two of 37 patients with nonmutated ICUS acquired mutations in TET2 36 and 76 months after their first assessment, whereas 5 of the 26 patients with CCUS acquired additional mutations in DNMT3A, PTPN11, TP53, RUNX1, and JAK2 (median VAF, 0.07; range, 0.03-0.12), without clinically significant changes in their blood and marrow findings. In patients with stable mutation status, a median change in VAF of 0.05 was noted over a median time of 33 months.
Twenty patients with CCUS were sequentially investigated at the time of progression to MN. In 7 patients, clinical progression was associated with the acquisition of additional somatic mutations (median, 2; range 1-3). Conversely, in the remaining 13 patients, clinical evolution was associated with clonal expansion without acquisition of additional mutations (median increase in VAF, 0.10; range, 0.03-0.39). Seven patients who had ICUS with no detectable genetic lesion at the first assessment progressed to MN. At the time of evolution, 2 of them showed mutant TET2- and NPM1-driven dominant clones, and 3 acquired cytogenetic abnormalities, including del(7q), monosomy 7, and del(13q).
Mutation profiles and clone size in community-dwelling persons with or without anemia
We analyzed somatic mutation profiles in community-dwelling individuals aged ≥60 years recruited from population-based studies, including 177 subjects with AoE and 355 subjects without any hematologic phenotype (supplemental Tables 3 and 4; supplemental Figure 2).
A significantly higher prevalence of CH was found in anemic subjects compared with those without anemia (27.7% vs 19.7%; P = .045). This difference was higher when individuals with borderline red cell values were excluded (ie, hemoglobin, 12.5-13.0 and 11.5-12.0 g/dL in males and females, respectively; 33.9% vs 19.7%; P = .015). A significantly higher proportion of individuals with multiple mutations was observed in anemic subjects compared with those without anemia (9.6% vs 3%; P = .003). Median VAF in anemic subjects with CH was 0.07 (range, 0.02-0.48), with no significant difference compared with nonanemic subjects (P = .9; Figure 1; supplemental Figure 3).
No significant difference in the prevalence of mutations in DNMT3A, TET2, or ASXL1 (DTA genes) was observed between anemic and nonanemic individuals (P = .68-.36). Conversely, a significantly higher prevalence of mutations in genes other than DTA and of mutations in SF3B1 and other splicing factors, was found in anemic subjects (P = .01-.002). In addition, a significantly higher prevalence of comutation of DTA and other genes was found in anemic individuals (P = .03), and a similar prevalence of multiple DTA mutations was found in the 2 groups (P = .45).
A multivariable regression analysis of data from the whole cohort of community-dwelling individuals showed that SF3B1 mutations and comutations of DTA genes with other genes were independent predictors of anemia (P = .02 and P = .01, respectively).
Distribution of mutation patterns throughout the spectrum of clinical phenotypes
We analyzed clone features, including the number of mutations per subject, VAFs, and mutation patterns throughout the spectrum of clinical phenotypes, including CHIP, CH plus anemia (CH-AoE), CCUS (hereafter referred to as premalignant conditions) and MN, with the purpose of recognizing mutation patterns predictive of MN, even in the absence of overt dysplasia. For this purpose, genotypes were cataloged based on gene ontology classification, involving DNMT3A, TET2, or ASXL1; splicing factors SF3B1, SRSF2, or U2AF1; TP53; or other drivers (Figure 2).13,22,23
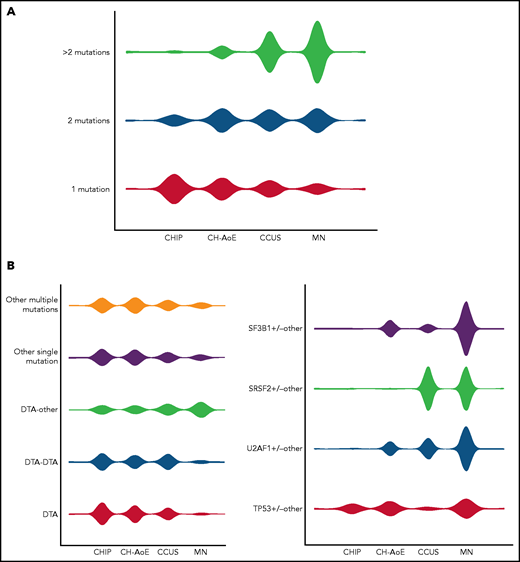
Distribution of mutation patterns in the cohorts included in the study. (A) Distribution of genotype complexity according to the number of mutations per subject in individuals with CHIP; unexplained anemia; CH-AoE, CCUS, and MN. (B) Distribution of distinct mutation patterns in individuals with CHIP, CH-AoE, CCUS, and MN. For this purpose, genotypes were cataloged based on gene ontology classification involving DTA, splicing factors, TP53, and other drivers. Distributions were calculated as proportions of the total number of cases with the genotype under consideration, to provide a measure of the relative frequency by which the same genotype may exhibit different clinical phenotypes.
Distribution of mutation patterns in the cohorts included in the study. (A) Distribution of genotype complexity according to the number of mutations per subject in individuals with CHIP; unexplained anemia; CH-AoE, CCUS, and MN. (B) Distribution of distinct mutation patterns in individuals with CHIP, CH-AoE, CCUS, and MN. For this purpose, genotypes were cataloged based on gene ontology classification involving DTA, splicing factors, TP53, and other drivers. Distributions were calculated as proportions of the total number of cases with the genotype under consideration, to provide a measure of the relative frequency by which the same genotype may exhibit different clinical phenotypes.
A significantly different number of mutations per subject, different distribution of mutated genes, and varying VAFs were observed between the conditions (P < .001; Figures 1 and 2A; supplemental Figure 5). No significant difference was found in the distribution of mutation hotspots in DNMT3A, SF3B1, and U2AF1. A significantly different distribution of mutation patterns was observed in the phenotype categories (Figure 2B; supplemental Table 5). Selected mutation patterns showed high specificity and positive predictive value (PPV) for MN, including SF3B1 mutations and comutation patterns involving SF3B1, U2AF1, or TP53 with other genes (P < .001-.03; specificity, 0.98-1.00; PPV, 0.91-1.00). In addition, other patterns were significantly enriched in MN, including comutation of DTA with other genes, comutation of SRSF2 with other genes, or comutations involving other genes (specificity, 0.88-0.98; PPV, 0.70-0.87; Figure 2B; supplemental Table 5). Conversely, mutation patterns involving isolated or multiple DTA mutations, or isolated mutations of genes other than DTA/splicing factors/TP53, were significantly enriched in premalignant conditions (P < .001; Figure 2; supplemental Table 5).
Unsupervised clustering analysis throughout the spectrum of clinical phenotypes
We applied unsupervised clustering analysis based on somatic driver mutations to identify homogeneous groups across phenotype categories, including CHIP, CH-AoE, CCUS, and MN without excess blasts. This analysis identified 2 main clusters, showing a significantly different number of mutations per subject and VAF (P < .001; Figure 3; supplemental Table 6). The first cluster mainly comprised individuals with clones driven by isolated DNTM3A mutations (hereafter referred to as CH-like cluster). In addition, a fraction of individuals with DNMT3A associated with additional comutated genes segregated within this cluster. Conversely, the second cluster mainly comprised individuals with mutation profiles involving splicing factors, TP53, or DTA genes in combination with additional mutated genes (MN-like cluster). Individuals with isolated TET2 or ASXL1 mutations, as well as those with isolated mutations in SF3B1 or other less frequently mutated genes, were classified within the MN-like cluster, at odds with those harboring isolated DNMT3A mutations. Isolated TET2 or ASXL1 mutations showed significantly higher VAFs compared with isolated DNMT3A mutations across all the phenotype categories (P < .001) and were significantly more frequent than isolated DNMT3A in the MN category (P < .001).
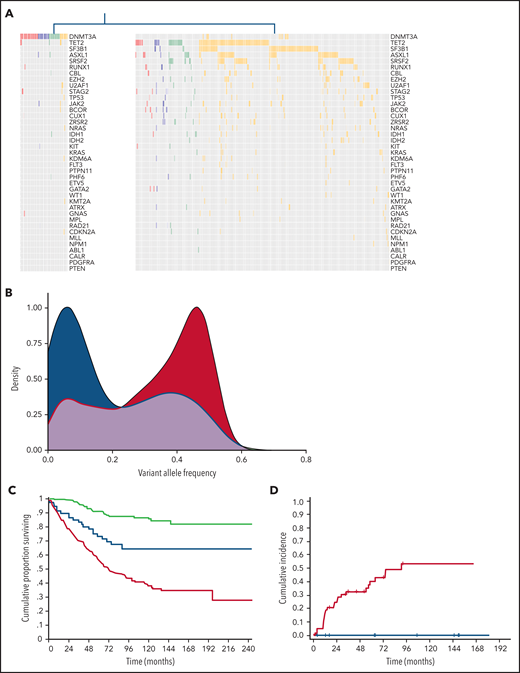
Distinct clusters identified based on genetic profiles throughout the spectrum of clinical phenotypes. (A) Mutation profiles of clusters identified by unsupervised clustering analysis based on genetic profiles throughout the spectrum of clinical phenotypes: CH-like cluster (left) and MN-like cluster (right). (B) Distribution of VAFs of mutation patterns in the 2 clusters identified by the unsupervised clustering analysis (CH-like cluster, blue curve; MN-like cluster, red curve). (C) Overall survival of the 2 clusters identified by the unsupervised clustering analysis (CH-like cluster, blue curve; MN-like cluster, red curve) and of individuals with no mutations (green curve). (D) Cumulative incidence of progression to MN estimated with a competing-risk approach within the CCUS cohort segregated based on unsupervised analysis (CH-like cluster, blue curve; MN-like cluster, red curve).
Distinct clusters identified based on genetic profiles throughout the spectrum of clinical phenotypes. (A) Mutation profiles of clusters identified by unsupervised clustering analysis based on genetic profiles throughout the spectrum of clinical phenotypes: CH-like cluster (left) and MN-like cluster (right). (B) Distribution of VAFs of mutation patterns in the 2 clusters identified by the unsupervised clustering analysis (CH-like cluster, blue curve; MN-like cluster, red curve). (C) Overall survival of the 2 clusters identified by the unsupervised clustering analysis (CH-like cluster, blue curve; MN-like cluster, red curve) and of individuals with no mutations (green curve). (D) Cumulative incidence of progression to MN estimated with a competing-risk approach within the CCUS cohort segregated based on unsupervised analysis (CH-like cluster, blue curve; MN-like cluster, red curve).
Similar results were obtained when patients with MN who had increased blast count were included in the analysis and cytogenetic abnormalities in clustering were accounted for (data not shown).
We analyzed the impact of the 2 unsupervised clusters on the clinical outcome of individuals throughout the spectrum of phenotype categories. The 2 clusters showed a significantly different overall survival (OS) in both univariable and multivariable analysis adjusted for demographic and hematologic variables (HR, 1.8; P < .001; Figure 3C). Among the patients with CCUS, a significantly different cumulative incidence of progression to MN, estimated with a competing-risk approach, was observed between the CH- and MN-like clusters in both univariable and multivariable analyses (HR, 2.73; P < .001; Figure 3D).
We then performed multivariable analysis to identify variables affecting clinical outcome within the 2 clusters. Within the MN-like cluster, no significant effect of the clinical diagnosis was found (HR, 1.26; P = .12), suggesting that the MN-like genetic signature was the major determinant of clinical outcome, and that this signature identified a homogeneous group with features similar to those with MN, even within the premalignant categories. Among community-dwelling individuals (CHIP and CH-AoE), those with an MN-like signature showed a significantly lower OS than the controls or individuals with CH-like signature in univariable analysis (HR, 1.92; P = .04; supplemental Figure 6). However, in multivariable analysis, MN-like genotypes did not retain an independent prognostic value (P = .3).
Conversely, a significant effect of the clinical diagnosis was found within the CH-cluster (HR, 2.75; P = .01), in which patients with MN had a lower OS than those in other categories, whereas those with the premalignant conditions (CHIP, CH-AoE, and CCUS) had a comparable OS (P = .54).
Association between clone size and clinical expressivity in distinct mutation patterns
To investigate the variables that contribute to the classification into different phenotype categories of clones driven by homogeneous mutation patterns, we focused on the effect of the VAF of distinct mutation patterns on their clinical expressivity, measured as degree of bone marrow dysplasia and anemia. Although community-dwelling individuals with CH did not undergo bone marrow investigations, they were pooled together with patients with CCUS in a single category of premalignant conditions for the purpose of this analysis.
Significant differences in VAF were observed in all the mutation pattern categories (P < .01 to P < .001; Figure 4A; supplemental Figure 7, supplemental Table 7).

Association between clone metrics and clinical phenotype. (A) Distribution of VAF of mutation patterns in premalignant conditions (including CHIP, unexplained anemia, clonal hematopoiesis, CH-AoE, and CCUS) (red) and MN (blue). (B) Association between VAF and myelodysplasia in distinct genotypes. For this analysis, a VAF cutoff of the mutation pattern under analysis was adopted that was associated with overt myelodysplasia with 90% specificity; that is, the VAF that was almost invariably associated with dysplasia.
Association between clone metrics and clinical phenotype. (A) Distribution of VAF of mutation patterns in premalignant conditions (including CHIP, unexplained anemia, clonal hematopoiesis, CH-AoE, and CCUS) (red) and MN (blue). (B) Association between VAF and myelodysplasia in distinct genotypes. For this analysis, a VAF cutoff of the mutation pattern under analysis was adopted that was associated with overt myelodysplasia with 90% specificity; that is, the VAF that was almost invariably associated with dysplasia.
We performed ROC analyses to identify the VAF cutoff predictive of MN within each genotype category. For this purpose, we adopted the VAF cutoff that was associated with overt myelodysplasia (ie, dysplasia in 10% or more of myeloid cells, according to World Health Organization criteria) with specificity equal or higher than 90%. We found that this threshold was significantly different across mutation patterns (P < .001; Figure 4B; supplemental Figure 8). Among the MN-like patterns, the VAF cutoff associated with overt dysplasia was <0.20 (range, 0.17-0.19) for patterns involving the DTA genes and SF3B1 or TP53, with additional comutated genes, consistent with high clinical expressivity (mutation patterns with high clinical expressivity). For patterns involving SRSF2, isolated or multiple DTA mutations, or other isolated or multiple mutations, the VAF cutoffs associated with dysplasia were higher than 0.30, consistent with the larger or full clonal dominance necessary to cause overt bone marrow dysplasia (mutation patterns with low clinical expressivity; Figure 4B).
We also analyzed the correlation between VAF and the degree of dysplasia categorized as absent (<10% bone marrow dysplastic cells), mild (10% to 20%), moderate (20% to 50%), or severe (>50%). Overall, a significant positive correlation was found between VAF and dysplasia (P < .001). Significant correlations were observed in patterns with high clinical expressivity (P < .001 to P < .03; supplemental Table 8), whereas no correlation was found in patterns with low clinical expressivity, in which even high VAFs were associated with mild dysplasia.
Finally, we investigated the correlation between VAF and the severity of anemia. Overall, a significant negative correlation was found between VAF and hemoglobin value (P < .001). Significant correlations were found for comutation patterns combining DTA genes, SF3B1, and TP53 with other subclonal mutations (P < .001 to P < .03; supplemental Figure 9).
Clone metrics segregate distinct subsets of clonal cytopenia
Among patients with CCUS, the MN-like cluster showed a significantly higher VAF than the CH-like one (median, 0.21 vs 0.07; P = .01; Figure 5A). To further investigate clone features within the MN-like cluster, we focused on distinct mutation patterns and relative VAFs, hereafter referred to as clone metrics. Based on the mutation pattern, we recognized 3 distinct subsets with significantly different VAFs (P < .001; Figure 5B).
![Distinct subsets of clonal cytopenia of undetermined significance segregated by unsupervised clustering and clone metrics. (A) Distribution of VAF of the subsets of CCUS, according to the unsupervised analysis: CH-like cluster (green); and MN with myelodysplasia (MDS)-like subset (orange). (B) Distribution of VAFs of the subsets of CCUS recognized within the MN-like cluster based on clone metrics: MN-like subset characterized by patterns with high clinical expressivity (blue); MN-like subset characterized by mutation patterns with low clinical expressivity (maroon); MN-like subset characterized by isolated TET2, ASXL1, or less frequently mutated genes (gray). (C) Cumulative incidence of progression to MN estimated with a competing risk approach in CCUS subsets segregated based on unsupervised analysis and clone metrics (CH-like cluster, [green curve]; MN-like subset driven by isolated TET2, ASXL1, or less frequently mutated genes [gray curve]; subset with MN-like patterns with high clinical expressivity [orange curve]; and subset with MN-like patterns with low clinical expressivity [maroon curve]). Overall, 25 patients with CCUS progressed to MN, accounting for 0%, 17%, 27%, and 55% of the CH-like cluster, MN-like subset driven by isolated TET2, ASXL1 or less frequently mutated genes, MN-like subset with high clinical expressivity, and MN-like subset with low clinical expressivity, respectively.](https://ash.silverchair-cdn.com/ash/content_public/journal/blood/138/11/10.1182_blood.2021011323/4/m_bloodbld2021011323f5.png?Expires=1765895361&Signature=LE1sfz0hgn3CG~wW87FM1WEnV-d3dkfM7IhmjdenVnLlJEWZSl1Rz2XL6oiH60sTMx75ne7vcqfNMkXlE9C-htMDtz5En~MeW3Thl72IZGwTjUvj-fVyDplyQAoJgB986Ljg4Uw24QsVddRIINOyVpfGnaWP0Kq7AWeDpC3fIs4N513FKKOIS1LRQ3oMXAvf-7N2aJ0hsNG-J8l~2nUAjiwzHb3sijBHjbelVSamxQiHDqGCEMaVlU1OZZAdIWBYhqdCS00JgdZpKezJ1xfoEKmv~-53mZWrNztxOfM4giULdVD~64wUFrsQs4MwWqgPVinnNyfaXrR-YnG0e~Ubag__&Key-Pair-Id=APKAIE5G5CRDK6RD3PGA)
Distinct subsets of clonal cytopenia of undetermined significance segregated by unsupervised clustering and clone metrics. (A) Distribution of VAF of the subsets of CCUS, according to the unsupervised analysis: CH-like cluster (green); and MN with myelodysplasia (MDS)-like subset (orange). (B) Distribution of VAFs of the subsets of CCUS recognized within the MN-like cluster based on clone metrics: MN-like subset characterized by patterns with high clinical expressivity (blue); MN-like subset characterized by mutation patterns with low clinical expressivity (maroon); MN-like subset characterized by isolated TET2, ASXL1, or less frequently mutated genes (gray). (C) Cumulative incidence of progression to MN estimated with a competing risk approach in CCUS subsets segregated based on unsupervised analysis and clone metrics (CH-like cluster, [green curve]; MN-like subset driven by isolated TET2, ASXL1, or less frequently mutated genes [gray curve]; subset with MN-like patterns with high clinical expressivity [orange curve]; and subset with MN-like patterns with low clinical expressivity [maroon curve]). Overall, 25 patients with CCUS progressed to MN, accounting for 0%, 17%, 27%, and 55% of the CH-like cluster, MN-like subset driven by isolated TET2, ASXL1 or less frequently mutated genes, MN-like subset with high clinical expressivity, and MN-like subset with low clinical expressivity, respectively.
Distinct subsets of clonal cytopenia of undetermined significance segregated by unsupervised clustering and clone metrics. (A) Distribution of VAF of the subsets of CCUS, according to the unsupervised analysis: CH-like cluster (green); and MN with myelodysplasia (MDS)-like subset (orange). (B) Distribution of VAFs of the subsets of CCUS recognized within the MN-like cluster based on clone metrics: MN-like subset characterized by patterns with high clinical expressivity (blue); MN-like subset characterized by mutation patterns with low clinical expressivity (maroon); MN-like subset characterized by isolated TET2, ASXL1, or less frequently mutated genes (gray). (C) Cumulative incidence of progression to MN estimated with a competing risk approach in CCUS subsets segregated based on unsupervised analysis and clone metrics (CH-like cluster, [green curve]; MN-like subset driven by isolated TET2, ASXL1, or less frequently mutated genes [gray curve]; subset with MN-like patterns with high clinical expressivity [orange curve]; and subset with MN-like patterns with low clinical expressivity [maroon curve]). Overall, 25 patients with CCUS progressed to MN, accounting for 0%, 17%, 27%, and 55% of the CH-like cluster, MN-like subset driven by isolated TET2, ASXL1 or less frequently mutated genes, MN-like subset with high clinical expressivity, and MN-like subset with low clinical expressivity, respectively.
The first subset (22% of patients) was characterized by mutation patterns with high clinical expressivity, including patterns involving SF3B1, U2AF1, or TP53, as well as DTA genes associated with additional mutations. The VAFs in these cases were below the thresholds associated with overt dysplasia, significantly lower than those observed in MNs with a similar mutation profile (P < .001), consistent with an early phase of malignant clones that have not yet reached complete clinical expressivity. All the patients within this subset had clonal expansion without acquisition of additional mutations at the time of progression to MN.
The second subset (45% of patients) comprised clones with mutation patterns with low clinical expressivity, mainly involving SRSF2 mutations, combination of DTA gene mutations or multiple mutations in genes other than DTA/splicing factors/TP53. The VAFs of this subset were significantly higher than those of the subset with high clinical expressivity (P = .002; Figure 5B) and comparable to those observed in MN with similar mutation profiles (P = .71). Notably, in MN, these mutation patterns were typically associated with mild dysplasia (ie, 10% to 20% of dysplastic cells) even at the stage of fully dominant clones. Within this subset, 5 of 15 patients acquired additional mutations at the time of progression to MN.
In multivariable analyses adjusted for demographic and hematologic covariates, the 2 subsets with high or low clinical expressivity showed a significantly higher cumulative incidence of progression to MN compared with individuals without mutation or with CH-like signature (HR, 5.02 and HR, 11.28, respectively, P < .001; Figure 5C). Conversely, no significant difference in OS was noted between these CCUS subsets and MN with similar mutation profiles (P = .20 and .27, respectively).
Finally, a third subset was identified, including isolated mutations in TET2 and ASXL1 or in genes other than splicing factors/DTA/TP53 (25% of patients). VAFs of this subset did not differ significantly from those of the CH-like cluster (P = .78; Figure 5B), whereas they were significantly lower than those observed in MN with the same drivers (P = .002). No significant difference in OS was found between this subset and the CH-like cluster (P = .56), whereas a marginally higher cumulative incidence of progression to MN was noted (P = .06; Figure 5C).
Discussion
In this study, we sequentially analyzed a prospective cohort of patients with CCUS and found that this condition is characterized by genetic features intermediate between CHIP and MN, including frequency of mutated genes and their VAF distribution.11-13 While these findings are consistent with the notion of CCUS as a transition state between CHIP and MN, they also unveil a genetic heterogeneity that may conceal variable potential of evolution. Acquisition of additional genetic hits and clonal expansion may play a role in the evolution into overt malignancy; however, the clonal dynamics through the CCUS stage has remained elusive so far. Therefore, we studied distinct cohorts covering the whole spectrum of hematologic phenotypes, with the aim of gaining deeper insight into the clinical expressivity of mutant clones and the dynamics of transition from premalignant to malignant stages. The combination of these cohorts provided a unique source of information that enabled measurement of the expressivity of distinct driver mutation patterns and establishment of precise correlations between clone metrics and hematologic phenotype.
In agreement with previous studies, we observed a different distribution of mutation patterns and VAFs throughout the spectrum of clinical stages.2,4,5,10,13 However, although selected genotypes are almost exclusively represented in MN, pointing to high specificity for a fully malignant phenotype,13,24 most recurrent patterns are detected throughout the range of clinical phenotypes. We applied unsupervised clustering to identify homogeneous genotype-defined groups, irrespective of current clinical staging. This approach segregated 2 major clusters: one mainly comprising individuals with isolated DNTM3A mutations and the other including individuals with more complex profiles, as well as isolated mutations in TET2, ASXL1, and other less frequent drivers. In our study, in the context of clonal cytopenias, isolated DNTM3A mutations did not show a difference in VAFs compared with individuals with CHIP or significant impact on survival and risk of progression to MN, questioning a causative role in cytopenia. Accordingly, a recent longitudinal study showed that DNMT3A mutation-driven clones were characterized by the lowest expansion rate and probability of acquiring additional mutations, without association with anemia in elderly subjects.9 Conversely, the MN-like signature identified a homogeneous group similar to MN within premalignant categories. In line with this finding, previous studies reported higher risk of AML in community-dwelling individuals carrying these mutation patterns.25,26 We also found a fraction of community-dwelling individuals harboring MN-like mutation patterns,9 suggesting that in a portion of elderly individuals, unexplained anemia may be an early clinical expression of a malignant clone. Collectively, these results point toward a segregation of premalignant states as either age-related clones without obvious role in cytopenia or malignant clones with mild clinical expression.
To gain a better understanding of clonal features affecting the clinical expressivity of MN-like patterns, we analyzed the correlations of mutation patterns and their VAFs with the hematologic variables relevant to clinical classification, including the degree of bone marrow dysplasia and anemia. Within the analyzed genotypes, we found a widely variable magnitude in the association between VAF and dysplasia assessed by morphological analysis. Mutation patterns involving SF3B1 or TP53 mutations, as well as DTA genes with additional comutated genes, are consistently associated with overt dysplasia at VAF <0.20, suggesting that these genetic lesions are resulting in an overt dysplastic phenotype since the early phase of their trajectory. Conversely, other genotypes, including isolated or multiple DTA gene mutations, as well as patterns involving SRSF2, are characterized by low clinical expressivity and require full dominance, to result in overt dysplasia in the clinical setting. These results are consistent with clinical and experimental studies reporting different degrees of ineffective hematopoiesis induced by distinct drivers, as well as interdependencies among genetic lesions and morphologic abnormalities.27-32
We integrated mutation profiles and related significant VAFs into clone metrics to inform the clinical appraisal of clonal cytopenias. In a previous study, we were able to segregate individuals with CCUS in 2 groups, based on high and low predictive mutation patterns.13 The findings of current study confirm and expand this observation, enabling us to further refine this categorization and providing justification for the clinical classification as cytopenia of uncertain significance. In fact, we recognized a CHIP-like cluster with low risk of evolution, not dissimilar from that of nonmutated ICUS cases. Then, within the cluster with MN-like signature, we identified a subset driven by mutation profiles characterized by high clinical expressivity, which were detected at low VAFs in patients with CCUS, consistent with an early phase of the trajectory of malignant clones that have not yet reached full clinical expressivity. A second subset included cases with dominant clones driven by mutation patterns shown to be characterized by low clinical expressivity with clone metrics similar to those of overt MN, suggesting that morphological analysis of bone marrow dysplasia does not capture distinct phases of the trajectory of these clones.
Taken together, these results highlight the limitation of bone marrow dysplasia as a criterion to segregate relevant stages of evolution of hematopoietic clones eventually resulting in MN. Selected mutation signatures appear to be candidate classification criteria providing evidence of MN, irrespective of significant dysplasia, thus enabling detection of malignant clones, even at earlier stages with mild clinical expression. Conversely, other genotypes, mainly including isolated DTA mutations, appear to be distributed more among premalignant and malignant stages. Although these drivers were segregated by the unsupervised analysis into distinct clusters, likely reflecting a different potential of evolution into MN, significant variations in VAFs were consistently noted between different stages, suggesting that extraclonal factors may concur with expansion, gain of clinical expressivity, and potential of evolution of these clones.25,33,34 Although the implementation of VAF for clinical staging may raise some concerns about reproducibility, at this stage both phenotype variables and clone metrics appear to be necessary for classification of these clones.
In summary, the findings of our study unveiled a marked variability in the clinical expressivity of mutated driver genes in precursor conditions leading to MN, underscoring the limitations of morphologic dysplasia for clinical staging of mutant clones, and identifying clinically relevant genetic clusters within currently defined precursor conditions. Whereas selected genotypes have the potential to provide evidence of bona fide MN, clone metrics appears to be critical for informing clinical decision making in patients with clonal cytopenia.
Acknowledgments
This study was supported by the Associazione Italiana per la Ricerca sul Cancro (AIRC), Milan, Italy (Investigator Grant 20125 [L.M.], AIRC 5x1000 Project 21267, and International Accelerator Project 22796).
Authorship
Contribution: A.G. performed mutation analysis and contributed to the study design and interpretation of the data; G.T. collected clinical data and samples and contributed to study design, statistical analysis, and interpretation of the data; E.C., C.S., C.E., E. Bono, E. Boveri, J.F., and N.F., collected clinical data and samples; E.M., S.Z., and M.S. analyzed sequencing data; S.P., V.V.F., and E.R. performed data management and biostatistical and bioinformatic analyses; P.G., C.C., D.T., and M.C. contributed to study design and interpretation of the data; L.M. designed the study, performed the statistical analyses, and wrote the manuscript; and all authors contributed to preparation of the manuscript and approved its content.
Conflict-of-interest disclosure: The authors declare no competing financial interests.
Correspondence: Luca Malcovati, Department of Molecular Medicine, University of Pavia, Pavia 27100, Italy; e-mail: luca.malcovati@unipv.it.
Proposals for access to deidentified data can be addressed to the corresponding author (luca.malcovati@unipv.it).
The online version of this article contains a data supplement.
There is a Blood Commentary on this article in this issue.
The publication costs of this article were defrayed in part by page charge payment. Therefore, and solely to indicate this fact, this article is hereby marked “advertisement” in accordance with 18 USC section 1734.

This feature is available to Subscribers Only
Sign In or Create an Account Close Modal