

Page 971: In Figure 3B, there are errors that were introduced during the publication process. The green area should be pale purple, representing the overlap between the distribution of variant allele frequencies of mutation patterns in the 2 clusters identified by the unsupervised clustering analysis (CH-like cluster, blue curve; MN-like cluster, red curve); accordingly, the black border at the bottom of the red (MN-like cluster) area should be blue. The corrected Figure 3B is shown below.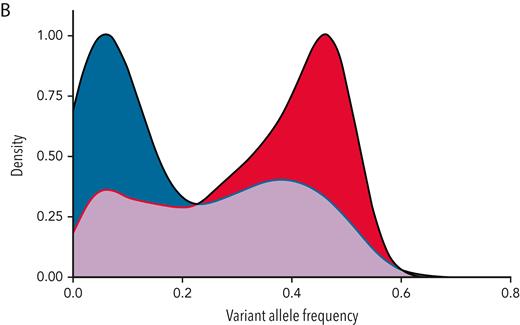
Figure 3B

The publisher apologizes for the errors, which have been corrected in the online version of the article.

This feature is available to Subscribers Only
Sign In or Create an Account Close Modal