

Key Points
Genomic testing leads to improved risk assignment in most adult patients with BCR-ABL1− B-ALL.
Antigen profiles affect outcome in B-ALL when considered in conjunction with genomic subtype.

Abstract
Genomic classification has improved risk assignment of pediatric, but not adult B-lineage acute lymphoblastic leukemia (B-ALL). The international UKALLXII/ECOG-ACRIN E2993 (#NCT00002514) trial accrued 1229 adolescent/adult patients with BCR-ABL1− B-ALL (aged 14 to 65 years). Although 93% of patients achieved remission, 41% relapsed at a median of 13 months (range, 28 days to 12 years). Five-year overall survival (OS) was 42% (95% confidence interval, 39, 44). Transcriptome sequencing, gene expression profiling, cytogenetics, and fusion polymerase chain reaction enabled genomic subtyping of 282 patient samples, of which 264 were eligible for trial, accounting for 64.5% of E2993 patients. Among patients with outcome data, 29.5% with favorable outcomes (5-year OS 65% to 80%) were deemed standard risk (DUX4-rearranged [9.2%], ETV6-RUNX1/-like [2.3%], TCF3-PBX1 [6.9%], PAX5 P80R [4.1%], high-hyperdiploid [6.9%]); 50.2% had high-risk genotypes with 5-year OS of 0% to 27% (Ph-like [21.2%], KMT2A-AFF1 [12%], low-hypodiploid/near-haploid [14.3%], BCL2/MYC-rearranged [2.8%]); 20.3% had intermediate-risk genotypes with 5-year OS of 33% to 45% (PAX5alt [12.4%], ZNF384/-like [5.1%], MEF2D-rearranged [2.8%]). IKZF1 alterations occurred in 86% of Ph-like, and TP53 mutations in patients who were low-hypodiploid (54%) and BCL2/MYC-rearranged (33%) but were not independently associated with outcome. Of patients considered high risk based on presenting age and white blood cell count, 40% harbored subtype-defining genetic alterations associated with standard- or intermediate-risk outcomes. We identified distinct immunophenotypic features for DUX4-rearranged, PAX5 P80R, ZNF384-R/-like, and Ph-like genotypes. These data in a large adult B-ALL cohort treated with a non–risk-adapted approach on a single trial show the prognostic importance of genomic analyses, which may translate into future therapeutic benefits.
Introduction
Despite recent advances in therapeutic options for patients with B-lineage acute lymphoblastic leukemia (B-ALL), treatment of adults remains challenging because of a high incidence of adverse prognostic factors and poorer tolerance of intensive therapy. The Medical Research Council (MRC), now National Cancer Research Institute, UKALLXII/ECOG-ACRIN Cancer Research Group E2993 trial (ClinicalTrials.gov; #NCT00002514) accrued 1229 adult patients with BCR-ABL1− B-ALL between 1993 and 2006.1-3 Among these patients, 41% of cases with successful cytogenetics had recurrent genetic abnormalities: t(v;11q23) (rearrangement of KMT2A/MLL), t(12;21)(p13;q22) (ETV6-RUNX1), t(1;19)(q23;p13.3) (TCF3-PBX1), t(5;14)(q31;q32) (IGH-IL3), or aneuploidy.4 Thus, in adult BCR-ABL1− B-ALL, the majority of patients historically fell into the category of B-ALL not otherwise specified.5
Incorporation of measurable residual disease (MRD) to improve risk stratification, use of pediatric-inspired regimens for young adults, and the advent of targeted therapies, including monoclonal antibodies and chimeric antigen-receptor T cells, have redefined the therapeutic paradigm of ALL.6 The genomic revolution has also led to improved categorization of B-ALL.7-10 In particular, the Ph-like (BCR-ABL1-like) phenotype, characterized by a gene-expression profile similar to BCR-ABL1–positive ALL (BCR-ABL1 ALL) but with non–BCR-ABL1 genetic alterations activating kinase signaling or alterations of lymphoid transcription factor genes,11-14 has poor prognosis in both children and adults.15-20 Because of their prognostic impact, Ph-like and hypodiploid B-ALL have been added as provisional entities to the World Health Organization classification of ALL.21,22
In light of these advances, we explored the clinical outcomes of the largest cohort ever reported of adult BCR-ABL1− B-ALL, who were treated without any risk-adapted modifications, on the UKALLXII/E2993 trial. In parallel, we performed genomic analysis of E2993 patients to gain insight into associations of novel genotypes with treatment response.
Methods
Patient identification and treatment design
The MRC enrolled 820 and ECOG-ACRIN 409 patients with BCR-ABL1− B-ALL. Immunophenotyping and polymerase chain reaction (PCR) for known fusions were performed centrally for E2993 patients (supplemental Material, available on the Blood Web site), whereas the MRC centrally reviewed institutional immunophenotyping. Local cytogenetic data were reviewed centrally.4 Chemotherapeutic regimens of the trial have been described.1-3,23 Patients >35 years of age or with a white blood cell (WBC) count >30 × 109/L at presentation were designated high risk. The institutional review board of participating centers approved this study, and informed consent was obtained in accordance with the Declaration of Helsinki.
Genomic profiling
Transcriptome sequencing (RNA-seq) was performed on 238 samples using TruSeq library preparation and HiSeq 2000/2500 or NovaSeq 6000 sequencers (Illumina). All sequence reads were paired-end, and sequencing was performed using the following: (1) total RNA and stranded RNA-seq (100 base-pair reads) or (2) poly A-selected messenger RNA (100-base-pair reads). Methods for RNA-seq processing and analysis are detailed in the supplemental Material. In a complementary approach, a 15-gene Taqman quantitative reverse transcription–PCR low-density array (LDA)15,24,25 that identifies the Ph-like ALL gene signature, P2RY8-CRLF2, BCR-ABL1, ETV6-RUNX1, TCF3-PBX1, KMT2A-rearranged, and DUX4-rearranged ALL was performed on 210 samples.
To determine copy number alterations (CNAs), including focal deletions, single-nucleotide polymorphism analysis was performed on 129 of 282 samples with available DNA using either single-nucleotide polymorphism 60 microarrays (Affymetrix; n = 47) or the Infinium Omni2.5Exome-8 BeadChip Kit (Illumina; n = 82) as previously described.14,15 DNA and RNA-seq data were available for 102 samples using the FoundationOne Heme Panel.26 PCR and Sanger Sequencing for single-nucleotide variants (SNVs) and insertion/deletions (indels) were available for 47 samples.14 Genomic data are publicly available and have been deposited in the European Genome Phenome Archive, accession numbers EGAS00001000654, EGAS00001001952, EGAS00001003266, and EGAS00001004638.
Molecular subtyping
Genomic classification for 282 cases (supplemental Figure 1) was based on the use of multiple assays where available: RNA-seq (n = 238), LDA (n = 210), cytogenetics (n = 197), and PCR for known fusions (ETV6-RUNX1, KMT2A-AFF1, and TCF3-PBX1; n = 274) (supplemental Figure 2A). The overall schema for molecular classification of B-ALL, as described previously,27 is provided in supplemental Figure 3. For cases with RNA-seq (n = 238), we identified 17 leukemia subtypes defined by CNA for aneuploid cases, recurring genetic alterations (subtype-defining rearrangements and SNVs), distinct clustering by 2-dimensional t-distributed stochastic neighbor embedding plot, and gene expression profiles determined by Prediction Analysis of Microarrays28 (supplemental Figure 4). For the remaining cases with cytogenetic and/or LDA data (n = 43), we identified subtypes based on aneuploidy (hyperdiploidy, hypodiploidy), the presence of known fusions (ETV6-RUNX1, KMT2A-R, TCF3-PBX1), and gene expression (DUX4-R, Ph-like). One remaining case with KMT2A-AFF1 was identified by routine clinical PCR. Details for the 282 E2993 cases with molecular classification are provided in supplemental Table 1.
CNA detection
RNA-seq data may be used to robustly identify chromosomal and arm level CNAs (https://github.com/honzee/RNAseqCNV/). Genes were ordered based on the median absolute deviation of their expression level across the samples, and a subset (1/4 to 1/3) of the genes with least median absolute deviation was picked as stably expressed genes. To assist the CNA calling, mutant allele frequency of SNVs detected from RNA-seq data was plotted against the gene expression level of the stably expressed genes to double check if the CNAs were reliable.
Statistical methods
Patient characteristics and remission rates were compared using χ2 tests for heterogeneity, and Mantel-Haenszel test for trend or the Mann-Whitney U test. The donor–no donor comparison included patients <50 or 55 years (age limits for potential allogeneic stem cell transplant [ASCT]). Censoring was at the earlier date of last contact, or 31 October 2010, the data cutoff date. Relapse-free survival (RFS) was calculated from complete response (CR) to relapse or death without relapse. Time to relapse was measured from start of induction. The log-rank method was used to compare time-to-event distributions. Where the hazard was nonproportional and the long-term survival was to be compared, the χ2P value for the difference in the survival percentages at 5 years was quoted. Cox regression analysis was used to investigate the association between a time-to-event variable and baseline covariates. Transplantation was entered into multivariable Cox models as a time-varying covariate. All P values were 2 sided.
Both percent of leukemic lymphoblasts stained by individual antibodies and the median fluorescence intensity (MFI) of antibody binding divided by MFI in the absence of antibody (MFI ratio) were compared across all genetic subtypes by Kruskal-Wallis test, and then between all pairs of genetic subtypes by the Mann-Whitney U test, yielding 1501 comparisons. The P value threshold of .0209 was determined by the adaptive profile information criteria,29 which balance the levels of false discovery and false negative rates.
Results
Biologic features for 1229 patients with B-ALL
The median age of the cohort was 30 years (range, 14 to 65). The median WBC count at presentation was 9.2 × 10⁹/L (range, 0.1 to 930) and was <30 × 109/L in 73% of the patients (supplemental Table 2).
By immunophenotyping, 18.5% were CD10− pro-B-ALL, 63% were CD10+ early pre-B ALL, 15.7% had pre-B-ALL with cytoplasmic immunoglobulin M, and 2.8% were mature B-ALLs. No survival difference was seen according to maturational stages, when excluding mature B-ALL (supplemental Figure 5).
Cytogenetic analysis was unavailable in 401 (32.6%), normal (≥20 normal bone marrow metaphases) in 199 (24%), and abnormal in 629 patients (76%), based on standard G-banding (supplemental Table 3).
Molecular characterization, demographics, and antigen expression in E2993 patients
Molecular analysis was possible for 282 E2993 patients, of whom 264 were eligible for trial (supplemental Figure 1). With the exception of older age (median 35 vs 29 years, P < .001), this cohort did not differ with respect to demographic or clinical variables from patients with BCR-ABL1− B-ALL UKALLXII/E2993 who were not tested (supplemental Table 4). Thus, our study cohort is representative of the entire trial population.
In addition to subtypes recognized by karyotyping or PCR for chimeric fusions, such as ETV6-RUNX1, TCF3-PBX1, TCF3-HLF, KMT2A-rearranged (KMT2A-R), and aneuploid ALL (high-hyperdiploid, HH; low-hypodiploid, LH; near-haploid, NH; intrachromosomal amplification of chromosome 21, iAMP21), recently described genotypes included DUX4-rearranged (DUX4-R),30,31ETV6-RUNX1-like,32 PAX5alt and PAX5 P80R,27,33-35 Ph-like with rearrangements and/or overexpression of CRLF2 (Ph-like CRLF2-R), and Ph-like with genetic alterations activating other kinases or cytokine receptor signaling pathways (Ph-like non–CRLF2-R),11-14ZNF384-rearranged (ZNF384-R) and ZNF384-R-like,30,36-39MEF2D-rearranged (MEF2D-R),40,41BCL2/MYC,27 and the genotype with concomitant ZEB2 and CEBPE alterations,34 using established criteria (supplemental Table 5; supplemental Figure 3). For outcome analysis, patients who were LH and NH were combined despite their distinct biologies,42,43 because of their comparably poor prognosis.44 Cases without a subtype-defining driver genetic alteration were excluded from further analysis (“B-other”) (11%). Demographics and frequencies of genomic subgroups are summarized in Table 1. Barriers to the enrollment of minorities to adult cancer clinical trials during E2993, before current National Institutes of Health initiatives,45 prevented associations between genotype and race or ethnicity.
Baseline characteristics of 251 molecularly characterized E2993 patients (excluding the 31 B-other patients), including patients who were not eligible for trial
| Molecular subgroup | Number of patients | % | Age (y) median (Q1, Q3) | WBC × 109/L median (Q1, Q3) | Sex (%), F/M |
|---|---|---|---|---|---|
| DUX4-R | 22 | 7.8 | 26.0 (22.5, 40.3) | 9.3 (3.5, 23.6) | 52.4/47.6 |
| ETV6-RUNX1/-like* | 5 | 1.8 | 22.0 (20.0, 26.0) | 6.7 (2.0, 9.7) | 60.0/40.0 |
| TCF3-PBX1 | 15 | 5.3 | 29.0 (22.5, 37.5) | 29.8 (10.4, 61.2) | 46.7/53.3 |
| KMT2A-AFF1 | 27 | 9.6 | 38.0 (32.0, 45.0) | 92.0 (43.4, 229.2) | 76.9/23.1 |
| KMT2A-non-AFF1 | 10 | 3.5 | 35.5 (31.5, 46.5) | 84.4 (6.1, 190.2) | 70/30 |
| PAX5alt | 27 | 9.6 | 38.0 (20.5, 50.0) | 9.2 (3.5, 23.5) | 18.5/81.5 |
| PAX5 P80R | 10 | 3.5 | 26.5 (20.8, 46.3) | 11.7 (3.9, 22.5) | 30/70 |
| Ph-like CRLF2-R | 30 | 10.6 | 28.0 (19.3, 35.8) | 23.3 (11.0, 70.8) | 20/80 |
| Ph-like non-CRLF2-R | 18 | 6.4 | 38.5 (30.0, 48.8) | 14.3 (6.1, 60.4) | 61.1/38.9 |
| ZNF384-R/-like* | 11 | 3.9 | 27.0 (26.0, 42.5) | 13.2 (6.2, 36.7) | 18.2/81.8 |
| MEF2D-R | 6 | 2.1 | 22.0 (19.0, 43.8) | 25.0 (10.0, 32.9) | 50.0/50.0 |
| BCL2/MYC | 12 | 4.3 | 40.0 (26.5, 48.8) | 28.5 (16.7, 57.8) | 36.4/63.6 |
| ZEB2/CEBPE | 4 | 1.4 | 43.0 (37.8, 45.8) | 32.6 (2.8, 86.9) | 50.0/50.0 |
| iAMP21 | 3 | 1.1 | 21.0 (20.0, 30.0) | 4.2 (3.9, 6.0) | 33.3/66.7 |
| TCF3-HLF | 1 | 0.4 | 44 (44, 44) | 6.1 (6.1, 6.1) | 100/0 |
| HH | 16 | 5.7 | 20.0 (18.0, 29.3) | 2.5 (1.9, 9.5) | 25/75 |
| LH/NH | 34 | 12.1 | 44.0 (36.0, 53.0) | 3.7 (2.9, 7.6) | 37.1/62.9 |
F, female; M, male.
Combination of patients who were ETV6-RUNX1 and ETV6-RUNX1-like, as well as ZNF384 and ZNF384-like.
In 51% of cases, cytogenetic analysis failed or yielded a normal result. Although for recurrent gene fusions, corresponding cytogenetic abnormalities were frequently detected, most genetic alterations were cryptic in nature (supplemental Table 1). Within the Ph-like cohort, 62.5% had Ph-like CRLF2-R vs 37.5% with Ph-like non–CRLF2-R, similar to other reports in adult ALL.15-18 Among Ph-like CRLF2-R cases, the ratio of IGH-CRLF2 to P2RY8-CRLF2 rearrangements was 3:1, supporting a prevalence of IGH-CRLF2 in adults.15,16 Genetic alterations in Ph-like non–CRLF2-R cases included rearrangements and mutations driving JAK-STAT signaling (JAK2 [n = 4], EPOR [n = 2], IL7R [n = 1], TYK2 [n = 1]), fusions involving ABL-class genes (ABL1 [n = 1], ABL2 [n = 1], PDGFRA [n = 1]), and 1 case with ETV6-NTRK3 fusion. As observed in pediatric ALL,32 a fusion involving IKZF1 was found in one of our patients who were ETV6-RUNX1-like ALL. Among patients with DUX4-R, IGH-DUX4,30-32 and among patients with MEF2D-R, MEF2D-BCL9 fusions were most common.40,41,46ZNF384 was recurrently rearranged to the transcriptional regulator EP300,36,38 whereas other partners (TAF15, TCF3)37 were less common. All of the BCL2/MYC cases harbored rearrangements of BCL2, BCL6 and/or MYC (Table 2).
Gene rearrangements and gene mutations of 251 molecularly characterized E2993 patients (excluding 31 B-other patients)
| Molecular subgroup | Gene rearrangements and mutations (no. of patients) |
|---|---|
| DUX4-R | IGH-DUX4 (19), MZF1-DUX4 (1), DUX4 overexpression (2) |
| ETV6-RUNX1 | ETV6-RUNX1 (3) |
| ETV6-RUNX1-like | IKZF1-FIGNL1 (1), no fusion (1) |
| TCF3-PBX1 | TCF3-PBX1 (15) |
| TCF3-HLF | TCF3-HLF (1) |
| KMT2A-R | KMT2A-AFF1 (27), KMT2A-MLLT1 (5), KMT2A-EPS15 (2), KMT2A-MLLT3 (1), KMT2A-AFF1NEG by PCR (2) |
| Ph-like CRLF2-R | IGH-CRLF2 (19), P2RY8-CRLF2 (6), IGH-CRLF2 + P2RY8-CRLF2 (1), USP9X-RBM10 (1), high CRLF2 expression and Ph-like score (2), NA (1) |
| Ph-like non-CRLF2-R | PAX5-JAK2 (2), SSBP2-JAK2 (2), PCM1-JAK2 (1), ZNF340-JAK2 (1), ZNF340-TYK2 (1), RCSD1-ABL1 (1), RCSD1-ABL2 (1), ETV6-NTRK3 (1), IGH-EPOR (1), IGK-EPOR (1), FIP1L1-PDGFRA (1), IL7R p.L242ins (1), no fusion (4) |
| PAX5alt | PAX5-ETV6 (4), PAX5-ZNF318 (1), IGH-CRLF2 (1), P2RY8-CRLF2 (1), PAX5 G334fs (1), PAX5 R140L (1), PAX5 R59W (1), no fusion or mutation (17) |
| PAX5 P80R | P2RY8-CRLF2 (1), PAX5 p.Pro80Arg (9) |
| ZNF384-R | EP300-ZNF384 (6), TCF3-ZNF384 (2), TAF15-ZNF384 (1) |
| ZNF384-like | ZBT47-ZNF652 (1), no fusion (1) |
| MEF2D-R | MEF2D-BCL9 (5), MEF2D-SS18 (1) |
| BCL2/MYC | IGH-MYC (3), IGH-BCL2 (2), IGH-BCL2 + BACH2-MYC (1), REPS1-BCL2 (1), IGH-BCL2 + IGH-MYC (2), SMC4-BCL6 (1), IGH-BCL2 + MBNL1-BCL6 (1), IGH-BCL6 (1), |
| ZEB2/CEBPE | IGH-CEBPE (3), no fusion (1) |
| iAMP21 | IGH-CRLF2 (1), no fusion (2) |
| HH | No fusion (9), NA (7) |
| LH/NH | CREBBP-UTRN (1), TFAP4-TRAP1 (1), PAX5 R140L (1), no fusion (29), NA (3) |
No fusion, inability to detect a fusion with the methodology used.
NA, RNA-seq was not performed.
The presence of SNVs, insertion/deletions (indels), and focal deletions was determined for key genes, including IKZF1, TP53, and those related to JAK-STAT signaling (JAK1, JAK2, IL7R, SH2B3, CRLF2) (supplemental Figure 2B; supplemental Table 6). We observed a higher frequency of IKZF1 alterations (deletion or mutation) in Ph-like than non–Ph-like cases (27 of 31, 87% vs 14 of 100, 14%), confirming earlier data.14 Overall, alterations in the JAK-STAT signaling pathway were identified in 15 of 271 cases assessed (5.5%), predominantly in Ph-like ALL. Among 30 Ph-like CRLF2-R cases, we observed mutation of JAK1 (n = 1), JAK2 (n = 8), and IL7R (n = 1). Two Ph-like CRLF2-R cases harbored CRLF2 p.Phe232Cys in addition to mutation of JAK1 or JAK2. An additional IL7R indel was identified in a Ph-like non–CRLF2-R case. One PAX5 P80R case harbored 2 JAK2 mutations (p.Arg683Gly and p.Asp873Asn), and 1 B-other case with IGH-CRLF2 (lacking the Ph-like signature) harbored CRLF2 p.Phe232Cys. TP53 mutations were more common in LH (15 of 28, 54%), as expected,42 and BCL2/MYC-R (4 of 12, 33%) compared with the remaining cohort (5 of 231, 2.2%).
Clustering of antigen expression for samples with defined genotypes is illustrated in Figure 1, and distinguishing immunophenotypic features are described in supplemental Table 7. Unique observations included overexpression of CD13, CD34, and CD38 by DUX4-R compared with other genotypes (P < .0001). The T-cell antigen CD2, present in 68% of DUX4-R, was also found in 50% of patients with the PAX5 P80R mutation. PAX5 P80R blasts were arrested at the pro-B stage, although with higher frequency of CD10+ blasts (P = .0011) and stronger CD10 expression (P = .0052) compared with prototype pro-B KMT2A-R blasts. PAX5 P80R blasts expressed CD33, while lacking CD65S and CD15S, the 2 myeloid antigens typically47 expressed jointly in KMT2A-R. Antigen expression was indistinguishable between KMT2A-AFF1 and KMT2A–non-AFF1 blasts. Ph-like blasts with or without CRLF2-R differed only by a higher frequency of CD13+ blasts in Ph-like non–CRLF2-R cases (P = .011). Compared with BCR-ABL1, Ph-like blasts showed comparably weak CD38 but less dual CD13-CD33 (P = .0001) and CD25 expression (P = .0003), both characteristic features of BCR-ABL1 ALL.48ZNF384-R/-like blasts were CD10− in 73% of cases but compared with KMT2A-R, CD24+ (P = .0088) and CD20+ (P < .0001) blasts were more frequent. ZNF384-R/-like blasts lacked CD65S and CD15S but expressed dual CD13-CD33, comparable to BCR-ABL1 ALL, and CD25 in one-third of cases. Myeloperoxidase was not detected. There was neither overexpression of surface CD135 nor evidence of FLT3-ITD, a potentially targetable protein kinase suggested for ZNF384-R.49 Blasts with BCL2/MYC-R genotype showed features of mature B-ALL with surface immunoglobulin monoclonality and strong CD20 but variable terminal deoxynucleotidyltransferase and CD10 expression. LH blasts were often CD10− and CD65S+ or CD15S+, although dual CD65S-CD15S expression was rarer in LH than KMT2A-R cases (P < .0001).
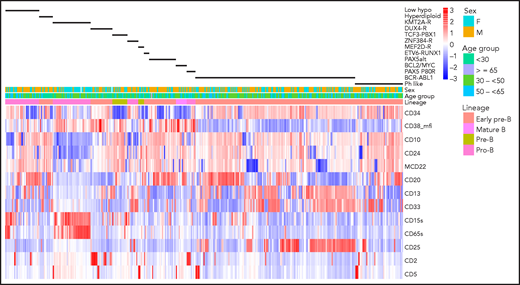
Antigen expression in major molecular subgroups. Unsupervised hierarchical clustering of antigen expression in each of 413 E2993 patients. The patient cohort consists of 244 samples from E2993 patients who were BCR-ABL1− and were genotyped (excluding molecular subgroups with <5 patients and B-other) and 169 E2993 patients with BCR-ABL1 ALL. This approach identified characteristic antigen expression profiles within each of the 13 molecular subtypes, shown as black bars above the heatmap. Columns represent patients, and rows are antigens. Antigens are listed to the right of the heatmap. Expression levels reflect the percentage of antibody-binding leukemic lymphoblasts, except for CD38_mfi, which reflects intensity of antigen expression. High expression and low expression of antigens in the heatmap are shown in shades of red and blue, respectively. The first row above the heatmap aligns genotypes with B-lineage maturation stages. ZNF384-R includes ZNF384-like; ETV6-RUNX1 includes ETV6-RUNX1-like; KMT2A-R includes patients who were both KMT2A-AFF1 and KMT2A–non-AFF1; low_hypo, LH and NH; mcd22, membrane (surface) CD22.
Antigen expression in major molecular subgroups. Unsupervised hierarchical clustering of antigen expression in each of 413 E2993 patients. The patient cohort consists of 244 samples from E2993 patients who were BCR-ABL1− and were genotyped (excluding molecular subgroups with <5 patients and B-other) and 169 E2993 patients with BCR-ABL1 ALL. This approach identified characteristic antigen expression profiles within each of the 13 molecular subtypes, shown as black bars above the heatmap. Columns represent patients, and rows are antigens. Antigens are listed to the right of the heatmap. Expression levels reflect the percentage of antibody-binding leukemic lymphoblasts, except for CD38_mfi, which reflects intensity of antigen expression. High expression and low expression of antigens in the heatmap are shown in shades of red and blue, respectively. The first row above the heatmap aligns genotypes with B-lineage maturation stages. ZNF384-R includes ZNF384-like; ETV6-RUNX1 includes ETV6-RUNX1-like; KMT2A-R includes patients who were both KMT2A-AFF1 and KMT2A–non-AFF1; low_hypo, LH and NH; mcd22, membrane (surface) CD22.
Outcome in the entire UKALLXII/E2993 B-ALL cohort
Of 1229 patients with BCR-ABL1− B-ALL, 93% achieved CR. The CR rate was higher in younger patients (P < .0001), but did not differ by sex, WBC count, or state of central nervous system (CNS) involvement. In multivariate Cox analysis, patients with LH or complex karyotype or t(8;14) had inferior survival. Relapse occurred in 507 patients (41%). The median time to relapse was 13 months (range, 28 days to 12 years). Among relapsed patients, 116 of 373 without transplant in first CR had a transplant after relapse (12 autologous, 30 sibling–ASCT, 66 matched unrelated donor, and 8 alternative-donor transplants). Of the 109 relapsed patients who had an ASCT after relapse, 42 survived for a median of 4.5 years (10 days to 14.9 years) from time of relapse.
The 5-year OS was 42% (95% confidence interval [CI], 39, 44). In multivariate Cox analysis considering age, sex, WBC count, CNS disease, and interaction between CNS disease and WBC count, increasing age (P < .0001), higher WBC count (P < .0001), and CNS involvement at diagnosis (P = .02) were associated with shorter OS. In 326 patients randomized between chemotherapy and autologous transplant, the 5-year OS was 47% (95% CI, 39, 54) vs 35% (95% CI, 28, 43) (P = .03). In the donor–no donor analysis, the 5-year OS was 52% (95% CI, 47, 58) for patients with a donor and 45% (95% CI, 41, 50) for patients without (log rank P > .1; χ2 test of difference at 5 years, P = .05) (Figure 2, with results carried out to 10 years). The relapse risk at 5 years for those with a donor was 30% (95% CI, 24, 35) vs 55% (95% CI, 50, 60) in those without (log rank P < .0001; χ2 at 5 years, P < .0001). The percentage of deaths in remission at 5 years for those with a donor was 32% (95% CI, 26, 37) vs 10% (95% CI, 7, 13) for those without (log rank P < .0001; χ2 at 5 years, P < .0001).
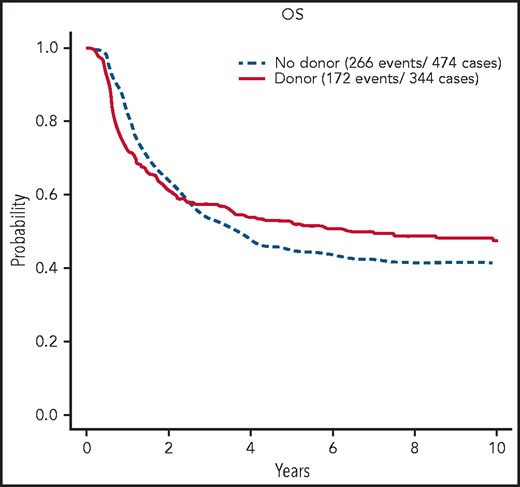
OS of patients with BCR/ABL1−B-ALL on UKALLXII/E2993 by matched sibling donor availability at 10 years. Kaplan-Meier estimate of OS for patients who are BCR/ABL1-negative B-ALL on UKALLXII/E2993 by availability of a matched donor at 10 years of follow-up.
OS of patients with BCR/ABL1−B-ALL on UKALLXII/E2993 by matched sibling donor availability at 10 years. Kaplan-Meier estimate of OS for patients who are BCR/ABL1-negative B-ALL on UKALLXII/E2993 by availability of a matched donor at 10 years of follow-up.
Outcome among molecular subgroups
Of 282 patients genotyped, 264 were treated on study. Outcome analysis was limited to subgroups with ≥5 patients and was done for 217 patients (see supplemental Figure 1 for patient selection). Patients with KMT2A–non-AFF1 were excluded because of their molecular heterogeneity, although outcome did not differ from that in KMT2A-AFF1 patients. Ph-like patients with and without CRLF2-R were combined, as their outcomes were superimposable.
CR rates ranged from 50% in the BCL2/MYC-R to 100% in the ETV6-RUNX1/-like, HH, PAX5 P80R, and MEF2D-R groups (supplemental Table 8). CIs overlapped, possibly because of the small sizes of some of the cohorts.
With a median of 8 years and 9 months of follow-up for survivors, relapse-free survival (RFS) (supplemental Table 9) and OS (supplemental Table 10) varied markedly among groups (Figure 3). In Cox proportional-hazards models, outcomes of all groups were compared with that of DUX4-R as reference group. In univariable analysis (Table 3), patients who were DUX4-R, HH, ETV6-RUNX1/-like, PAX5 P80R, and TCF3-PBX1 had comparable RFS and were designated molecular standard-risk (mSR). Patients who were BCL2/MYC-R, KMT2A-AFF1, LN/NH, and Ph-like did significantly worse than DUX4-R (P < .001), and they were considered molecular high risk (mHR). Patients who were PAX5alt, ZNF384-R/-like, and MEF2D-R had molecular intermediate risk (mIR) of relapse with RFS inferior to patients who were DUX4-R, although with lower levels of significance. OS among mSR groups did not vary significantly. OS of mHR groups remained inferior to that of DUX4-R (P < .001), whereas among mIR, only patients who were PAX5alt remained significantly inferior to DUX4-R (P = .01) but not ZNF384-R/-like (P = .111) or MEF2D-R (P = .098) (Table 3). Molecular analysis stratified 64 patients (29.5%) as mSR, 44 (20.3%) as mIR, and 109 (50.2%) as mHR. To consider an effect of antigens on outcome beyond their association with various genotypes, we adjusted multivariable Cox models for the presence of CD34, CD10, CD19, CD24, CD20, CD22, and CD38. Neither antigen expression nor the type of transplant received affected prognosis (not shown).
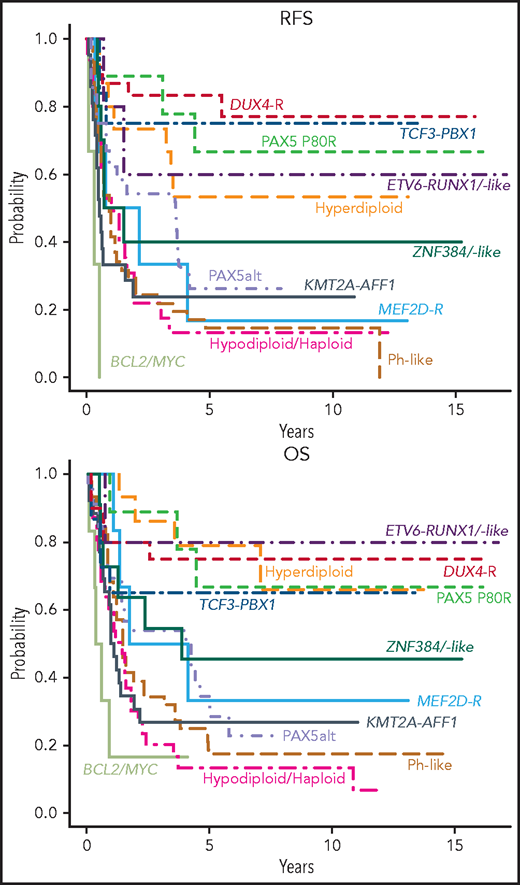
Outcome of E2993 molecular subgroups. Kaplan-Meier estimates for RFS and OS of molecular subgroups included in the outcome analysis. The RFS analysis included only patients who achieved a complete remission (DUX4-R, 18 patients; TCF3-PBX1, 12; PAX5 P80R, 9; Hyperdiploid, 15; ETV6-RUNX1/-like, 5; ZNF384-R/-like, 10; PAX5alt, 24; MEF2D-R, 6; KMT2A-AFF1, 21; Ph-like, 41; Hypodiploid/Haploid, 24; BCL2/MYC, 3). The OS analysis included all patients with outcome information (DUX4-R, 20 patients; TCF3-PBX1, 15; PAX5 P80R, 9; Hyperdiploid, 15; ETV6-RUNX1/-like, 5; ZNF384-R/-like, 11; PAX5alt, 27; MEF2D-R, 6; KMT2A-AFF1, 26; Ph-like, 46; Hypodiploid/Haploid, 31; BCL2/MYC, 6). Among DUX4-R, ETV6-RUNX1/-like, TCF3-PBX1, PAX5 P80R, and hyperdiploid patients, neither RFS nor OS varied significantly.
Outcome of E2993 molecular subgroups. Kaplan-Meier estimates for RFS and OS of molecular subgroups included in the outcome analysis. The RFS analysis included only patients who achieved a complete remission (DUX4-R, 18 patients; TCF3-PBX1, 12; PAX5 P80R, 9; Hyperdiploid, 15; ETV6-RUNX1/-like, 5; ZNF384-R/-like, 10; PAX5alt, 24; MEF2D-R, 6; KMT2A-AFF1, 21; Ph-like, 41; Hypodiploid/Haploid, 24; BCL2/MYC, 3). The OS analysis included all patients with outcome information (DUX4-R, 20 patients; TCF3-PBX1, 15; PAX5 P80R, 9; Hyperdiploid, 15; ETV6-RUNX1/-like, 5; ZNF384-R/-like, 11; PAX5alt, 27; MEF2D-R, 6; KMT2A-AFF1, 26; Ph-like, 46; Hypodiploid/Haploid, 31; BCL2/MYC, 6). Among DUX4-R, ETV6-RUNX1/-like, TCF3-PBX1, PAX5 P80R, and hyperdiploid patients, neither RFS nor OS varied significantly.
Univariable Cox model of RFS and OS for molecular subgroups compared with the patients who were DUX4-R as reference group
| Molecular subgroup | RFS hazard ratio | P | OS hazard ratio | P |
|---|---|---|---|---|
| BCL2/MYC | 36.4 (7.9, 167.2) | <.001 | 11.3 (3.2, 39.3) | <.001 |
| KMT2A-AFF1 | 7.8 (2.6, 23.3) | <.001 | 6.6 (2.5, 17.1) | <.001 |
| LH/NH | 7.6 (2.6, 22.4) | <.001 | 5.3 (2.0, 14.1) | <.001 |
| Ph-like | 7.5 (2.7, 21.3) | <.001 | 4.9 (1.9, 12.6) | <.001 |
| MEF2D-R | 5.9 (1.6, 21.8) | .009 | 3.0 (0.8, 11.3) | .098 |
| PAX5alt | 4.6 (1.5, 13.7) | .006 | 3.7 (1.4, 10.0) | .010 |
| ZNF384-R/-like | 4.0 (1.1, 14.3) | .031 | 2.6 (0.8, 8.6) | .111 |
| HH | 2.4 (0.7, 8.4) | .154 | 1.0 (0.3, 3.7) | .995 |
| ETV6-RUNX1/-like | 2.0 (0.4, 11.1) | .411 | 0.8 (0.1, 6.7) | .819 |
| PAX5 P80R | 1.5 (0.3, 6.8) | .585 | 1.2 (0.3, 5.1) | .795 |
| TCF3-PBX1 | 1.2 (0.3, 5.5) | .781 | 1.6 (0.5, 5.7) | .429 |
When comparing outcome of IKZF1-altered (n = 41) vs IKZF1 wild-type (n = 90) across the whole cohort, no difference was detected in either OS or RFS. This was also true when Ph-like status was included in multivariable analyses with or without an interaction term. Among patients who were Ph-like, OS did not differ by IKZF1 status, in part due to the expected12,14,15 high frequency of IKZF1 alterations in this group (25 of 29 cases treated on trial, 86%). With respect to RFS, cases with wild-type IKZF1 fared much better than IKZF1-altered cases, although cohorts were too small to reach significance (supplemental Figure 6).
When applying the protocol-specified risk classification (age >35 years or WBC count >30 × 109/L) to 216 molecularly characterized patients, 137 were allocated to the protocol-defined high-risk group (pHR). Of patients with pHR, 21.2% had mSR and 18.2% had mIR genotypes (supplemental Table 11). Patients with pHR that had mSR or mIR genotypes did significantly better than patients with mHR among the pHR cohort (for RFS, HR = 0.36 [95% CI, 0.23, 0.57], P < .001; for OS, HR = 0.39 [95% CI, 0.25, 0.60], P < .001) (supplemental Table 12).
Figure 4 shows the effect of protocol-defined low risk (pLR) and high risk (pHR) on RFS and OS in molecular risk groups. RFS was not different between protocol-defined risk groups within each molecular risk group, whereas OS was positively affected for patients with both mSR (HR = 0.24, P = .007) and mHR (HR = 0.47, P = .007) when these patients fit the criteria for pLR. Superior 5-year RFS and OS were experienced by patients in the pLR/mSR cohort (73.3% [95% CI, 59.8, 89.9] and 87.9% [95% CI, 77.5, 99.8], respectively), whereas patients in the pHR/mHR cohort did worst (11.9% [95% CI, 6.23, 22.9] and 12.9% [95% CI, 7.19, 23.1], respectively) (Table 4).
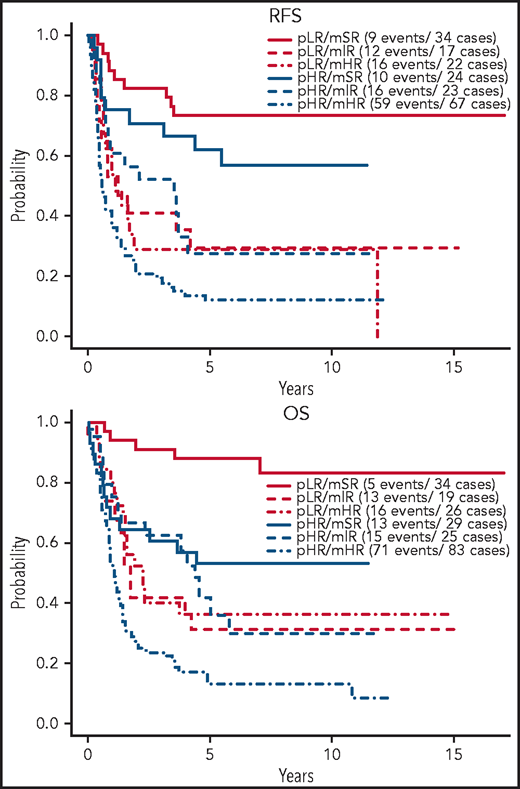
Outcome of E2993 patients by protocol-defined and molecular-defined risk assignment. Kaplan-Meier estimates of RFS and OS for patients stratified by their protocol-defined risk: low risk (pLR) and high risk (pHR), and molecular risk: mSR, mIR, and mHR.
Outcome of E2993 patients by protocol-defined and molecular-defined risk assignment. Kaplan-Meier estimates of RFS and OS for patients stratified by their protocol-defined risk: low risk (pLR) and high risk (pHR), and molecular risk: mSR, mIR, and mHR.
Five-year RFS and OS of E2993 patients by combined protocol-defined and molecular-defined risk assignment
| Combined risk group | 5-y RFS, % (95% CI) | 5-y OS, % (95% CI) |
|---|---|---|
| pLR/mSR | 73.3 (59.8, 89.9) | 87.9 (77.5, 99.8) |
| pLR/mIR | 29.4 (14.1, 61.4) | 31.6 (16.3, 61.2) |
| pLR/mHR | 28.9 (14.7, 56.6) | 36.2 (21.5, 60.9) |
| pHR/mSR | 62.0 (45.2, 85.1) | 53.2 (37.5, 75.6) |
| pHR/mIR | 27.7 (13.8, 55.3) | 42.0 (25.5, 69.4) |
| pHR/mHR | 11.9 (6.23, 22.9) | 12.9 (7.19, 23.1) |
As patients with a sibling donor in the entire B-ALL cohort did better than patients without a donor (Figure 2), a donor–no donor analysis was done for molecular risk groups. Only 125 patients with molecular characterization had donor information available (57.6%). Neither RFS nor OS differed by donor availability in the mSR and mIR risk groups (supplemental Figure 7). In patients with mHR, the data suggest longer RFS (P = .08) and OS (P = .2) for patients with a donor. Because of the small sample size of subgroups, interpretations of this data with respect to transplant recommendations are limited.
Discussion
A unique feature of our study is the integration of data from genomic testing and immunophenotyping with outcome in a large subset of unselected adult patients with BCR-ABL1− B-ALL treated on a single trial. Only 11% of patients were not assigned to a well-described genotype, a percentage as low as that achieved in children.
A review of prognostic biologic features in the entire UKALLXII/E2993 BCR-ABL1− B-lineage cohort revealed that cytogenetic anomalies, but not B-cell maturation stage of leukemic lymphoblasts, adversely affected outcome. However, standard chromosome analysis was noninformative in 50% of E2993 patients. Because most genotypes in E2993 were not associated with recurrent chromosomal abnormalities (supplemental Table 1), cytogenetic analysis cannot be considered an adequate approach for their detection.
Among genotypes identified, Ph-like ALL constituted the biggest group (17%), comparable to most studies in adult ALL.15,17,18,27 Although Ph-like and BCR-ABL1 ALL have similar genetic profiles, the immunophenotype of Ph-like ALL has remained undefined.50 We show here that their antigen expression is similar and distinctive from that in other genotypes with respect to weak CD38 expression, but also different with lower frequency of dual CD13-CD33+and CD25+ blasts in Ph-like ALL. We describe, for the first time, CD25+ CD10−/dim pro-B ZNF384-R/-like blasts. Although overexpression of CD25 and its gene, interleukin-2 receptor α, are negative prognostic factors in BCR-ABL1 ALL and BCR-ABL1− ALL,51-53 CD25 did not affect outcome in patients who were ZNF384-R/-like (not shown). This supports the notion that antigen profiles affect outcome only when analyzed in conjunction with their underlying molecular counterparts. We found expression of the T-cell antigen CD2 not only in DUX4-R54,55 but also in PAX5 P80R cases. CD2 expression in 2 novel genotypes with favorable outcome supports its proposed role as a surrogate for good prognosis in pediatric B-ALL in the early literature.56-58
As previously seen in adult ALL,15-19,33,34,59 outcome of patients who were Ph-like was extremely poor, although we did not see inferior outcome of Ph-like CRLF2-R compared with patients who were Ph-like non–CRLF2-R.16 Noteworthy, an analysis of UKALLXII patients with deregulated CRLF2 expression showed reduced event-free survival and OS.60 Although the outcome of patients with IKZF1-altered, Ph-like ALL was dismal, there was no significant difference among patients who were Ph-like with respect to IKZF1 status. However, the frequency of IKZF1-alterations in this group was very high (86%). Among our patients with PAX5-altered genotypes, PAX5 P80R had a favorable outcome, similar61 or better than reported,27,34 and significantly better than patients who were PAX5alt.27 Although patients who were ZNF384-R/-like had an intermediate molecular risk, as reported,33,34,37,38,62 so did patients with MEF2D-R, who did better than previously suggested.33,34,40,41 Our large group of adult patients with DUX4-R confirmed the excellent outcome seen in children and young adults.27,30-32
Genomic analysis revealed that, despite a median age of 35 years, one-third of our patients had a favorable molecular risk. Importantly, E2993 patients deemed high risk based on age and presenting WBC count who were molecularly standard or intermediate risk did significantly better than patients with mHR within the pHR cohort. However, younger age and lower WBC count still positively affected OS in both the standard- and the high-risk molecular subgroups (Figure 4), highlighting the importance of combining genomic analysis with traditional prognostic factors for risk stratification.
In summary, our results have important clinical implications. We have demonstrated that molecular subtypes differ strikingly in their responses to treatment on a single trial. Although MRD is another accepted powerful prognostic indicator in adult B-ALL,63,64 its impact in genetic subgroups has rarely been analyzed. Ph-like ALL patients tend to remain MRD+ after induction chemotherapy.16,17,20,65 In children, MRD was prognostically important for Ph-like or hypodiploid ALL.65,66 Other trials of Ph-like ALL,16,67 however, suggested that relapse-risk remained high despite risk-adapted therapy, and outcomes remained poor even if MRD-negativity was achieved. Response kinetics, clinically relevant cutoff levels, and optimal timing of MRD testing vary between low- and high-risk genotypes.68,69 When UKALLXII/E2993 was activated in 1993, MRD testing was not yet standard of care in adult B-ALL. As a result, submission of follow-up specimens was not mandated, limiting our potential for MRD testing. The MRC assessed MRD in 161 of 820 UKALLXII patients with BCR/ABL1− B-ALL (19.6% of their accrual) and demonstrated that MRD was a predictor of relapse in both protocol-defined standard- and high-risk patients, although cohorts were small.70 Although we could not answer the interaction of MRD and molecular genotype in the present study, we will get clarity from the recently completed phase 3 trial E1910 (clinicaltrials.gov; #NCT02003222), in which flow cytometric MRD was determined throughout the course of disease, samples underwent multimodal genetic analyses, and treatment with blinatumomab was assigned or randomized based on MRD status.
Acknowledgments
This study was conducted, in part, by the ECOG-ACRIN Cancer Research Group (Peter J. O'Dwyer and Mitchell D. Schnall, Group Cochairs) and supported by the National Institutes of Health (NIH) National Cancer Institute under the following award numbers: U10CA180820, U10CA180794, UG1CA189859, UG1CA232760, UG1CA233234, and UG1CA233290. The authors acknowledge the support of Memorial Sloan Kettering Cancer Center Support Grant NIH P30 CA008748. This work was further supported by NIH National Cancer Institute R35 CA197695 and P30 CA021765 (C.G.M.), R01 CA198089 (A.M.), P30 CA118100-15 (C.L.W.), R50 CA211-542-04 (R.H.), UG1 CA233332 (O.A.-W. and R.L.L.), Leukemia Lymphoma Society SCOR 7013-17 (A.M.), the NIH National Institute of General Medical Sciences P50 GM115279 (C.G.M.), the American Lebanese Syrian Associated Charities of St Jude Children’s Research Hospital (C.G.M.), Blood Cancer UK 15036 (A.V.M.), 15009 (B.P.), and Cancer Research UK C27995/A21019 (A.V.M. and A.K.F.). The authors acknowledge data provided by Foundation Medicine (Cambridge, MA), which were previously published.
The content is solely the responsibility of the authors and does not necessarily represent the official views of the National Institutes of Health. Mention of trade names, commercial products, or organizations does not imply endorsement by the US government.
Authorship
Contribution: E.P., K.G.R., C.G.M., and M.R.L. prepared the manuscript; E.P., K.G.R., Z.G., J.B., J.R., Y.Z., R.L.L., O.A.-W., Z.C., G.W., C.Q., L.S., S.P., C.L.W., R.H., L.F., B.P., A.M., R.P.K., and D.A. performed experiments and data analyses and helped with data interpretation; V.W., G.A.N.B., D.P., and C.C. performed statistical analyses; Y.Z., G.W.D., and A.V.M. centrally reviewed institutional cytogenetic data; H.M.L., S.M.L., A.K.F., D.I.M., P.H.W., J.M.R., M.S.T., and A.H.G. organized the clinical trial; and all authors reviewed and approved the manuscript.
Conflict-of-interest disclosure: E.P. does consulting work with Supertechs Inc and the ECOG-ACRIN Cancer Research Group; C.G.M. has received grant funding from Abbvie, Loxo Oncology, and Pfizer, speaking fees from Amgen, and is on the Advisory Board for Illumina; R.L.L. is on the supervisory board of Qiagen and is a scientific advisor for Imago, Mission Bio, Zentalis, Ajax, Auron, Prelude, C4 Therapeutics, and Isoplexis; receives research support from and consulted for Celgene and Roche and has consulted for Incyte, Janssen, Astellas, Morphosys, and Novartis; has received honoraria from Roche, Lilly, and Amgen for invited lectures and from Gilead for grant reviews. O.A.-W. has served as a consultant for H3B Biomedicine, Foundation Medicine Inc, Merck, Prelude Therapeutics, and Janssen and is on the scientific advisory board of Envisagenics Inc, Pfizer Boulder, and AlChemy Inc; has received prior research funding from Loxo Oncology and H3B Biomedicine. D.I.M. does consulting work for Pfizer, Amgen, and Novartis; S.M.L. receives honoraria from Daiichi-Sankyo, Pfizer, Bristol Myers Squibb, Acceleron, Agios, and Loxo Onxology and institutional research support from Onconova, Kura, Hoffman La Roche, Ariad, and Biosight. M.S.T. receives research funding from Abbvie, Cellerant, Orsenix, ADC Therapeutics, Biosight, Glycomimetics, Rafael Pharmaceuticals, and Amgen, is on the advisory boards of Abbvie, BioLineRx, Daiichi-Sankyo, Orsenix, KAHR, Rigel, Nohla, Δ Fly Pharma, Tetraphase, Oncolyze, Jazz Pharma, Roche, Biosight, and Novartis and receives royalties from UpToDate. A.M. receives research support from Janssen, Daiichi-Sankyo, and Sanofi and does consulting work for Epizyme, Constellation, and Jubilant. The remaining authors declare no competing financial interests.
Gordon W. Dewald died on 26 February 2010.
Correspondence: Mark R. Litzow, Division of Hematology, Mayo Clinic, 200 First Street, SW, Rochester, MN 55905; e-mail: litzow.mark@mayo.edu; and Charles G. Mullighan, Department of Pathology, St Jude Children’s Research Hospital, 262 Danny Thomas Pl, MS342, Memphis, TN 38105; e-mail: charles.mullighan@stjude.org.
Genomic data are publicly available and have been deposited in the European Genome Phenome Archive, Accession numbers EGAS00001000654, EGAS00001001952, EGAS00001003266, and EGAS00001004638.
The online version of this article contains a data supplement.
There is a Blood Commentary on this article in this issue.
The publication costs of this article were defrayed in part by page charge payment. Therefore, and solely to indicate this fact, this article is hereby marked “advertisement” in accordance with 18 USC section 1734.

This feature is available to Subscribers Only
Sign In or Create an Account Close Modal