

Key Points
A KB algorithm provides more accurate outcome prediction than the current ELN risk stratification.
The decision to perform HSCT in first CR in AML can be personalized by integrating ELN 2017 risk, NPM1 MRD, and KB simulation.
Abstract
A multistage model instructed by a large dataset (knowledge bank [KB] algorithm) has recently been developed to improve outcome predictions and tailor therapeutic decisions, including hematopoietic stem cell transplantation (HSCT) in acute myeloid leukemia (AML). We assessed the performance of the KB in guiding HSCT decisions in first complete remission (CR1) in 656 AML patients younger than 60 years from the ALFA-0702 trial (NCT00932412). KB predictions of overall survival (OS) were superior to those of European LeukemiaNet (ELN) 2017 risk stratification (C-index, 68.9 vs 63.0). Among patients reaching CR1, HSCT in CR1, as a time-dependent covariate, was detrimental in those with favorable ELN 2017 risk and those with negative NPM1 minimal residual disease (MRD; interaction tests, P = .01 and P = .02, respectively). Using KB simulations of survival at 5 years in a scenario without HSCT in CR1 (KB score), we identified, in a similar time-dependent analysis, a significant interaction between KB score and HSCT, with HSCT in CR1 being detrimental only in patients with a good prognosis based on KB simulations (KB score ≥40; interaction test, P = .01). We could finally integrate ELN 2017, NPM1 MRD, and KB scores to sort 545 CR1 patients into 278 (51.0%) HSCT candidates and 267 (49.0%) chemotherapy-only candidates. In both time-dependent and 6-month landmark analyses, HSCT significantly improved OS in HSCT candidates, whereas it significantly shortened OS in chemotherapy-only candidates. Integrating KB predictions with ELN 2017 and MRD may thus represent a promising approach to optimize HSCT timing in younger AML patients.

Introduction
The decision to proceed to allogeneic stem cell transplantation (HSCT) is the mainstay of precision medicine in acute myeloid leukemia (AML) patients younger than 60 years achieving a first complete remission (CR1) with intensive chemotherapy.1,2
Risk stratification was initially based on a limited set of cytogenetic and genetic lesions.3-5 The recent European LeukemiaNet (ELN) 2017 stratification also accounts for the allelic ratio of FLT3 internal tandem duplications (FLT3-ITDs)6-9 and mutations in TP53, RUNX1, or ASXL1.10
Current guidelines on the timing of HSCT in AML have been informed by pivotal donor vs no donor studies, demonstrating that, in patients with favorable risk, HSCT led to similar long-term outcome compared with other postremission therapies.10-13 These genetic randomization studies became less relevant with the expanding use of donors others than HLA-identical siblings.14,15 Authors have also considered HSCT as a time-dependent covariate to control for the immortal time bias.16-19
Collectively, these studies confirmed the benefit of HSCT in adverse-risk patients, with conflicting data for intermediate-risk patients. None of them identified a subset of patients with a significant benefit of chemotherapy-based consolidation compared with HSCT.11-13,16-18
Minimal residual disease (MRD) is also increasingly used to predict the benefit of HSCT in AML. Transcript-based MRD can identify the subset of NPM1-mutated patients who benefit from HSCT.20
Papaemmanuil et al21 previously described the mutational landscape of 111 genes in 1540 AML patients accrued between 1993 and 2004 in German-Austrian AML Study Group (AMLSG) trials. Gerstung et al22 applied a multistage model with random effects in this cohort to generate a knowledge bank (KB) that integrates clinical, cytogenetic, genetic, and treatment (HSCT) variables. The resulting KB algorithm generates personalized survival simulations.22 Because of improvements in AML management since accrual of this training cohort,23 KB simulations may not necessarily match the outcome of patients treated in more recent years. However, KB predictions, used as continuous prognostic scores, have been shown to predict prognosis more accurately than ELN risk stratifications.22,24
The KB algorithm can also simulate the survival of a given patient in different treatment scenarios, including HSCT in CR1 or HSCT deferred beyond relapse. Gerstung et al22 proposed to use the differences between these simulations to estimate the benefit of HSCT in CR1. Whether the KB algorithm can indeed identify HSCT candidates has yet to be validated. Here we integrate KB predictions with ELN 2017 and NPM1 MRD to identify patients benefiting from HSCT in CR1 in a cohort of 656 patients prospectively enrolled in the ALFA-0702 trial.
Methods
Patients and treatment
The ALFA-0702 trial (clinicaltrials.gov, #NCT00932412) was a phase 2 multicenter randomized study including 18- to 59-year-old patients with newly diagnosed de novo AML, excluding acute promyelocytic and core binding factor leukemias. Patients achieving CR defined per international criteria25 or CR with incomplete platelet recovery (platelet count <100 × 109/L, CRp)26 after a daunorubicin and cytarabine timed sequential induction chemotherapy (with or without a high-dose cytarabine-based salvage course) and with protocol-defined nonfavorable risk (supplemental Table 1 available on the Blood Web site), were eligible for HSCT in first CR/CRp (henceforth, CR1). In the absence of HLA-matched donor (sibling or 10/10 matched unrelated donor) or if otherwise ineligible for HSCT, they were randomly assigned to receive either 3 cycles of high-dose cytarabine (HDAC) or 3 cycles or clofarabine associated with intermediate-dose cytarabine (CLARA) as consolidation regimen. Patients with protocol-defined favorable risk were not randomized and received 3 HDAC cycles. Results of the CLARA randomization have previously been published.27 Of 713 patients included in the trial, 656 (92.0%) had DNA available at inclusion for centralized genomic analyses (supplemental Figure 1).
Targeted sequencing
Bone marrow samples from AML patients at diagnosis were studied by targeted sequencing of 41 recurrently mutated genes (supplemental Table 2). All diagnosis samples were screened for the presence of FLT3-ITDs by fragment analysis as previously described.20 High and low FLT3-ITDs were defined per ELN 2017 guidelines.10 More than 50 recurrent gene rearrangements and KMT2A partial tandem duplications (KMT2A-PTD) were sought using ligation-dependent reverse transcriptase-polymerase chain reaction amplification.28 Further details are provided in the supplemental Appendix.
NPM1 MRD
Methods are detailed in the supplemental Appendix. A >4 log reduction in peripheral blood MRD after the first induction course was used to define MRD negativity, a threshold previously shown to indicate HSCT benefit in patients with both typical (A/B/D) and nontypical NPM1 mutations.20
Definitions
ELN 2017 classification was applied retrospectively after central review of cytogenetics and gene mutations, accounting for reverse transcriptase-polymerase chain reaction results when available.10 Conditioning regimens were classified as myeloablative or reduced intensity according to recommendations.29
KB algorithm
Variables were recoded according to Gerstung et al.22 Missing data were imputed as previously reported,22,24 using the original AMLSG dataset that served to derive the KB algorithm.21 We then ran the KB algorithm as published,22 to simulate the survival of each patient in the absence of HSCT in CR1. We further refer to the 5-year overall survival (OS) from diagnosis estimated by these simulations as the KB score, a continuous variable ranging from 0 to 100, with lower KB score indicating worse prognosis. Further KB simulations are indicated in the supplemental Methods and supplemental Table 3.
Statistical analysis
Data are summarized as numbers and percentages or medians and ranges or interquartile ranges (IQR). Group comparisons were carried with Fisher tests for categorical variables and Mann-Whitney or Kruskal-Wallis tests for continuous variables with 2 or >2 groups, respectively. OS was defined as the time interval between inclusion in the ALFA-0702 trial and death or loss of follow-up. Disease-free survival (DFS) was computed from the date of CR1 until relapse, death, or loss to follow-up, whichever came first. Survival distributions were done with the Kaplan-Meier estimator. Follow-up was computed with the inverse method.30 Univariate and multivariate analyses were carried with log-rank tests and Cox models, respectively. The proportional hazard assumption was validated by visual inspection and testing of Schöenfeld residuals.31 Multicollinearity was inspected by studying the variance inflation factor, considering variance inflation factor >4 as unacceptable.32 To measure the goodness-of-fit of prognostic models, Harrell’s concordance indexes (C-indexes)33 were obtained after bootstrap cross-validation trained from 100 samples, with R package "pec." The impact of HSCT on OS was studied in patients reaching CR1, with a landmark at 45 days from inclusion considering HSCT in CR1 as a time-dependent covariate, using the method of Simon-Makuch for survival curves34 and the Mantel-Byar method for group comparisons.35 Multivariate analyses were carried with Andersen-Gill models.36 Interaction analyses between HSCT and covariates were tested by introducing interaction terms in multivariable models and forest plots displayed with the R package "anoint." Analyses were performed with R 3.5.3 (cran.r-project. org).
Results
Patient characteristics
Median age of the 656 genotyped patients was 46 years (range, 18-60 years; Table 1), comparable to the 57 patients without centralized genomics (supplemental Table 4). Of 147 (22.4%) FLT3-ITD patients, 87 (13.3%) and 60 (9.1%) had low (<0.5) and high (≥0.5) allelic ratios, respectively (supplemental Figure 2). ELN 2017 risk was favorable, intermediate, and adverse in 231 (35.2%), 194 (29.6%), and 222 (33.8%) patients, respectively. Nine (1.4%) patients were not classified by ELN 2017 because of missing cytogenetics and lack of stratifying mutation (supplemental Table 5). With a median follow-up of 4.2 years (95% confidence interval [CI], 4.0-4.4), 5-year OS was 58.2% (95% CI, 54.3% to 62.4%). CR1 was achieved in 563 (85.8%) patients after 1 (N = 525) or 2 (N = 38) courses. Median interval between inclusion and CR1 was 45 days (range, 23-124 days). A population of 545 CR1 patients could be analyzed for HSCT benefit after exclusion of the 9 patients with unknown ELN 2017 risk and of 9 patients relapsing before the day 45 landmark chosen for those analyses (HSCT-eligible population; Table 1; supplemental Figure 1). Their 5-year DFS and OS from CR1 were 56.1% (95% CI, 51.7% to 60.8%) and 64.9% (95% CI, 60.5% to 69.6%), respectively. Ninety-one (16.7%) received CLARA instead of HDAC courses.
Study population
| Characteristic | Total genotyped (N = 656) | HSCT eligible (N = 545) | ||
|---|---|---|---|---|
| N or median | Percentage or range | N or median | Percentage or range | |
| Age, y | 46 | 18-60 | 46 | 18-60 |
| Sex | ||||
| Male | 351 | 53.5 | 285 | 52.3 |
| Female | 305 | 46.5 | 260 | 47.7 |
| ECOG PS | ||||
| 0 | 284 | 43.3 | 233 | 42.8 |
| 1 | 298 | 45.5 | 250 | 45.9 |
| 2-3 | 66 | 10 | 56 | 10.2 |
| NA | 8 | 1.2 | 6 | 1.1 |
| WBC, 109/L | 8.4 | 0.3-377.4 | 8.7 | 0.3-377.4 |
| ELN 2017 risk | ||||
| Favorable | 231 | 35.2 | 219 | 40.2 |
| Intermediate | 194 | 29.6 | 166 | 30.4 |
| Adverse | 222 | 33.8 | 160 | 29.4 |
| Missing | 9 | 1.4 | 0 | 0 |
ECOG, Eastern Cooperative Oncology Group; NA, not available; PS, performance status.
Prognostic role of ELN 2017 classification
Five-year OS was 77.0% (95% CI, 71.7% to 82.7%), 57.0% (95% CI, 50.0% to 64.9%), and 40.0% (95% CI, 33.4% to 47.8%) in patients with favorable, intermediate, and adverse risk, respectively (log-rank test P < 10−5; supplemental Figure 3A). CR1 was achieved in 219 (94.8%) favorable, 166 (85.6%) intermediate, and 160 (72.1%) adverse ELN 2017 risk patients (P < 10−5). DFS also varied significantly according to ELN 2017 risk with 5-year estimates of 72.1% (95% CI, 66.4% to 78.4%), 53.7% (95% CI, 46.3% to 62.3%), and 36.3% (95% CI, 28.1% to 46.8%) in patients with favorable, intermediate, and adverse risk, respectively (overall log-rank test P < 10−5; supplemental Figure 3B). Differences in CR rates, OS, and DFS according to FLT3-ITD allelic ratio did not reach statistical significance (supplemental Figure 4).
Prognostic value of the KB algorithm
Of the 100 variables (16 clinical, 26 cytogenetic, and 58 molecular) that can instruct KB predictions, 3 clinical (lactate dehydrogenase, hemoglobin, splenomegaly) and 24 genetic variables were unavailable. The mutation frequency of these 24 genes was at most 5.4% in the AMLSG cohort that served to develop the KB.22 Data in the remaining 73 variables were missing in less than 5% of patients. After imputation of missing data as recommended by Gerstung et al,22 we derived for each patient a KB score ranging from 0 to 100, with lower values potentially indicating worse prognosis (supplemental Figure 5). As a continuous variable, a higher KB score was associated with a lower risk of death (OS: hazard ratio [HR] = 0.65; 95% CI, 0.60-0.71 for a 10% increase in KB score; P < 10−5) or failure beyond CR (DFS: HR = 0.74; 95% CI, 0.68-0.80; P < 10−5). For graphical purposes, we binned KB scores in 3 arbitrary groups. Patients with a KB score <20 (N = 180), 20 to 39 (N = 268), or ≥40 (N = 208) had 5-year OS of 31.9% (95% CI, 25.4% to 40.2%), 57.5% (95% CI, 51.4% to 64.4%), and 81.6% (95% CI, 76.2% to 87.4%; log-rank test P < 10−5; Figure 1A), and 5-year DFS of 37.0% (95% CI, 29.4% to 46.5%), 51.1% (95% CI, 43.3% to 60.3%), and 73.1% (95% CI, 67.0% to 79.8%; log-rank test P = .004; Figure 1B). ELN 2017 risk stratification and KB score (as a continuous variable) were correlated with median KB scores of 45.2 (IQR, 35.1-57.8), 29.3 (IQR, 21.1-37.0), and 18.3 (IQR, 7.0-28.8) in patients with favorable, intermediate, and adverse ELN 2017, respectively (P < 10−5; supplemental Figure 6). As a continuous variable, the KB score had increased predictive value compared with ELN 2017 stratification, with bootstrapped C-indexes of 68.9 vs 63.0, respectively, for OS and 65.4 vs 60.4, respectively, for DFS. Even after arbitrary discretization as in Figure 1, the bootstrapped C-indexes of KB score categories were 67.0 and 62.5 for OS and DFS, respectively, and thus still superior to ELN 2017 (63.0 and 60.4, respectively).

Validation of the prognostic relevance of the knowledgebank approach. (A) OS of all 656 patients and (B) DFS of the 545 CR1 patients according to the KB score arbitrarily binned in 3 groups (KB score, <20, 20-39, ≥40). P values from log-rank tests.
Validation of the prognostic relevance of the knowledgebank approach. (A) OS of all 656 patients and (B) DFS of the 545 CR1 patients according to the KB score arbitrarily binned in 3 groups (KB score, <20, 20-39, ≥40). P values from log-rank tests.
Prediction of HSCT benefit with MRD-adjusted ELN 2017 risk
Of the 545 patients eligible for HSCT in CR1, 276 (50.6%) were transplanted in CR1, including 53, 106, and 117 patients with favorable, intermediate, and adverse ELN 2017 risk, corresponding to 24.2%, 63.9%, and 73.1% of each risk group, respectively. HSCT was done after myeloablative (N = 178) or reduced intensity (N = 94) conditioning (conditioning not available in N = 4) from a matched related donor (N = 120), a matched unrelated donor (N = 137), or an alternative donor (N = 19).
Considering HSCT as a time-dependent covariate in a bivariate analysis adjusted on ELN 2017 risk, the impact of HSCT was detrimental on OS from the day 45 landmark in patients with favorable risk AML (HR = 2.78; 95% CI, 1.50-5.12; P = .001) and overall neutral in those with intermediate (HR = 0.68; 95% CI, 0.40-1.13; P = .14) or adverse risk (HR = 0.87; 95% CI, 0.53-1.45; P = .59), with a significant interaction between ELN 2017 risk categories and HSCT (P = .01; Figure 2).
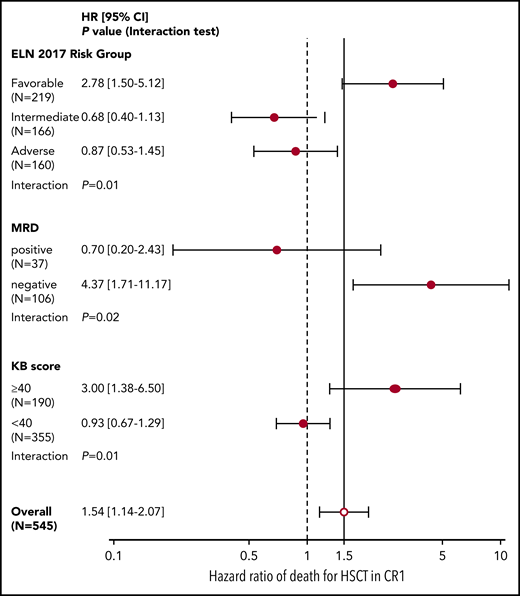
Forest plot of interaction between ELN 2017 risk, NPM1 MRD, and KB score threshold with HSCT in CR1. HR and 95% CI (in brackets) of the effect of HSCT in CR1 (as a time-dependent covariate) on OS after the day 45 landmark in the 545 patients eligible for HSCT in CR1 according to ELN 2017 risk, NPM1 MRD (in the 143 assessed patients), or KB score threshold of 40. P values from interaction tests in bivariate Cox models.
Forest plot of interaction between ELN 2017 risk, NPM1 MRD, and KB score threshold with HSCT in CR1. HR and 95% CI (in brackets) of the effect of HSCT in CR1 (as a time-dependent covariate) on OS after the day 45 landmark in the 545 patients eligible for HSCT in CR1 according to ELN 2017 risk, NPM1 MRD (in the 143 assessed patients), or KB score threshold of 40. P values from interaction tests in bivariate Cox models.
MRD was available in 143 (65.0%) of the 220 NPM1-mutated patients eligible for HSCT in CR1. Of those, 106 (74.1%) had a negative MRD after the first induction course. As previously published,20 there was a significant interaction between MRD and HSCT benefit (interaction test, P = .02), with MRD negativity being associated with a significant detriment of HSCT (HR = 4.37; 95% CI, 1.71-11.17; P = .002; Figure 2). We next considered an MRD-adjusted ELN 2017 risk stratification to identify a potential benefit of HSCT in CR1. Fourteen patients with intermediate ELN 2017 risk but negative MRD were reassigned to the favorable risk group and 27 patients with favorable ELN 2017 risk but a positive MRD to the intermediate risk group, resulting in a total of 206 favorable-risk chemotherapy-only candidates, and 339 HSCT candidates (step 2, Figure 3). Of those, 215 (63.4%) HSCT candidates and 61 (29.6%) chemotherapy-only candidates were transplanted in CR1 based on ALFA-0702 recommendations and investigator’s choice (supplemental Figure 7A). In a time-dependent analysis, the impact of HSCT on OS from the day 45 landmark was not significantly beneficial in the 339 HSCT candidates (HR = 0.80; 95% CI, 0.57-1.12; P = .19) and was significantly detrimental in the 206 chemotherapy-only candidates (HR = 4.21; 95% CI, 2.16-8.20; P < 10−5), again with a significant interaction between the postremission stratification and HSCT (P = 3 × 10⁻⁵; supplemental Figure 7B). Therefore, an NPM1 MRD-adjusted ELN 2017 risk classification can identify patients for whom HSCT in CR1 is detrimental but is not sufficient to robustly identify patients benefiting from HSCT in CR1.
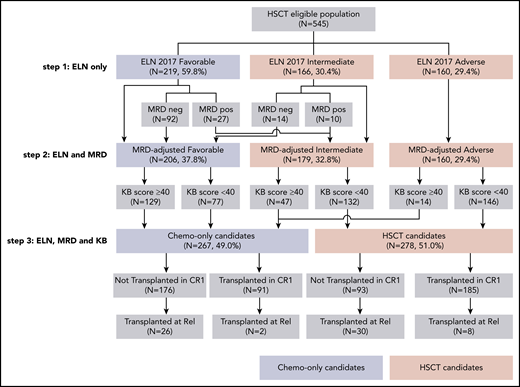
Flowchart of the 3-step development of a personalized approach to guide HSCT indication in CR1, successively integrating ELN 2017 risk, NPM1 MRD, and KB score threshold. The subsets of patients assigned to the chemotherapy-only and the HSCT postremission strategies at each step are indicated by blue and red boxes, respectively.
Flowchart of the 3-step development of a personalized approach to guide HSCT indication in CR1, successively integrating ELN 2017 risk, NPM1 MRD, and KB score threshold. The subsets of patients assigned to the chemotherapy-only and the HSCT postremission strategies at each step are indicated by blue and red boxes, respectively.
Prediction of HSCT benefit with the KB algorithm
We next investigated whether the KB algorithm could identify patients benefiting from HSCT in CR1. We first attempted to validate the approach published by Gerstung et al, where the KB algorithm is used to simulate the survival of each patient with vs without HSCT in CR1 (see "Methods"), and differences in simulated survival are used to guide HSCT decision. This first approach was not validated in our dataset (details in supplemental Methods, supplemental Results, and supplemental Figure 8). Because the benefit of HSCT is often confined to patients with poorer prognosis and because of the strong prognostic value of the KB score, we alternatively inspected whether a lower KB score could predict HSCT benefit. A systematic inspection of various cutoffs for the KB score identified a threshold value of 40 as optimal for the discrimination of HSCT benefit (supplemental Methods; supplemental Figure 9). Of the 545 patients eligible for HSCT in CR1, 355 (65.1%) had a KB score <40, of whom 218 (61.4%) were actually transplanted in CR1. In those 355 patients, there was no significant benefit of HSCT in CR1 (HR = 0.93; 95% CI, 0.67-1.29; P = .68), whereas HSCT was detrimental in the 190 patients with a KB score of 40 or higher (HR = 3.00; 95% CI, 1.38-6.50; P = .005), with a significant interaction between HSCT and this KB score threshold (P = .01; Figure 2).
HSCT decision integrating ELN 2017, MRD, and the KB score
We finally sought to combine the MRD-adjusted ELN stratification with this KB score threshold to optimally identify patients in whom HSCT in CR1 induces a survival benefit. For that purpose, we further refined the definition of HSCT candidates as those with nonfavorable MRD-adjusted ELN risk and a KB score less than 40. Although there was still a significant association between a KB score <40 and higher MRD-adjusted risk (Fisher test, P < 10−5; supplemental Figure 10), 47 (26.3%) of the 179 patients with intermediate MRD-adjusted risk and 14 (8.8%) of the 160 adverse risk patients had a KB score ≥40 and were reclassified as chemotherapy-only candidates, leaving 278 (51.0%) of the 545 patients as HSCT candidates and the remaining 267 (49.0%) patients as chemotherapy-only candidates (step 3, Figure 3). Among intermediate-risk patients, HSCT candidates were significantly older (P < 10−5), had higher bone marrow blast percentages (P = .0009), more frequent spliceosome gene mutations (14.4% vs 0%, P = .004), and less frequent NPM1 mutations (21.2% vs 42.6%, P = .007) than chemotherapy-only candidates. Among adverse-risk patients, the 14 patients that were predicted not to benefit from transplant in CR1 were younger (P < 10−5) and more frequently harbored KMT2A-PTD (21.4% vs 4.1%, P = .03) but never presented with monosomal karyotype (0% vs 23.1%, P = .07; supplemental Table 6).
One hundred eighty-five (66.5%) HSCT candidates and 91 (34.1%) chemotherapy-only candidates were transplanted in CR1 in the ALFA 0702 study. The repartition of the 66 transplanted beyond relapse is shown on Figure 3. In a time-dependent analysis, there was a strong interaction between this integrated transplant indication and the outcome of HSCT (P = 1.5 × 10⁻⁵). Transplantation in CR1 was detrimental in chemotherapy-only candidates (HR = 3.19; 95% CI, 1.81-5.61; P = 5 × 10⁻⁵) but was associated with a significant benefit in OS from the day 45 landmark in HSCT candidates (HR = 0.67; 95% CI, 0.47-0.96; P = .03; Simon-Makuch plot in supplemental Figure 11). Based on C-indexes and proportion of HSCT candidates, this stringent HSCT policy, requiring both an MRD-adjusted ELN 2017 intermediate or adverse risk and a KB score lower than 40 to indicate HSCT, represented an optimal compromise between prediction of HSCT benefit and number of patients requiring an HSCT compared with a liberal policy requiring either a nonfavorable MRD-adjusted ELN 2017 risk or a KB score lower than 40 or a transplant indication solely guided by either MRD-adjusted ELN 2017 or KB score (supplemental Figure 10).
Finally, in a landmark analysis at 6 months from inclusion, when 529 (97.1%) of the 545 HSCT-eligible patients were still alive and 201 (72.8%) of the 276 HSCTs in CR1 had been performed, the OS of transplant recipients from the 6-month landmark was significantly longer (5-year OS, 58.4%; 95% CI, 48.4% to 70.3%) than that of nontransplanted patients (43.5%; 95% CI, 34.5% to 54.8%; P = .01) among HSCT candidates based on the stringent HSCT policy, whereas among chemotherapy-only candidates, HSCT significantly reduced OS (70.1%; 95% CI, 59.8% to 82.1% vs 84.5%; 95% CI, 77.7% to 91.8%; P = .002), again with a significant interaction between transplant indication and HSCT (P = 9 × 10⁻⁵; Figure 4).
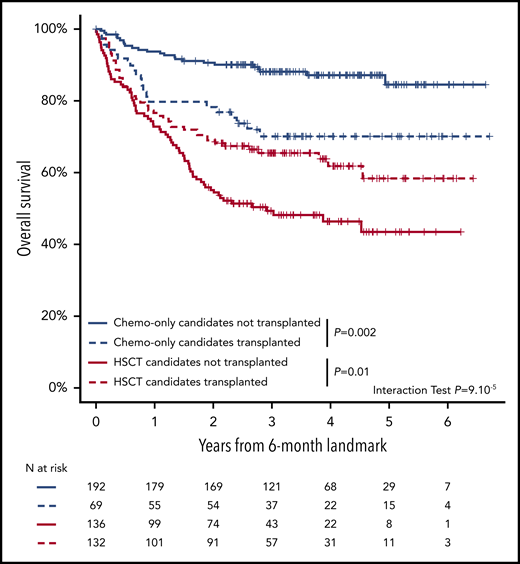
Landmark analysis at 6 months of the impact of HSCT in CR1. Kaplan-Meier estimates for OS from a 6-month landmark of the 268 HSCT candidates and 261 chemotherapy-only candidates still alive at 6 months from inclusion (96.4% and 97.8% of the total HSCT and chemotherapy-only candidates, respectively; Figure 3) transplanted (N = 132 HSCT candidates, N = 69 chemotherapy-only candidates) or not transplanted (N = 136 HSCT candidates, N = 192 chemotherapy-only candidates) before the 6-month landmark. P values from log-rank tests and from the interaction term of a bivariate Cox model.
Landmark analysis at 6 months of the impact of HSCT in CR1. Kaplan-Meier estimates for OS from a 6-month landmark of the 268 HSCT candidates and 261 chemotherapy-only candidates still alive at 6 months from inclusion (96.4% and 97.8% of the total HSCT and chemotherapy-only candidates, respectively; Figure 3) transplanted (N = 132 HSCT candidates, N = 69 chemotherapy-only candidates) or not transplanted (N = 136 HSCT candidates, N = 192 chemotherapy-only candidates) before the 6-month landmark. P values from log-rank tests and from the interaction term of a bivariate Cox model.
Discussion
By studying a cohort of 656 patients prospectively enrolled in the ALFA-0702 trial with targeted sequencing of 41 genes, we showed that ELN 2017, NPM1 MRD, and the KB algorithm can be integrated to refine HSCT indication in AML.
Our study population consisted of patients younger than 60 eligible for intensive chemotherapy, thus representing the core population of patients eligible for HSCT in daily practice. The high exhaustivity (92%) of centralized genomics and the multicentric nature of the ALFA-0702 academic trial limit the selection biases inherent to these studies. Indeed, the genetic spectrum in our cohort agreed with previous findings in comparable populations.4,21 Only 1.4% of patients could not be classified in the ELN 2017 system. Although our analyses confirm the prognostic relevance of ELN risk system, we found limited differences in OS and DFS between patients with high and low allelic ratios of FLT3-ITDs, as also found by others.37,38 This result, which is discrepant from previous reports,6,39 stresses the need to review some of the modifications operated during the 2017 update of ELN guidelines on the basis of large consortiums.40
We could confirm previous results on smaller patient cohorts regarding the clear superiority of KB over ELN stratification in predicting outcome,24 with bootstrapped C-indexes of 68.9 vs 63.0, respectively, for the prediction of OS. These values notably point to the need for further improvement of ELN risk stratification. As previously shown,22,24 the predictive power of the KB is robust to missing data, although the clinical parameters unavailable in the ALFA-0702 trial (lactate dehydrogenase, hemoglobin, and splenomegaly) had limited individual predictive power in the KB dataset,21 and the genes not assessed by targeted sequencing in our study are infrequently mutated in AML and have limited prognostic impact.4,21,41 For graphical purposes, we discretized results from the KB predictions (Figure 2). C-indexes for such arbitrary discretization were still superior to ELN 2017 for OS and DFS, but how this continuous score should be implemented in daily practice for prognostication remains to be addressed.
Choosing who to transplant in CR1 remains the main question in the management of younger AML patients treated intensively. In recent years and in the absence of randomized trials, time-dependent analysis has become a robust tool to study the benefit of HSCT in defined patient subgroups.16-18 In the ALFA-0702, HSCT indication was guided by trial-specific criteria inspired by ELN 2010. As a result, the proportion of patients who underwent HSCT was, to some extent, balanced between ELN 2017 categories, thus limiting the biases inherent to these uncontrolled analyses. Information on donor availability was lacking in the ALFA-0702 study, precluding a formal donor vs no donor comparison. We confirmed that favorable risk AML does not benefit from HSCT in CR1,6-9,16-18 especially when accounting for NPM1 MRD to reassign patients with a favorable genotype but a positive to the intermediate risk group and those with intermediate genotype but negative MRD to the favorable group.20 However, even such an MRD-adjusted ELN risk stratification could not robustly identify the subset of patients with a clear survival benefit of HSCT after CR1.
The multistage model of Gerstung et al22 accounts for the risk of relapse and nonrelapse mortality at all times, thus theoretically allowing to capture the risks and benefits of performing an HSCT either in CR1 or later after relapse. In the KB development cohort, 12% of patients were predicted to derive an OS benefit >10% by timing HSCT in CR1. In our cohort, a similar approach led to identify 111 (20.4%) such CR1 patients, but we found no differential effect of HSCT in those patients (interaction test: P = .27; supplemental Results). It is possible that estimation of nonrelapse mortality by KB, which has been developed based on data from patients transplanted between 1993 and 2004 after different postremission consolidations,21 does not provide an accurate risk/benefit evaluation of HSCT in more recent decades, given the continued improvement of the procedure.2 This stresses the need for a continuous update of KB with more recent datasets. Another caveat of the multistage model underlying the current KB algorithm is that it does not explicitly estimate the proportion of patients who can achieve a second CR after relapse and be successfully transplanted in CR2. However, the overall benefit of this strategy remains questionable.42
We thus turned to an alternative way to refine HSCT indications based on KB predictions. Because the benefit of HSCT in CR1 has consistently been shown to be highest in patients with poor prognosis,2,17,22 we simulated the long-term (5-year) OS of each patient in a scenario without HSCT in CR1. Simulating survival rather than incidence of relapse may better capture the benefit of salvage on long-term outcome. The resulting KB score ranges from 0 to 100, with lower values indicating worse outcome. We identified a KB score of 40 or lower as the best threshold to identify the benefit of HSCT in CR1. Expectedly, there was a significant overlap between MRD-adjusted ELN 2017 and this KB guide rule for HSCT allocation. However, combining these systems reclassified 26.3% of intermediate and 8.8% of adverse risk patients in CR1 in the chemotherapy-only group that may not need HSCT in CR1. Although some demographic, clinical, and molecular differences were identified between these reclassified patients and those from their cognate ELN 2017 risk category, none could substitute the KB approach, strengthening the relevance of this machine learning tool for accurate risk profiling in AML.
This combined stratification strongly interacted with the benefit of HSCT in both time-dependent and 6-month landmark analyses. The 278 transplant candidates derived a significant OS benefit from HSCT in CR1, when HSCT significantly impaired OS in the 267 chemotherapy-only candidates. This stratification seems superior to previous ones, where nonsignificant differences were found in the favorable risk group16,18 and supports integration of MRD and the KB algorithm to optimize the use of HSCT in CR1. Importantly, this stringent HSCT policy identified patients likely to benefit from transplant better than more liberal policies (supplemental Figure 10). This suggests that the current KB alone cannot substitute for MRD to identify among favorable-risk patients those at higher risk of relapse.20,43
As with all machine learning approaches, the internal logic of the KB algorithm is a black box.44 KB simulations can be made through web-based tools. We have derived a similar tool to guide HSCT indication according to our strategy in daily practice (https://alfa-group.shinyapps.io/alfa-hsct/).
Further improvements in personalized HSCT decisions are needed. They will require refined multistage models, accounting for CR2 and transplant modalities, more recent patient data capturing the continued improvement in AML management,23 such as new disease-modifying agents (eg, FLT3 inhibitors),45 and progresses in transplantation techniques.46 Finally, personalized predictions integrating recently developed prognostic gene expression profiles47 or other MRD techniques suited for NPM1 wildtype patients48,49 are an area of future investigation. Until then, implementation of our personalized, integrated, HSCT decision tool will require prospective evaluation in clinical trials integrating upfront chemotherapy with transplant strategy.
Reasonable requests for deidentified individual participant data should be sent to the corresponding author.
The online version of this article contains a data supplement.
The publication costs of this article were defrayed in part by page charge payment. Therefore, and solely to indicate this fact, this article is hereby marked “advertisement” in accordance with 18 USC section 1734.
Acknowledgments
The authors thank all investigators and clinical research associates from the ALFA group, and Sandrine Geffroy, Maxime Bucci, and Fabien Subtil for technical help. L.F. received grants from the Association Action Leucémies and Fondation I-SITE ULNE. R.I. is supported by grants from Association Laurette Fugain, Association Princesse Margot, Association pour la Recherche contre le Cancer, Fondation Leucémie Espoir, and Ligue Contre le Cancer. N.D. is supported by the North-West Canceropole (GIRCI AAP-AE 2018). This study was funded by the French National Institute (PHRC 2007/1911 and PRTK TRANSLA10-060).
Authorship
Contribution: L.F., B.D., and N.D. performed the sequencing analyses and interpreted the genomic data; A.L., L.F., B.D., N.D., and N.B. performed and interpreted MRD analyses; L.F. and R.I. designed the study, assembled and analyzed the data, and drafted the manuscript; H.D., C. Preudhomme, and R.I. supervised the study; X.T., S.d.B., J.-H.B., I.Y.-A., P.-Y.D., C.B., M.M., A.P., S.N., S.C., N.V., E.R., K.C.-L., D.C., S.M., B.D., P.T., E.L., C.R., D.L., C.G., J.L., J.-V.M., C. Pautas, and G.S. provided clinical data; P.S. analyzed the data; G.F. and P.-A.M. designed the web application; S.C. supervised management of the clinical data; C.T. centrally reviewed cytogenetics data; and all authors revised the manuscript and accepted its final version.
Conflict-of-interest disclosure: The authors declare no competing financial interests.
Correspondence: Raphael Itzykson, Service Hématologie Adultes, Hôpital Saint-Louis, 1 Av Claude Vellefaux, F-75010 Paris, France; e-mail: raphael.itzykson@aphp.fr.

This feature is available to Subscribers Only
Sign In or Create an Account Close Modal