

Key Points
FL can exhibit site-to-site genetic and phenotypic divergence as well as differential Tfh abundance and tumor-Tfh cross talk.
In FL, biopsy of a single anatomical site may not capture the full scope of a patient’s disease.

Abstract
Tumor heterogeneity complicates biomarker development and fosters drug resistance in solid malignancies. In lymphoma, our knowledge of site-to-site heterogeneity and its clinical implications is still limited. Here, we profiled 2 nodal, synchronously acquired tumor samples from 10 patients with follicular lymphoma (FL) using single-cell RNA, B-cell receptor (BCR) and T-cell receptor sequencing, and flow cytometry. By following the rapidly mutating tumor immunoglobulin genes, we discovered that BCR subclones were shared between the 2 tumor sites in some patients, but in many patients, the disease had evolved separately with limited tumor cell migration between the sites. Patients exhibiting divergent BCR evolution also exhibited divergent tumor gene-expression and cell-surface protein profiles. While the overall composition of the tumor microenvironment did not differ significantly between sites, we did detect a specific correlation between site-to-site tumor heterogeneity and T follicular helper (Tfh) cell abundance. We further observed enrichment of particular ligand-receptor pairs between tumor and Tfh cells, including CD40 and CD40LG, and a significant correlation between tumor CD40 expression and Tfh proliferation. Our study may explain discordant responses to systemic therapies, underscores the difficulty of capturing a patient’s disease with a single biopsy, and furthers our understanding of tumor-immune networks in FL.
Introduction
Tumor heterogeneity is a major obstacle to accurate prognosis and prediction of response to precision therapies.1,2 Recent studies have revealed intrapatient heterogeneity between primary tumors and their metastases (site-to-site heterogeneity).3,4 This site-to-site variation complicates evaluation of targeted therapies and discovery of informative biomarkers, which are commonly based on studies using single tumor-biopsy samples. Although site-to-site heterogeneity is well described for solid malignancies, it is still a question in lymphoid malignancy, which often presents as disseminated disease at the time of diagnosis.
Follicular lymphoma (FL), an incurable B-cell malignancy, has a variety of clinical behaviors. While most patients have an indolent course, a subset of patients relapse within 24 months after initial immunotherapy and suffer early cancer-related mortality.5-8 Patients with FL can experience discordant site responses to systemic treatment9 and histological transformation often occurs at a single site,10 providing clinical evidence for site-to-site tumor heterogeneity in FL.
Prior studies examining the pattern of mutations of the B-cell receptor (BCR) from multiple tumor sites suggested that FL tumor cells can migrate between different sites in the body,11,12 which would generate relative homogeneity of the tumor wherever it is found. In contrast, Araf et al13 recently found that paired tumor lesions, primarily consisting of nodal and nonnodal pairs, harbored different patterns of somatic mutations indicating divergent evolution and restricted tumor migration. We have now reexamined this question comparing 2 different lymph node sites of disease and characterizing the gene-expression profiles of their tumor and immune infiltrates.
As part of the baseline assessment of patients entering in situ vaccine immunotherapy trials, fine-needle aspiration (FNA) biopsies were obtained simultaneously from 2 anatomically separated nodal disease sites. Using single-cell transcriptional profiles, we found frequent evidence for divergent evolution between the pairs of tumors. We also found evidence of cross talk between tumor and T follicular helper (Tfh) cells. Finally, we explored the association of site-to-site heterogeneity with clinical parameters.
Methods
Detailed and additional methods are available in supplemental Methods (available on the Blood Web site).
Patient samples
From 10 patients with FL, FNA specimens from 2 spatially separated nodal tumor sites (termed tumor sites A and B) were obtained, as specified in the entry criteria of 2 clinical trials (ClinicalTrials.gov identifiers: NCT02927964, NCT03410901). Single-cell suspensions from these specimens were subjected, typically within an hour after acquisition, to single-cell RNA sequencing (scRNA-seq), single-cell BCR sequencing (scBCR-seq), single-cell T-cell receptor (TCR) sequencing (scTCR-seq) and flow cytometry. Additional targeted DNA sequencing was performed on separate banked formalin-fixed paraffin-embedded lymphoma biopsies from a third tumor site in 8 of these patients. Moreover, we analyzed flow cytometry data from paired nodal FNA specimens from additional 12 untreated patients with FL, enrolled either in a previously published14 or ongoing (NCT03410901) clinical trial. Patient clinical characteristics are summarized in supplemental Tables 1 and 2.
Written informed consent was obtained from all participants, and all protocols were approved by the institutional review board at Stanford University and conducted in accordance with good clinical practice (GCP) as defined in International Conference on Harmonization (ICH) guidelines and the US Code of Federal Regulations.
Preparation of single-cell libraries
Single-cell libraries were prepared using the Chromium Single-Cell 5′ Library and Gel Bead Kit and the Chromium Single-Cell V(D)J Enrichment Kit (10x Genomics) following the manufacturer’s protocol. Amplified complementary DNA was used for gene-expression library construction and for BCR and TCR enrichment followed by scBCR-seq and scTCR-seq library construction. Importantly, tumor samples from the same patient were synchronously acquired, processed, and sequenced.
Initial sequencing data processing
Libraries underwent Illumina-based sequencing and resultant scRNA-seq data were processed using Cell Ranger (version 3; 10x Genomics) and then filtered based on quality control metrics (see supplemental Methods for details). Sequencing metrics are provided in supplemental Table 3. scBCR-seq and scTCR-seq data were processed by Cell Ranger (version 3.1; 10x Genomics) using the “cellranger mkfastq” and “cellranger vdj” commands with the prebuilt reference.
Clustering analysis
After combining the scRNA-seq data of all 20 tumor samples and randomly shuffling the order of cells, standard scRNA-seq analyses (normalization, scaling, clustering) were performed using the R package Seurat (version 3.1.1).15,16 The effects of variation in sequencing depth were regressed out by including "nCount_RNA" as a parameter in the “ScaleData” function. Scaled data were used as input into a principal component analysis on the basis of variable genes. Global clustering of the entire data set was done using a shared nearest neighbor–based algorithm, and uniform manifold approximation and projection (UMAP) was used for visualization (see supplemental Methods for details).
Calculation of the adjusted Rand index17 for overlap between batch identity (sample date, 10x chromium chip, or sequencing run) and cluster identity, based on unsupervised clustering of all nonmalignant cells from all tumor samples, revealed that cluster assignments were near random with respect to batch identity (adjusted Rand index, 0.05-0.07), providing evidence for lack of significant batch effects.
Differential gene-expression analysis
Differential expression analyses were performed using the R package Seurat (version 3.1.1).15,16 Differentially expressed genes were identified by selecting genes expressed in ≥20% of cells in at least 1 cluster, having a log fold change ≥0.2 and a Bonferroni-adjusted P value of <.05 using the Wilcoxon rank sum test (Wilcoxon test), unless otherwise specified.
scBCR-seq analysis
For each patient, single-cell immunoglobulin variable heavy chain sequences (combining tumor cells from sites A and B) were aligned to reference gene segments encoding variable, diversity, and joining heavy chain regions (VH, DH, and JH, respectively) with the package Change-O (version 0.4.6).18 Clones were then defined using the length-normalized Hamming distance metric. After identifying sequences belonging to the dominant clone for each patient (median = 5583 per patient) and collapsing identical VDJ sequences, phylogenetic trees were constructed using the package Clustal Omega (version 1.2.4)19 and visualized with the R package dendextend (version 1.12.0).20 Major BCR subclusters were defined based on unsupervised k-means clustering using Clustal Omega.
Results
Single-cell gene-expression atlas of FL
We assessed site-to-site heterogeneity in FL by performing scBCR-seq, scRNA-seq, scTCR-seq, and flow cytometry on paired, nodal, synchronously acquired FNA specimens from 10 patients with FL (Figure 1; supplemental Table 1). By applying graph-based clustering to the scRNA-seq data set consisting of 138 464 cells with an average of 6923 cells per sample (supplemental Table 3), we easily identified a private tumor B-cell cluster for each patient. In contrast, immune infiltrates, composed of nonmalignant B cells, plasma cells, T cells, natural killer (NK)/natural killer T (NKT) cells, and myeloid cells, occupied common clusters shared among all patients and sites (Figure 2A; supplemental Figure 1A-C). Proliferating cells (tumor and immune cells) clustered together, reflecting the dominance of the proliferation-associated transcripts over lineage- or malignancy-specific ones (supplemental Figure 1B). Patient-specific B-cell clusters were confirmed to be FL tumor cells by (1) homogeneity of BCR light chain variable gene usage (supplemental Figure 1D), (2) inferred copy-number alterations (supplemental Figure 1E), and (3) the expression of FL hallmark genes (supplemental Figure 1F).
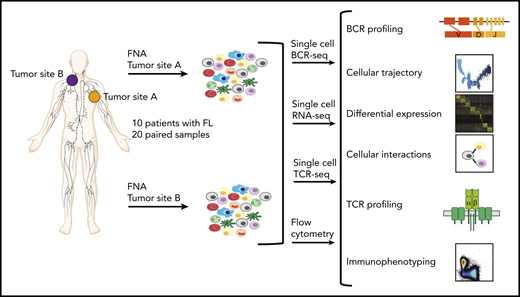
Study overview. Workflow for sample processing and single-cell analyses of FL samples collected from 2 distinct lymph node tumor sites (tumor site A and tumor site B) from each patient. Fresh cell suspensions were processed in parallel for scBCR-seq, scRNA-seq, scTCR-seq, and flow cytometry.
Study overview. Workflow for sample processing and single-cell analyses of FL samples collected from 2 distinct lymph node tumor sites (tumor site A and tumor site B) from each patient. Fresh cell suspensions were processed in parallel for scBCR-seq, scRNA-seq, scTCR-seq, and flow cytometry.
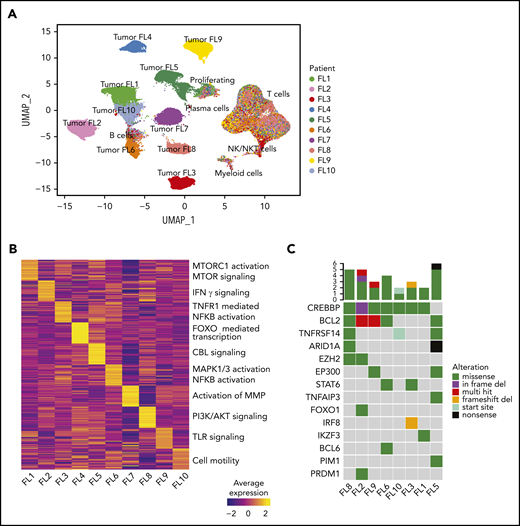
Interpatient heterogeneity in FL. (A) UMAP representation of dimensionally reduced scRNA-seq data from 20 tumor samples from 10 patients with FL following graph-based clustering. Clusters are assigned to indicated cell types by differentially expressed genes (see also supplemental Figure 1A-B) and cells are colored by patient identity (FL1-FL10). (B) Heatmap representing pathway activity of the top 30 MSigDB “Reactome” gene sets for each patient (FL1-FL10); analysis of variance with Tukey's honestly significant difference P < .05. Selected pathways are highlighted on the right of the heatmap. (C) Oncoprint showing mutations in genes known to be recurrently mutated in B-cell lymphomas, detected by targeted sequencing from archival tumor samples, available for indicated patients. The color coding delineates the type of alteration as indicated in the legend. The number of mutations in each tumor is plotted above.
Interpatient heterogeneity in FL. (A) UMAP representation of dimensionally reduced scRNA-seq data from 20 tumor samples from 10 patients with FL following graph-based clustering. Clusters are assigned to indicated cell types by differentially expressed genes (see also supplemental Figure 1A-B) and cells are colored by patient identity (FL1-FL10). (B) Heatmap representing pathway activity of the top 30 MSigDB “Reactome” gene sets for each patient (FL1-FL10); analysis of variance with Tukey's honestly significant difference P < .05. Selected pathways are highlighted on the right of the heatmap. (C) Oncoprint showing mutations in genes known to be recurrently mutated in B-cell lymphomas, detected by targeted sequencing from archival tumor samples, available for indicated patients. The color coding delineates the type of alteration as indicated in the legend. The number of mutations in each tumor is plotted above.
Interpatient heterogeneity in FL
Interestingly, patient-specific tumor cell clustering was retained when immunoglobulin and HLA genes were excluded from the analysis (supplemental Figure 2A). Instead, genes differentially expressed between patients’ tumor cells included those related to BCR signaling (CD22, CD81) and NF-κB signaling (REL, CD40; supplemental Figure 2B). Gene-set enrichment analysis revealed that although the activity of some pathways was shared among multiple patients (supplemental Figure 2C), many pathways were differentially active between patients (Figure 2B), including the canonical phosphatidylinositol 3-kinase and NF-κB pathways and pathways regulating tumor cell adhesion. Every patient’s tumor cells exhibited a unique inferred copy-number alteration profile (supplemental Figure 1E), and analysis of somatic mutations in a third archival biopsy, available for 8 patients, revealed unique mutation profiles (Figure 2C). These genetic differences may plausibly underlie differences in gene-expression profiles (supplemental Figure 2D).
Phylogenetic analysis of BCR-defined subclones
To evaluate the extent of site-to-site heterogeneity in FL, we first inferred the clonal architecture between the 2 sites. FL demonstrates ongoing somatic hypermutation, which leads to high rates of base-pair changes within the variable regions of the clonally rearranged immunoglobulin locus.21 Therefore, BCR sequence analysis is a sensitive method for tracking tumor subclonal evolution in FL. After identifying the dominant immunoglobulin heavy chain rearrangement in each case, we generated phylogenetic trees from each patient’s single-cell BCR sequences for that locus, spanning the entire VDJ and combining data from both tumor sites (Figure 3A; supplemental Figure 3A). Each leaf denotes a specific sequence, with clustered leaves representing similar sequences. Remarkably, when we overlaid the site of origin for each sequence in the tree, we observed that major BCR subclones were often restricted to 1 anatomic site, as for patients FL2 and FL8, indicating that the 2 lymphoma sites started from a single precursor tumor cell but had evolved independently at the 2 sites within the patient. In contrast, major BCR subclones were shared between the tumor sites in patients FL1 and FL10, suggesting a high degree of tumor cell migration between the 2 different sites sampled. To provide a quantitative comparison of BCR repertoires between sites for all cases, we calculated the similarity index (SI) according to Renkonen.22 The SI is defined as the sum of the minimal fractional abundance of each subcluster across tumor sites, with values closer to 1 representing greater similarity. The SI of major BCR subclones defined by unsupervised clustering was well below 0.5 in 6 of 10 patients (Figure 3A; supplemental Figure 3A), suggesting that site-to-site clonal divergence is common. Patients exhibiting divergent evolution tended to exhibit higher tumor transcriptional levels of AICDA, encoding activation-induced cytidine deaminase, and higher average somatic hypermutation rates in the 2 tumor sites, indicating a possible mechanism for the degree of divergence observed (supplemental Figure 3B-C).
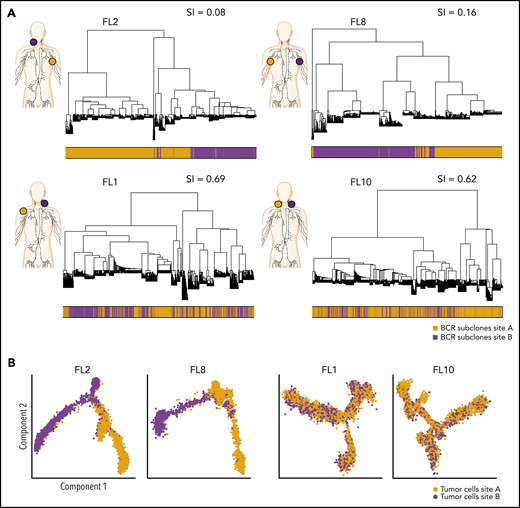
Phylogenetic analysis of BCR-defined subclones reveals site-specific patterns. (A) Representative phylogenetic trees based on immunoglobulin heavy chain VDJ sequences from single-cell BCR sequencing of tumor samples from both sites from 2 patients with site-specific BCR subclones (FL2, FL8) and from 2 patients with shared BCR subclones (FL1, FL10). The sampled malignant lymph node sites (site A in orange, site B in purple) are visualized on the left for each patient. The bar below the phylogenetic tree reveals the site of origin for each BCR sequence in the tree. Similarity index (SI) according to Renkonen is given on the top right for each patient. (B) Representative trajectory analysis of tumor cells from scRNA-seq of tumor samples from both sites (site A and site B) from 2 patients with site-specific BCR subclones (FL2, FL8) and from 2 patients with shared BCR subclones (FL1, FL10). The cells are colored by tumor site.
Phylogenetic analysis of BCR-defined subclones reveals site-specific patterns. (A) Representative phylogenetic trees based on immunoglobulin heavy chain VDJ sequences from single-cell BCR sequencing of tumor samples from both sites from 2 patients with site-specific BCR subclones (FL2, FL8) and from 2 patients with shared BCR subclones (FL1, FL10). The sampled malignant lymph node sites (site A in orange, site B in purple) are visualized on the left for each patient. The bar below the phylogenetic tree reveals the site of origin for each BCR sequence in the tree. Similarity index (SI) according to Renkonen is given on the top right for each patient. (B) Representative trajectory analysis of tumor cells from scRNA-seq of tumor samples from both sites (site A and site B) from 2 patients with site-specific BCR subclones (FL2, FL8) and from 2 patients with shared BCR subclones (FL1, FL10). The cells are colored by tumor site.
Pseudotime analysis confirms divergent evolution
Strikingly, pseudotime analysis,23 using the single-cell gene-expression data from tumor cells, confirmed divergent evolution between distinct lymphoma sites (Figure 3B; supplemental Figure 4A). Tumor cells from patients with highly site-specific BCR subclones (FL2, FL8, FL9, and FL5) exhibited significantly asynchronous evolutionary paths between the 2 sites (P < 1 × 10−200) (Figure 3B; supplemental Figure 4A-B), whereas tumor cells from patients with more highly shared BCR repertoires (FL1, FL10, and FL6) revealed similar evolutionary paths between the 2 sites.
Site-to-site heterogeneity in the tumor transcriptional profiles
To further investigate whether divergent tumor evolution results in site-specific transcriptional tumor phenotypes, we reclustered the scRNA-seq data from each patient’s tumor cells from both sites, as illustrated in Figure 4A. All tumors contained transcriptionally distinct subclusters of malignant B cells (Figure 4A), as previously described.24-26 We compared the relative composition of tumor subpopulations between sites by calculating an SI for each patient. This revealed that several patients, such as FL2, FL8, FL3, and FL5, differed significantly site to site (SI range, 0.06-0.35), whereas others, such as FL1, FL10, and FL6, exhibited similar gene-expression patterns across sites (SI range, 0.67-0.92; Figure 4A-B).
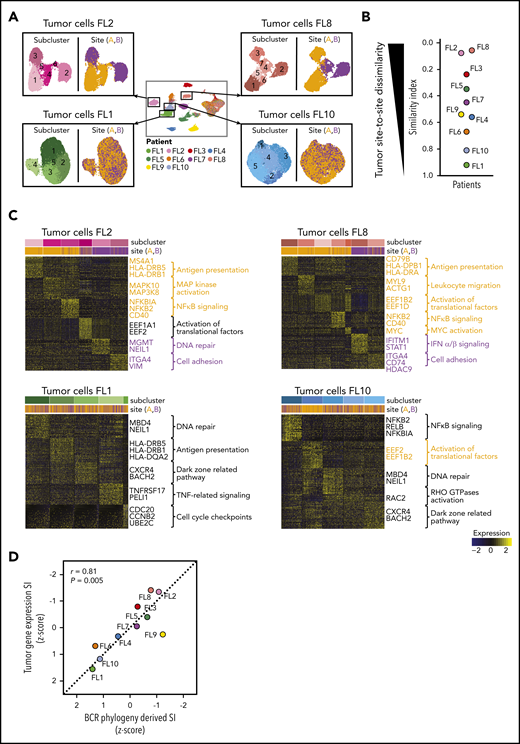
Site-to-site heterogeneity in tumor cell gene expression. (A) Each patient`s tumor cells were subset from the main data set and reclustered as shown here for FL2, FL8, FL1, and FL10, with subgraphs colored by tumor subcluster (left) or by tumor site (right). (B) Jitter plot showing Renkonen SIs of tumor subpopulations for all 10 patients (FL1-FL10). (C) Heatmaps of the top differentially expressed genes (rows) between cells from each tumor subcluster (columns) for patients with the lowest and highest SI in panel B; the Wilcoxon test with Bonferroni correction was used. Genes and pathways upregulated in subclusters mainly found in site A are highlighted in orange, and those at site B in purple. Bars at the top indicate tumor subclusters and tumor site. (D) Pearson correlation between the degree of dissimilarity, based on SI, of tumor cells and BCR phylogeny between sites for each patient (FL1-FL10). Dots are colored by patient identity as in panel A.
Site-to-site heterogeneity in tumor cell gene expression. (A) Each patient`s tumor cells were subset from the main data set and reclustered as shown here for FL2, FL8, FL1, and FL10, with subgraphs colored by tumor subcluster (left) or by tumor site (right). (B) Jitter plot showing Renkonen SIs of tumor subpopulations for all 10 patients (FL1-FL10). (C) Heatmaps of the top differentially expressed genes (rows) between cells from each tumor subcluster (columns) for patients with the lowest and highest SI in panel B; the Wilcoxon test with Bonferroni correction was used. Genes and pathways upregulated in subclusters mainly found in site A are highlighted in orange, and those at site B in purple. Bars at the top indicate tumor subclusters and tumor site. (D) Pearson correlation between the degree of dissimilarity, based on SI, of tumor cells and BCR phylogeny between sites for each patient (FL1-FL10). Dots are colored by patient identity as in panel A.
We sought to identify the biology underlying site-specific tumor subclusters observed in patients FL2 and FL8. Some site-specific clusters were defined by higher activity of canonical FL pathways, such as NF-κB signaling and antigen presentation (Figure 4C). Others were characterized by MAPK activation or by genes related to tumor cell adhesion and migration. Of note, site-specific clusters also exhibited differential expression of several targets of current or emerging treatments for FL, including MS4A1, HDAC9,27 CD40,28 and CD79B.29 Collectively, the degree of site-to-site variance in tumor gene-expression profiles mirrored the site-to-site divergence revealed by BCR sequence analysis (correlation coefficient [r] = 0.81, P = .005; Figure 4D).
Flow cytometry analysis confirms site-to-site heterogeneity
As an additional orthogonal method, we analyzed flow cytometry data on the same 20 paired tumor samples (supplemental Table 4; supplemental Figure 5A). Unsupervised clustering of this cell-surface expression data set again revealed distinct malignant subpopulations in each tumor. We quantified the relative distribution of these subpopulations between the 2 sites, as we did for the gene-expression data (supplemental Figure 5B). Strikingly, results from this analysis significantly correlated with the scRNA-seq gene-expression analysis (r = 0.73, P = .02; supplemental Figure 5C), even though gene-expression data had no bearing on the cell-surface markers used.
The tumor microenvironment in FL
To extend our analysis to the tumor microenvironment (TME), we first reclustered all 42 128 T cells from both sites from all patients. This revealed 13 transcriptionally distinct subpopulations including naive, memory, T regulatory (Treg), Tfh, and effector subsets (Figure 5A-B; supplemental Figure 6A-B). T effector clusters could be classified as memory effector (IL7R, CCL5), activated (IFNG, PRF1) and exhausted populations (CXCL13, TCF7; supplemental Figure 6C). Notably, we found a CD4+FOXP3− subpopulation, termed Treg 1 (Tr1) cells, expressing high levels of CTLA4, LAG3 and IL10, which likely corresponds to a recently described subpopulation,30 and a Tfh subpopulation, termed Tfh.IL4, defined by high expression of IL4 and TNF, similar to that previously described,31 though without significant CD10 expression (supplemental Figure 6D).
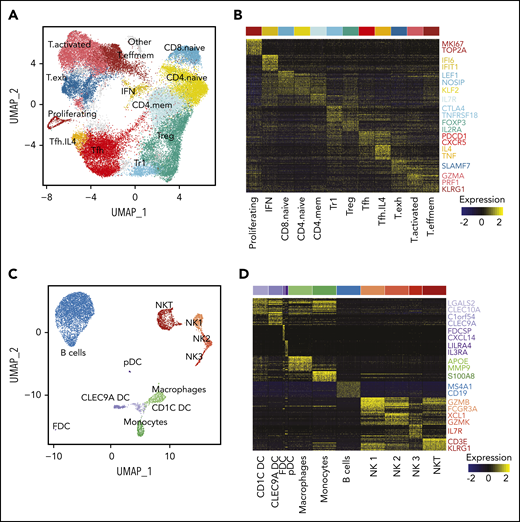
Characterization of the TME. (A) UMAP plot of all T cells from 20 tumors from 10 patients. Clusters are denoted by color and labeled according to phenotype. (B) Heatmap of the top 30 differentially expressed genes (rows) between T-cell subpopulations (columns; n = 3600 cells); the Wilcoxon test with Bonferroni correction was used. Selected canonical markers are highlighted on the right side. Bar above is colored by cluster as in panel A. (C) UMAP plot of non-T cells from 20 tumors from 10 patients. Clusters are denoted by color and labeled according to phenotype. (D) Heatmap of the top 30 differentially expressed genes (rows) between non-T subpopulations (columns; n = 2098 cells); the Wilcoxon test with Bonferroni correction was used. Selected canonical markers are highlighted on the right side. Bar above is colored by cluster as in panel C. FDC, follicular dendritic cell; pDC, plasmacytoid dendritic cell.
Characterization of the TME. (A) UMAP plot of all T cells from 20 tumors from 10 patients. Clusters are denoted by color and labeled according to phenotype. (B) Heatmap of the top 30 differentially expressed genes (rows) between T-cell subpopulations (columns; n = 3600 cells); the Wilcoxon test with Bonferroni correction was used. Selected canonical markers are highlighted on the right side. Bar above is colored by cluster as in panel A. (C) UMAP plot of non-T cells from 20 tumors from 10 patients. Clusters are denoted by color and labeled according to phenotype. (D) Heatmap of the top 30 differentially expressed genes (rows) between non-T subpopulations (columns; n = 2098 cells); the Wilcoxon test with Bonferroni correction was used. Selected canonical markers are highlighted on the right side. Bar above is colored by cluster as in panel C. FDC, follicular dendritic cell; pDC, plasmacytoid dendritic cell.
Because of the high number of single cells sequenced, we were also able to identify NKT cells, 3 NK cell populations (similar to Crinier et al32 ), 3 dendritic cell (DC) populations (CLEC9A DC, CD1C DC, and plasmacytoid DC33 ), 2 myeloid populations (monocytes and macrophages), a population of nonmalignant B cells, and a small population of follicular DCs (Figure 5C-D).
Site-to-site heterogeneity in the TME
Due to a relative paucity and possible undersampling of non-T immune cells, we restricted our site-to-site analysis in the TME to T cells. Having observed site-restricted tumor BCR subclones, we first asked whether TCR repertoires may be similarly site-restricted. Instead, we found a high degree of sharing; 63% (range, 50% to 84%) of the 50 most abundant TCRβ clonotypes in each patient were recovered from both sites (Figure 6A). Sharing was prominent in 2 of 3 patients with expanded clones (FL3 and FL4; supplemental Figure 7A). In patient FL8, whose tumor cells exhibited significant site-to-site heterogeneity, we found the dominant clone essentially restricted to 1 tumor site, representing 7.6% of all T cells at site B and only 0.1% at site A (supplemental Figure 7A). Integrating this patient’s TCR data with single-cell gene-expression data, we found that this clonotype mapped to the activated and exhausted T-cell clusters.
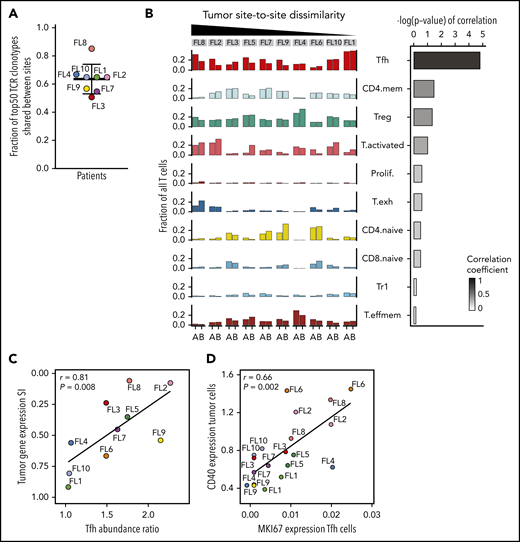
Site-to-site heterogeneity in the TME. (A) Fraction of 50 most abundant TCRβ clonotypes shared between tumor sites A and B. Dots are colored by patient identity as in Figure 2A. (B) Fraction of all T cells for each tumor site (tumor site A and site B) per patient (FL1-FL10), belonging to each T-cell subpopulation (left). Bars are colored by T-cell subpopulation as in Figure 5A. Spearman correlation between site-to-site abundance ratio of each T-cell subpopulation and tumor cell dissimilarity (quantified by Renkonen SI) (right). (C) Spearman correlation between site-to-site abundance ratio for Tfh cells and tumor cell dissimilarity (quantified by SI). Dots are colored by patient identity. (D) Spearman correlation of CD40 expression in tumor cells and MKI67 expression in Tfh cells of all 20 tumor samples. Dots are colored by patient identity.
Site-to-site heterogeneity in the TME. (A) Fraction of 50 most abundant TCRβ clonotypes shared between tumor sites A and B. Dots are colored by patient identity as in Figure 2A. (B) Fraction of all T cells for each tumor site (tumor site A and site B) per patient (FL1-FL10), belonging to each T-cell subpopulation (left). Bars are colored by T-cell subpopulation as in Figure 5A. Spearman correlation between site-to-site abundance ratio of each T-cell subpopulation and tumor cell dissimilarity (quantified by Renkonen SI) (right). (C) Spearman correlation between site-to-site abundance ratio for Tfh cells and tumor cell dissimilarity (quantified by SI). Dots are colored by patient identity. (D) Spearman correlation of CD40 expression in tumor cells and MKI67 expression in Tfh cells of all 20 tumor samples. Dots are colored by patient identity.
Consistent with the TCR results, almost all phenotypic T-cell subpopulations were present at both sites in each patient, resulting in less site-to-site variance of the global T-cell landscape (SI range, 0.76-0.90) compared with the tumor subpopulations (Figure 6B). Evaluating individual T-cell subpopulations, we found that Tfh, activated, and CD4-naive T cells exhibited variance between the 2 tumor sites, but only differences in Tfh cell abundance between sites correlated with site-to-site tumor cell dissimilarity (r = 0.81; P = .008; Figure 6B-C). Finally, we evaluated T-cell gene-expression differences by focusing on clinically relevant checkpoint molecules24 and found significant differences in expression between sites, with the greatest heterogeneity seen in patients who had also exhibited the most dissimilar tumor profiles between sites (supplemental Figure 7B).
Elucidating interactions between tumor and Tfh cells
To further explore the molecular mechanism underlying the connection between tumor and Tfh cells, we first inferred potential receptor-ligand pair interactions34 between tumor and T cells. Focusing on tumor-Tfh interactions, we observed many significantly enriched receptor-ligand pairs between the 2 populations, including CD40-CD40LG, known to be a major communication route between B cells and Tfh cells35-38 (supplemental Figure 7C). Additional enriched interactions included BTLA-TNFRSF14, IL21-IL21R, and CXCL13-CXCR5; all important in normal B cells and potentially in lymphoma.26,39-42
Analyzing all 20 tumor samples, we identified a specific and significant correlation between tumor CD40 expression and Tfh proliferation (r = 0.66; P = .002), not seen with Tregs or activated T cells (Figure 6D; supplemental Figure 7D), indicative that CD40 signaling may contribute to increased Tfh numbers in FL as described for normal B cell-Tfh interactions.43,44 We found additional biologically relevant associations between tumor and Tfh cells, including, for example, a strong correlation between BCR pathway genes and adhesion-related genes in Tfh cells (supplemental Table 5).
Concordance of independent measures of site-to-site heterogeneity
Having measured site-to-site heterogeneity with multiple orthogonal single-cell methods, we compared results of these different methods for each patient (Figure 7A). Plotting z scores of BCR phylogeny SI, tumor cell gene-expression SI, tumor cell flow cytometry SI, and the Tfh cell abundance ratio for each patient, we found that each of these methods classified patients similarly. Some patients exhibited homogeneity between sites at the genetic, phenotypic, and microenvironmental levels, whereas others harbored tumors dissimilar by all of these independent measures (Figure 7).
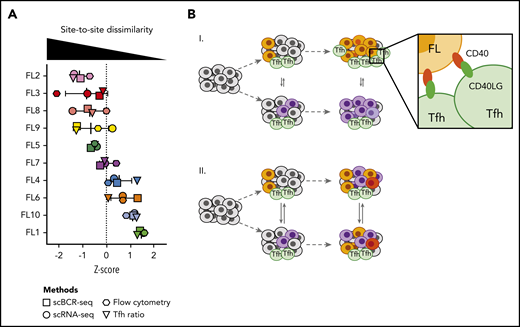
Multiple orthogonal single-cell methods reveal site-to-site heterogeneity in FL. (A) Summary plot showing the degree of site-to-site dissimilarity for each single-cell method (symbols) for each patient (FL1-FL10). Site-to-site dissimilarity is quantified by Renkonen SI for scBCR-seq, scRNA-seq, and flow cytometry and by site-to-site abundance ratio for Tfh cells. (B) Model illustrating (I) cases with divergent clonal evolution and little cell migration leading to significant site-to-site heterogeneity, including in recruitment and co-option of Tfh cells, compared to (II) cases with high degree of tumor cell migration between sites, leading to increased sharing of evolving subclones.
Multiple orthogonal single-cell methods reveal site-to-site heterogeneity in FL. (A) Summary plot showing the degree of site-to-site dissimilarity for each single-cell method (symbols) for each patient (FL1-FL10). Site-to-site dissimilarity is quantified by Renkonen SI for scBCR-seq, scRNA-seq, and flow cytometry and by site-to-site abundance ratio for Tfh cells. (B) Model illustrating (I) cases with divergent clonal evolution and little cell migration leading to significant site-to-site heterogeneity, including in recruitment and co-option of Tfh cells, compared to (II) cases with high degree of tumor cell migration between sites, leading to increased sharing of evolving subclones.
Clinical correlates of site-to-site heterogeneity
To determine the association between clinical parameters and site-to-site heterogeneity, we first examined individual growth histories of the biopsied sites (tumor sites A and B; supplemental Figure 8A-D). Tumors from patient FL8 had divergent phenotypes on biopsy and divergent tumor growth curves preceding the biopsy, whereas tumors from patient FL10, which had concordant tumor phenotypes, also had relatively concordant prior tumor growth trajectories prior to biopsy. However, cases illustrating the opposite relationship were also observed (patient FL3 and FL1).
18F-fluorodeoxyglucose positron emission tomography (PET)-computed tomography scans, available for 7 patients, revealed a nonsignificant correlation between site-to-site differences in the tumor gene-expression profiles and site-to-site differences in the maximum standard uptake value (r = 0.75; P = .07; supplemental Figure 8E; supplemental Table 1), suggesting that only some aspects of site-to-site heterogeneity may be reflected in PET data. There was no association between tumor gene-expression site-to-site heterogeneity and age (r = 0.17; P = .64), stage (P = .89), Follicular Lymphoma International Prognostic Index (FLIPI) (P = .91) at diagnosis, nor to prior treatment regimens (local vs systemic therapy; P = .89).
As flow cytometry identified a similar spectrum of site-to-site heterogeneity as that concluded from scRNA-seq analysis (supplemental Figure 5C), we analyzed an additional 12 FL patients who were previously untreated and for whom we had multisite flow cytometry data available (supplemental Table 2). Importantly, we observed a similar range of tumor heterogeneity among untreated and previously treated patients (P = .17; supplemental Figure 8F). To further elucidate the clinical impact of heterogeneity of independent sites of disease, the future outcomes of these patients are being tracked.
Discussion
Our study demonstrates the significant limitations of a solitary biopsy in defining the cellular and molecular characteristics of FL, challenging attempts to predict clinical outcomes. We provide evidence using multiple orthogonal methods that evolutionary divergence of genetic and phenotypic profiles can occur across tumor sites in FL patients. Observed differences in tumor populations between sites were in genes and pathways known to be involved in FL pathogenesis. Differences in T cells between sites were mainly in the Tfh population, increasingly recognized as a key player in tumor–T-cell interactions. Because we sampled only 2 among many possible sites of disease in these patients, our results likely underestimate the prevalence of divergent site-to-site evolution in FL.
We leveraged single-cell BCR sequencing of uniquely “barcoded” individual B cells to define subclone structure and clonal relationships between sites. Our results illustrate 2 disparate scenarios. Tumor subclones either migrate freely between the different body compartments, resulting in similar tumor composition at distinct tumor locations, or, alternatively, distinct tumor locations evolve independently, where certain subclones are restricted to specific sites, leading to complex phenotypic disease heterogeneity within a patient. This phenomenon of divergent evolution could be driven by genetic instability, epigenetic events, and/or antitumor therapy. Since previously untreated patients also exhibit genetic13 and proteomic differences between tumor sites, we suggest that divergent evolution can occur in the absence of prior treatment. We hypothesize that genetic alterations drive some lymphoma subclones to lose their innate propensity to migrate between lymphoid organs and instead establish local, genetically, and phenotypically distinct tumor populations that may, in turn, influence their local microenvironment. In contrast, most T cells, even TCR clones, appear to migrate extensively between distinct lymphoma sites.
Our analysis contains the most comprehensive single-cell level analysis of the FL TME to date, characterizing >50 000 nonmalignant cells, comprising T-cell subsets, B cells, and multiple subsets of NK and myeloid cells. Although most of these subpopulations did not differ substantially between sites, we found that Tfh cells were uniquely linked to tumor cell phenotype, where divergence in one aligned with divergence in the other. Previous studies demonstrated that FL tumors are enriched in Tfh cells, which may support tumor cell survival through IL4 and CD40LG signaling.36-38,45,46 CD40-CD40LG signaling was also among the highly significant interactions between tumor and Tfh cells in our study, with a strong correlation between tumor CD40 expression and Tfh proliferation, suggesting that this axis may contribute to a tumor-supportive TME by inducing expansion of Tfh cells. Whether tumor cell heterogeneity leads to differential ability to co-opt Tfh cells or whether Tfh cell signals exert selective pressure and act as additional drivers of tumor heterogeneity should be a focus of future investigations.
The clinical implications of site-to-site heterogeneity are many. Foremost is that evaluation and interpretation of biomarkers within a single tumor biopsy are fundamentally limited in accounting for the biological spectrum of disease in patients. For example, expression of genes included in molecular scores such as the 23-gene-expression profiling score47 may be inaccurately assessed in individuals with multisite disease. Second, divergent tumors in the same patient may rely on different genes and signaling pathways and may respond differentially to targeted therapies. For example, patient FL2’s tumor cells from site A appear to interact highly with their TME, reflected in an upregulation of antigen presentation and NF-κB signaling, whereas tumor cells from site B appear to be driven by tumor-intrinsic signals such as DNA repair mechanism and tumor cell adhesion. Additionally, we observed site-to-site differences in the expression of emerging therapeutic targets, like HDAC9 and CD79B, which would be predicted to influence each site’s response to histone deacetylase inhibitors or CD79B-directed therapies, respectively. Third, branched tumor evolution underscores the importance of targeting ubiquitous, so-called “truncal” mutations in FL (eg, CREBBP, KMT2D).48-50 Fourth, our data indicate that site-to-site heterogeneity also extends to important microenvironmental populations, hampering efforts to validate TME biomarkers while identifying bidirectional tumor-TME relationships on which to focus therapeutic efforts. Finally, site-to-site heterogeneity may correlate with early progression or histological transformation, given that these frequently occur in an asynchronous manner, and thus may help to better define high-risk patients at the time of diagnosis.
A strength of this study was the use of FNA biopsies, which provided a reliable approach to successfully evaluate the composition of both tumor cells and the associated cells of the TME from multiple tumor sites of lymphoma.14,51 The ability to collect fresh, viable cells from tumors with excellent yield using a minimally invasive technique is an advantage for immunologic and molecular studies. While this minimally invasive approach greatly facilitated patient compliance, our study is restricted to the analysis of cell suspensions instead of intact tissue, which limited the breadth of our analyses especially with regard to spatial profiling. On the other hand, the use of cell suspensions allowed us to detect site-to-site heterogeneity using flow cytometry, providing an approach by which this parameter could be more rapidly evaluated in future studies.
In summary, by integrating phylogenetic, phenotypic, and transcriptomic analyses at the single-cell level, we find site-to-site evolutionary divergence to be common in FL. Site-to-site heterogeneity warns of difficulties in biomarker development, contributes to challenges in personalized medicine, and may predict histologic transformation or therapeutic resistance. In the future, strategies for assessment of site-to-site heterogeneity, as described here or, if validated, using circulating tumor DNA, which might integrate information from all sites, should be considered for prospective clinical trials to account for site-to-site variation in patient samples and for subsequent correlation with both prognosis and treatment response.
scRNA-seq data have been deposited to the National Center for Biotechnology Information dbGaP (study accession phs002188). All other relevant data and codes used in this work are available upon reasonable request from the corresponding author.
The online version of this article contains a data supplement.
The publication costs of this article were defrayed in part by page charge payment. Therefore, and solely to indicate this fact, this article is hereby marked “advertisement” in accordance with 18 USC section 1734.
Acknowledgments
The authors thank members of the R.L. and H.P.J. laboratories for critical discussion; Rachel Greenstein, Alyssa Kanegai, and Ami Okada for assistance with sample acquisition; and Shoshana Levy, Sean Collins, and Stefan Alig for careful reading of the manuscript and constructive remarks. Figures 1 and 3A, supplemental Figure 3A and the visual abstract were created with the aid of BioRender.com.
This work was supported by National Institutes of Health (NIH) National Cancer Institute grant R35 CA197353 (R.L.), Leukemia & Lymphoma Society grant TRP 6539-18 (R.L.), the Hoogland Lymphoma Research Fund (R.L.), NIH National Human Genome Research Institute grants P01HG000205 (H.P.J., S.M.G.) and R01HG006137 (H.P.J.), and NIH National Cancer Institute grant U01CA217875 (H.P.J., A.S.). S.H. was supported by a Mildred Scheel postdoctoral fellowship from the Deutsche Krebshilfe (70113507). T.S. was supported by NIH National Heart, Lung, and Blood Institute grant 5T32HL120824-04, the American Cancer Society (PF-17-239-01-LIB), and the Parker Institute of Cancer Immunotherapy. H.P.J. also received support from the American Cancer Society (124571-RSG-13-297-01) and the Clayville Foundation.
The content is solely the responsibility of the authors and does not represent the official views of any funding agency listed in the funding/support note.
Authorship
Contribution: S.H., T.S., A.S., H.P.J., and R.L. designed the study; S.H., T.S., and A.S. performed single-cell experiments; S.H., T.S., A.S., G.D., and S.M.G. processed and analyzed scRNA-seq and scBCR-seq data; D.K.C. performed and analyzed flow cytometry experiments; T.S. and M.S.B. analyzed and interpreted PET data; B.M. and S.R.L. performed the fine-needle aspirates and collected clinical samples; S.H., T.S., A.S., G.D., D.K.C., S.M.G., H.L., H.P.J., and R.L. interpreted the data; and S.H., T.S., H.P.J., and R.L. wrote the manuscript with input from all authors.
Conflict-of-interest disclosure: The authors declare no competing financial interests.
Correspondence: Ronald Levy, Division of Oncology, Stanford University, 269 Campus Dr, CCSR 1105, Stanford, CA 94305; e-mail: levy@stanford.edu.

This feature is available to Subscribers Only
Sign In or Create an Account Close Modal