

Key Points
CD10-ve PreProB-progenitors are the earliest fetal B-lymphoid–restricted progenitors and are enriched in fetal BM.
Fetal PreProB-progenitors have a unique ontogeny-related developmental gene expression program distinct from their rare adult counterparts.

Abstract
Human lymphopoiesis is a dynamic lifelong process that starts in utero 6 weeks postconception. Although fetal B-lymphopoiesis remains poorly defined, it is key to understanding leukemia initiation in early life. Here, we provide a comprehensive analysis of the human fetal B-cell developmental hierarchy. We report the presence in fetal tissues of 2 distinct CD19+ B-progenitors, an adult-type CD10+ve ProB-progenitor and a new CD10-ve PreProB-progenitor, and describe their molecular and functional characteristics. PreProB-progenitors and ProB-progenitors appear early in the first trimester in embryonic liver, followed by a sustained second wave of B-progenitor development in fetal bone marrow (BM), where together they form >40% of the total hematopoietic stem cell/progenitor pool. Almost one-third of fetal B-progenitors are CD10-ve PreProB-progenitors, whereas, by contrast, PreProB-progenitors are almost undetectable (0.53% ± 0.24%) in adult BM. Single-cell transcriptomics and functional assays place fetal PreProB-progenitors upstream of ProB-progenitors, identifying them as the first B-lymphoid–restricted progenitor in human fetal life. Although fetal BM PreProB-progenitors and ProB-progenitors both give rise solely to B-lineage cells, they are transcriptionally distinct. As with their fetal counterparts, adult BM PreProB-progenitors give rise only to B-lineage cells in vitro and express the expected B-lineage gene expression program. However, fetal PreProB-progenitors display a distinct, ontogeny-related gene expression pattern that is not seen in adult PreProB-progenitors, and they share transcriptomic signatures with CD10-ve B-progenitor infant acute lymphoblastic leukemia blast cells. These data identify PreProB-progenitors as the earliest B-lymphoid–restricted progenitor in human fetal life and suggest that this fetal-restricted committed B-progenitor might provide a permissive cellular context for prenatal B-progenitor leukemia initiation.
Introduction
The developmental hierarchy of human fetal B-lymphopoiesis has not been fully defined. Although the presence of B-lineage cells has been noted in human fetal liver by 7 to 8 postconceptional weeks (pcw) and in fetal blood and bone marrow (BM) by 12 pcw,1,,,,-6 their functional and molecular properties were not characterized. Indeed, it is only recently that progenitors with B-lineage potential that are present exclusively or principally in fetal rather than adult tissues have been reported in humans. Interest in these cells is considerable as potential targets for leukemic transformation given that many childhood and all infant B-lineage acute lymphoblastic leukemias (ALLs) originate in fetal life.7 A CD19–CD127+ progenitor with multi-lymphoid or lympho-myeloid potential has been described in fetal liver8,9 and a CD7+ progenitor with lympho-myeloid output in fetal BM.10 However, expression of CD19 is considered the definitive marker of B-cell commitment, and in adult BM, the earliest B-lineage–restricted progenitor reported is a ProB-progenitor (CD34+CD10+CD19+) (reviewed elsewhere11 ). The presence of a second B-progenitor, a PreProB-progenitor (CD34+CD10–CD19+) has been noted in cord blood.12,13 Although we also noted a CD34+CD10–CD19+ population in second-trimester fetal liver, we did not characterize these cells at the molecular or functional level.14 Thus, the identity of the earliest committed B-progenitor in human fetal life remains unclear.
To address this, we performed a comprehensive immunophenotypic, functional, and molecular characterization of human fetal B-lymphoid development to define the fetal B-cell developmental hierarchy for the first time. We show that by 7 pcw, both CD10-ve PreProB- and CD10+ve ProB-progenitors are present in embryonic liver before a second wave of B-progenitor development is initiated in fetal BM 4 weeks later. We show for the first time that in fetal tissues, PreProB-progenitors are the earliest B-lymphoid–restricted progenitors in the B-cell developmental hierarchy and that they lie upstream of ProB-progenitors from which they are transcriptionally distinct and downstream of early lymphoid progenitors (ELPs; Lin–CD34+CD127+CD10–CD19–).
Methods
Samples
Fetal tissue was collected after receipt of written informed consent and approval by the Hammersmith, Queen Charlotte’s and Chelsea and Acton Hospitals Ethics Committee (04/Q0406/145). Donated fetal tissue was also provided by the Human Developmental Biology Resource (www.hdbr.org) regulated by the UK Human Tissue Authority (www.hta.gov.uk). Normal adult BM was collected during elective orthopedic surgery after receipt of written informed consent and approval by INForMeD HRA (IRAS 199833; REC no. 16/LO/1376). Otherwise, adult BM mononuclear cells were purchased from Stemcell Technologies and Lonza. Infant ALL samples used for comparison are from published data sets.15,16
MS-5 stromal cocultures
One hundred flow-sorted fetal BM CD34+ hematopoietic stem and progenitor cells (HSPCs) were cocultured on confluent MS-5 stroma in Gibco MEM α (Thermo Fisher Scientific) supplemented with 10% heat-inactivated batch-tested fetal bovine serum, 100 U/mL penicillin, 100 μg/mL streptomycin, 2 mM l-glutamine, 50 μM 2-mercaptoethanol, 10 mM N-2-hydroxyethylpiperazine-N′-2-ethanesulfonic acid, stem cell factor (SCF; 20 ng/mL), Flt3-ligand (10 ng/mL), interleukin-2 (IL-2; 10 ng/mL), and IL-7 (5 ng/mL) in 24-well plates. Cultures were maintained and output analyzed as previously described.14
OP9-DL1 stromal coculture
OP9 stromal cells were a gift from Adrian Thrasher (Institute of Child Health, University College, London, United Kingdom). OP9-DL1 stromal cells were grown to confluency and passaged as previously described.17 Further details are given in the supplemental Methods (available on the Blood Web site).
Fetal mesenchymal stromal cell stromal cocultures
Fetal BM mesenchymal stromal cells (MSCs) were isolated by plating 1 to 2 × 10⁶ freshly isolated mononuclear cells in Gibco MEM α supplemented with 10% heat-inactivated fetal bovine serum, 100 U/mL penicillin, 100 μg/mL streptomycin, 2 mM l-glutamine, 50 μM 2-mercaptoethanol, and 10 mM N-2-hydroxyethylpiperazine-N′-2-ethanesulfonic acid. After 72 to 96 hours, nonadherent cells were removed and adherent cells cultured until confluent before being passaged using 0.05% trypsin/EDTA. MSCs were immunophenotypically characterized by using flow cytometry.18 Twenty-four hours before coculture, MSCs were irradiated with 20 Gy and plated in 24-well plates at 0.05 × 10⁶ to 0.1 × 10⁶ cells per well to reach confluence within 24 hours. A total of 500 to 1000 sorted fetal BM HSPCs were seeded per well and cocultured with cytokines as described for MS-5 cocultures. Cocultures were replenished with half-media changes every 3 to 4 days. Wells were harvested at days 3, 7, 14, 21, and 28 for analysis by flow cytometry.
Clonogenic assays
Myeloid and erythroid differentiation potential of 100 sorted HSPCs were assessed by using colony-forming assays as previously described.14
Bulk RNA-sequencing
For fetal BM bulk RNA-sequencing, the SMART-Seq2 protocol was followed.19 Briefly, 100 purified HSPCs were sorted into lysis buffer containing 0.4% Triton X-100 (MilliporeSigma), RNase inhibitor (Clontech Laboratories), 2.5 mM dNTPs (Thermo Fisher Scientific), and 2.5 μM oligo-dT30VN primer (Biomers.net). Complementary DNA (cDNA) was generated by using SuperScript II (Thermo Fisher Scientific) and preamplified by using KAPA HiFi HotStart ReadyMix (KAPA Biosystems) using 18 cycles of amplification. After polymerase chain reaction (PCR) amplification, cDNA libraries were purified with AMPure XP beads (Beckman Coulter) according to the manufacturer’s instructions. Postpurification libraries were resuspended in Buffer EB (Qiagen). The quality of cDNA traces was assessed by using a High Sensitivity DNA Kit in a Bioanalyzer instrument (Agilent Technologies). Tagmentation and library preparation were performed by using the Nextera XT DNA Library Preparation Kit (Illumina) according to manufacturer’s instructions. Libraries were sequenced on an Illumina HiSeq4000 to generate 75 bp paired-end reads, yielding >30 million reads per sample.
Single-cell quantitative reverse transcription PCR
Gene expression was assessed by using the Biomark HD microfluidics system (Fluidigm). Single HSPCs were index-sorted into 96-well plates containing preamplification mix and processed as previously described.20 Sorted cells were simultaneously analyzed for relative levels of expression of genes with known roles in hematopoiesis, B-lymphopoiesis, and/or leukemia (supplemental Tables 1 and 2). Gene expression was normalized to average expression of 3 housekeeping genes (B2M, GAPDH, and ACTB) and plotted by using ggplot2. Diffusion pseudotime analysis was performed on log2(relative expression + 1) data using the R package “destiny” (version 2.10.2) with the distance metric set to “rankcor.”21,22 Scatter plots were generated by using Partek software (Partek Inc.).
IgH gene rearrangement analysis
Samples were screened for immunoglobulin heavy chain (IgH) complete (VH-DH-JH) and IgH incomplete (DH-JH) rearrangements by using BIOMED-2 protocols to detect clonality. Using the fluorescence-activated cell sorting method, cells were sorted into phosphate-buffered saline and the pellets frozen. DNA was whole-genome amplified by using a Qiagen REPLI-g single-cell kit. Heteroduplex analysis was used after PCR reactions.23 PCR products were excised and eluted from polyacrylamide gels and sequenced according to the BigDye Terminator v3.1 Cycle Sequencing Kit protocol (Thermo Fisher Scientific). Capillary electrophoresis was performed on a 24-capillary 3500xL Genetic Analyzer (Thermo Fisher Scientific). Sequences were entered into the National Center for Biotechnology Information IgBLAST tool for immunoglobulin domain identification and alignment, and annotated by using IMGT/V-QUEST.24
Assay for transposase-accessible chromatin (ATAC)–sequencing
The protocol was adapted for small cell numbers from Corces et al.25 2000 PreProB-progenitors and ProB-progenitors (n = 3) and 5000 Lin+ (CD2+CD3+CD14+CD16+CD56+CD235a+) mononuclear cells were sorted into a 25 μL transposase mix (Tn5 enzyme, 2X TD buffer, and 0.01% digitonin; Promega) at 4°C then immediately incubated at 37°C for 30 minutes at 300 rpm. Transposed DNA was purified by using a Qiagen MinElute kit and eluted in 10 μL prewarmed Buffer EB. Transposed fragments were amplified by PCR as previously described.26 Libraries were quantified by quantitative PCR (NEBNext Library Quant for Illumina kit) before sequencing using a 75-cycle paired-end kit on the NextSeq Illumina platform.
Please see supplemental Information for other experimental methods.
Statistical analysis
To compare experimental groups, Student t tests, Mann-Whitney U tests, the Wilcoxon test, and analysis of variance followed by multiple comparison testing were used (as indicated in the figure legends). Statistical analyses were performed by using GraphPad Prism v7.00 (GraphPad Software) or R v3.4.1 (R Foundation for Statistical Computing). Data are expressed as mean ± standard error of the mean (SEM) unless otherwise indicated.
Results
Onset and expansion of human B-lymphopoiesis occurs sequentially in fetal liver and fetal BM
To determine the onset of B-lymphopoiesis in fetal life, we measured the frequency of B-cells and their progenitors from 6 to 21 pcw using the immunophenotypic criteria shown in supplemental Table 3. In fetal liver, we found that immunophenotypic hematopoietic stem cells (HSCs), multipotent progenitors (MPPs), and a low frequency of lymphoid-primed multipotent progenitors (LMPPs) and ELPs are already present at the embryonic stage by 6 pcw (Figure 1A-C); PreProB-progenitors and ProB-progenitors, as well as a small number of B cells (CD34–CD19+), become detectable 1 week later (Figure 1D-F).
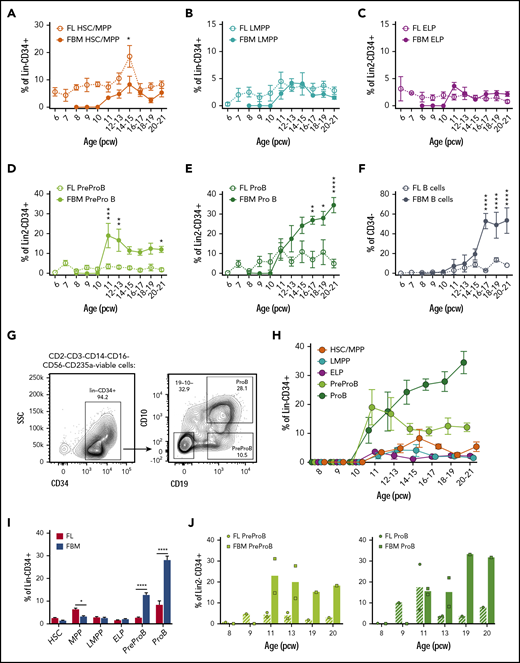
High frequency of B-progenitors in first- and second-trimester fetal BM (FBM). Frequency of fetal liver (FL) and FBM HSCs/MPPs (A) and LMPPs (B) from 6 to 21 pcw. Data are expressed as percentage of Lin−CD34+ (mean ± SEM, n = 59 for FL and n = 32-35 for FBM). Frequency of FL and FBM ELPs (C), PreProB-progenitors (D), and ProB-progenitors (E) from 6 to 21 pcw. Data are expressed as percentage of Lin2−CD34+ (mean ± SEM, n = 39 for FL and n = 32-38 for FBM). (F) Frequency of FL and FBM B cells (CD34–CD19+) from 6 to 21 pcw. Data are expressed as percentage of CD34– (mean ± SEM, n = 37 for FL; n = 38 for FBM). (G) Representative flow cytometric analysis of FBM Lin2−CD34+ cells showing the gating strategy used to identify CD10–CD34+CD19+ PreProB-progenitors and CD10+CD34+CD19+ ProB-progenitors. (H) Frequency of FBM HSCs/MPPs, LMPPs, ELPs, PreProB-progenitors, and ProB-progenitors from 8 to 21 pcw. Data are expressed as percentage of Lin2−CD34+ cells for B-progenitors and Lin−CD34+ cells for ELPs, HSCs/MPPs/LMPPs (mean ± SEM; n = 32-38). (I) Frequency of second-trimester (12-21 weeks) FL and FBM HSPC populations expressed as percentage of Lin−/Lin2−CD34+ cells (mean + SEM, n = 17-49 for FL and n = 16-27 for FBM). (J) Matched FL and FBM from the same biological samples, showing mean frequency of PreProB-progenitors and ProB-progenitors expressed as percentage of Lin2−CD34+ cells. Individual samples represented as circles for FL and squares for FBM. Lin: CD2, CD3, CD14, CD16, CD56, CD19, and CD235a. Lin2: CD2, CD3, CD14, CD16, CD56, and CD235a. All graphs show mean ± SEM where n ≥ 3. Statistical significance determined according to 2-way analysis of variance. *P < .05; ** P < .01; ***P < .001; ****P < .0001. SSC, side scatter.
High frequency of B-progenitors in first- and second-trimester fetal BM (FBM). Frequency of fetal liver (FL) and FBM HSCs/MPPs (A) and LMPPs (B) from 6 to 21 pcw. Data are expressed as percentage of Lin−CD34+ (mean ± SEM, n = 59 for FL and n = 32-35 for FBM). Frequency of FL and FBM ELPs (C), PreProB-progenitors (D), and ProB-progenitors (E) from 6 to 21 pcw. Data are expressed as percentage of Lin2−CD34+ (mean ± SEM, n = 39 for FL and n = 32-38 for FBM). (F) Frequency of FL and FBM B cells (CD34–CD19+) from 6 to 21 pcw. Data are expressed as percentage of CD34– (mean ± SEM, n = 37 for FL; n = 38 for FBM). (G) Representative flow cytometric analysis of FBM Lin2−CD34+ cells showing the gating strategy used to identify CD10–CD34+CD19+ PreProB-progenitors and CD10+CD34+CD19+ ProB-progenitors. (H) Frequency of FBM HSCs/MPPs, LMPPs, ELPs, PreProB-progenitors, and ProB-progenitors from 8 to 21 pcw. Data are expressed as percentage of Lin2−CD34+ cells for B-progenitors and Lin−CD34+ cells for ELPs, HSCs/MPPs/LMPPs (mean ± SEM; n = 32-38). (I) Frequency of second-trimester (12-21 weeks) FL and FBM HSPC populations expressed as percentage of Lin−/Lin2−CD34+ cells (mean + SEM, n = 17-49 for FL and n = 16-27 for FBM). (J) Matched FL and FBM from the same biological samples, showing mean frequency of PreProB-progenitors and ProB-progenitors expressed as percentage of Lin2−CD34+ cells. Individual samples represented as circles for FL and squares for FBM. Lin: CD2, CD3, CD14, CD16, CD56, CD19, and CD235a. Lin2: CD2, CD3, CD14, CD16, CD56, and CD235a. All graphs show mean ± SEM where n ≥ 3. Statistical significance determined according to 2-way analysis of variance. *P < .05; ** P < .01; ***P < .001; ****P < .0001. SSC, side scatter.
By contrast, we detected no CD34+ or B cells in embryonic BM until after 10 pcw, consistent with the absence of hematopoietic cells on 9- to 12-week fetal BM sections (data not shown) and as previously noted.5 PreProB-progenitors and ProB-progenitors (Figure 1G) are first seen in second-trimester fetal BM at 11 pcw, appearing concurrently with immunophenotypic HSCs/MPPs, LMPPs, and ELPs (Figure 1H). In fetal liver, the frequency of PreProB-progenitors and ProB-progenitors remains low and constant (2.5% ± 0.4% and 7.8% ± 2%, respectively) through the second trimester. Meanwhile, in fetal BM, B-lymphopoiesis dramatically expands, with PreProB-progenitors peaking immediately at the onset of BM hematopoiesis (19.4% ± 6.1% of CD34+ cells at 11 pcw) and ProB-progenitors rising steeply from 11% ± 4.4% at 11 pcw to >30% of all BM CD34+ cells toward the end of the second trimester (Figure 1D-E). Thus, PreProB-progenitors and ProB-progenitors are present at much higher frequency in the fetal BM at all gestations we assessed despite lower frequencies of HSCs/MPPs (Figure 1A,D,E,I). This also holds true when matched liver and BM from the same fetus are compared (n = 8) (Figure 1J). This also contrasts with adult BM, where PreProB-progenitors are virtually absent (Figure 2A). The high frequency of fetal BM PreProB-progenitors and ProB-progenitors in S-G2-M compared with HSCs, MPPs, and LMPPs (Figure 2B-C) suggests that B-progenitor proliferation underpins this rapid expansion rather than differentiation of upstream progenitors. Consistent with this finding, the frequency of CD34–CD19+ B cells (most of which are CD10+ PreB cells27 ) in fetal BM only starts to increase from 16 pcw (Figure 1H; Figure 2D).
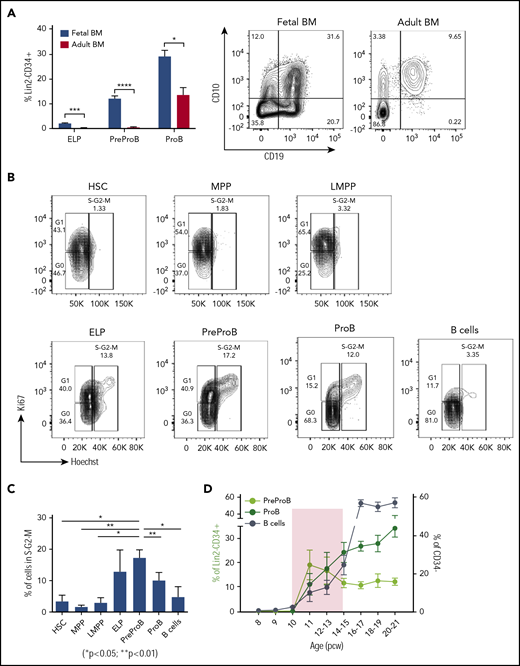
PreProB-progenitors are enriched in fetal life, and B-progenitor expansion is favored over differentiation in a narrow developmental time window. (A) Frequency of ELPs, PreProB-progenitors, and ProB-progenitors in the Lin2−CD34+ compartment of second-trimester fetal BM (n = 29-32, 12-21 pcw) and adult BM (n = 6). Representative flow plots for PreProB-progenitors and ProB-progenitors are shown on the right. Statistical significance determined by unpaired Student t test: *P < .05; ***P < .001; ****P < .0001. (B) Cell cycle analysis by flow cytometry: representative flow plots of fetal BM HSPC populations showing the proportion of cells in G0, G1, and S-G2-M phases. (C) Percentage of cells in S-G2-M phase in each fetal BM HSPC population. Data represented as mean + SEM (n = 3). Statistical significance determined by paired Student t test. (D) Changes in frequency of fetal BM PreProB-progenitors, ProB-progenitors, and B cells from 8 to 21 pcw. B cells are shown as percentage of CD34– cells and B-progenitors as percentage of Lin2–CD34+ (n = 32-38). Shaded area highlights the developmental time window when B-progenitor expansion occurs before B-cell differentiation. Lin2 antibody cocktail: CD2, CD3, CD14, CD16, CD56, and CD235a.
PreProB-progenitors are enriched in fetal life, and B-progenitor expansion is favored over differentiation in a narrow developmental time window. (A) Frequency of ELPs, PreProB-progenitors, and ProB-progenitors in the Lin2−CD34+ compartment of second-trimester fetal BM (n = 29-32, 12-21 pcw) and adult BM (n = 6). Representative flow plots for PreProB-progenitors and ProB-progenitors are shown on the right. Statistical significance determined by unpaired Student t test: *P < .05; ***P < .001; ****P < .0001. (B) Cell cycle analysis by flow cytometry: representative flow plots of fetal BM HSPC populations showing the proportion of cells in G0, G1, and S-G2-M phases. (C) Percentage of cells in S-G2-M phase in each fetal BM HSPC population. Data represented as mean + SEM (n = 3). Statistical significance determined by paired Student t test. (D) Changes in frequency of fetal BM PreProB-progenitors, ProB-progenitors, and B cells from 8 to 21 pcw. B cells are shown as percentage of CD34– cells and B-progenitors as percentage of Lin2–CD34+ (n = 32-38). Shaded area highlights the developmental time window when B-progenitor expansion occurs before B-cell differentiation. Lin2 antibody cocktail: CD2, CD3, CD14, CD16, CD56, and CD235a.
These data show that although immunophenotypic PreProB-progenitors and ProB-progenitors appear first in embryonic liver at 7 pcw and persist there at low frequency in fetal life, the major site of fetal B-lymphopoiesis is in fetal BM. A second wave of B-lymphopoiesis starting at 11 pcw fetal BM is propagated by rapid expansion/self-renewal of PreProB-progenitors during a narrow time window in the early second trimester followed by a switch to predominantly ProB-progenitor expansion and differentiation thereafter (Figure 2D).
Fetal BM PreProB-progenitors give rise solely to B-lineage cells in vitro and in vivo
To determine whether both PreProB-progenitors and ProB-progenitors are committed to the B-lineage or retain residual non–B-lymphoid/myeloid output, we first cultured flow-sorted, immunophenotypically defined fetal BM HSPCs (supplemental Figure 1) on MS-5 stroma (B/natural killer [NK]–cell and myeloid potential), OP9-DL1 stroma (T-cell potential) or in methylcellulose (myeloid/erythroid potential). PreProB-progenitors and ProB-progenitors both give rise to B cells in MS-5 cocultures with no T-cell (CD4+/CD8+) potential on OP9-DL1 cocultures (Figure 3A-B; supplemental Figure 2A-B). By contrast, although ELPs give rise to predominantly B-lineage cells, including PreProB-progenitors and ProB-progenitors and B cells, they also generate CD34+CD10+CD19– progenitors, T cells, NK cells, and a small number of myeloid cells, supporting their position upstream of committed B-progenitors (Figure 3A-C). Fetal BM HSCs, MPPs, and LMPPs from the same samples also generate a mixture of myeloid, B, NK, and T cells. Similarly, in methylcellulose assays, myeloid clonogenic output was observed from HSCs, MPPs, and LMPPs, although not from ELPs (Figure 3D). In addition, no evidence of engraftment of human cells (at 9 or 14 weeks) was seen after transplantation of PreProB-progenitors or ProB-progenitors (10 000-30 000 cells) into sublethally irradiated NSG (NOD.Cg-PrkdcscidIl2rgtmlWjl/SzJ) mice consistent with a lack of stem cell capacity (data not shown).
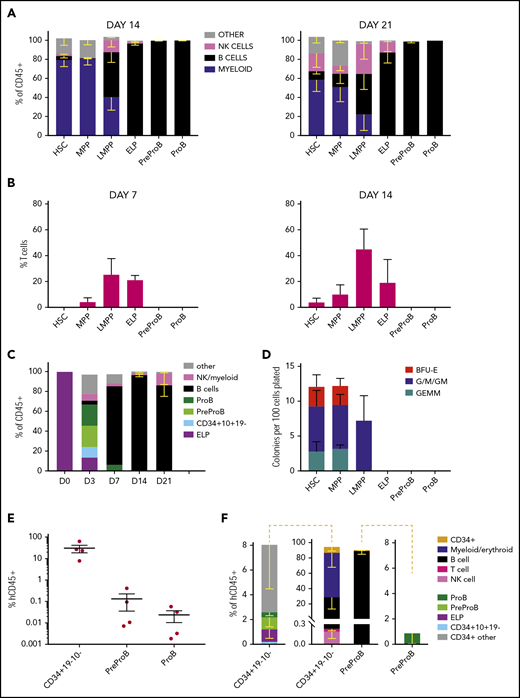
Fetal BM PreProB-progenitors and ProB-progenitors are committed to the B-lymphoid lineage. (A) Cell frequency at day 14 and day 21 after coculturing flow-sorted fetal BM HSPCs on murine MS-5 stromal cells with cytokines (FLT3L, SCF, IL-7, and IL-2). Data shown as percentage of human CD45+ cells (mean - SEM, n = 3-5). (B) Frequency of T cells (CD4+ and/or CD8+) produced by day 7 and day 14 after coculturing flow-sorted fetal BM HSPCs on OP9-DL1 (GFP+) stroma with cytokines (FLT3L and IL-7). Data shown as percentage of GFP– human cells (mean + SEM, n = 4). (C) B-cell differentiation assay of flow-sorted ELPs cocultured on MS-5 stromal cells with cytokines (FLT3L, SCF, IL-7, and IL-2) showing output on days 3, 7, and 14 (results expressed as mean − SEM, n = 2-4). (D) Myeloid clonogenic assays showing day 14 colony readout from flow-sorted fetal BM HSPCs in methylcellulose colony assays (data shown as mean + SEM, n = 4). (E) Engraftment of fetal BM Lin2–CD34+CD19–CD10– progenitors, PreProB-progenitors, and ProB-progenitors in the BM of NSG mice 2 to 3 weeks after transplantation (n = 4 for each progenitor population; total n = 12). Data shown as a percentage of human CD45 (hCD45) cells of all CD45+ cells in mouse BM (mean ± SEM). (F) Identity of hCD45+ cells engrafted in mouse BM 2 to 3 weeks posttransplant. The plot in the center shows the breakdown of all human CD45+ cells, and the plots on either side of the central plot detail the progenitors identified in hCD45+CD34+ cells.
Fetal BM PreProB-progenitors and ProB-progenitors are committed to the B-lymphoid lineage. (A) Cell frequency at day 14 and day 21 after coculturing flow-sorted fetal BM HSPCs on murine MS-5 stromal cells with cytokines (FLT3L, SCF, IL-7, and IL-2). Data shown as percentage of human CD45+ cells (mean - SEM, n = 3-5). (B) Frequency of T cells (CD4+ and/or CD8+) produced by day 7 and day 14 after coculturing flow-sorted fetal BM HSPCs on OP9-DL1 (GFP+) stroma with cytokines (FLT3L and IL-7). Data shown as percentage of GFP– human cells (mean + SEM, n = 4). (C) B-cell differentiation assay of flow-sorted ELPs cocultured on MS-5 stromal cells with cytokines (FLT3L, SCF, IL-7, and IL-2) showing output on days 3, 7, and 14 (results expressed as mean − SEM, n = 2-4). (D) Myeloid clonogenic assays showing day 14 colony readout from flow-sorted fetal BM HSPCs in methylcellulose colony assays (data shown as mean + SEM, n = 4). (E) Engraftment of fetal BM Lin2–CD34+CD19–CD10– progenitors, PreProB-progenitors, and ProB-progenitors in the BM of NSG mice 2 to 3 weeks after transplantation (n = 4 for each progenitor population; total n = 12). Data shown as a percentage of human CD45 (hCD45) cells of all CD45+ cells in mouse BM (mean ± SEM). (F) Identity of hCD45+ cells engrafted in mouse BM 2 to 3 weeks posttransplant. The plot in the center shows the breakdown of all human CD45+ cells, and the plots on either side of the central plot detail the progenitors identified in hCD45+CD34+ cells.
To better capture the ability of PreProB-progenitors and ProB-progenitors to give rise to B cells in vivo and to assess any residual myeloid capacity, we next measured engraftment of flow-sorted fetal BM PreProB-progenitors, ProB-progenitors, and upstream Lin−CD34+CD19–CD10– progenitors 2 and 3 weeks after transplantation into NSG mice. In this short-term xenograft assay, PreProB-progenitors give rise to ProB-progenitors and B cells only, whereas upstream CD34+CD19–CD10– cells give rise to multilineage output, including ELPs, PreProB-progenitors, and ProB-progenitors (Figure 3E-F). ProB-progenitors give rise solely to B cells, although engraftment was very low (0.002%-0.057% human CD45+ cells) and not accurately assessable in 2 of 4 cases. Together, these data show that PreProB-progenitors have no myeloid, T-cell, or NK-cell output and, like ProB-progenitors, are committed to the B-lineage.
Finally, because MS-5 and OP9-DL1 cocultures use murine stromal cells, we wondered if functional differences in the 2 types of fetal BM B-progenitors could be better identified using a more physiological microenvironment. To investigate this theory, and to determine the hierarchical relationship between PreProB-progenitors and ProB-progenitors, we cocultured flow-sorted fetal BM PreProB-progenitors and ProB-progenitors on primary human fetal BM MSCs (supplemental Figure 3A) and measured the output of progenitors and mature lymphoid and myeloid cells. In fetal MSC cocultures, PreProB-progenitors (CD10-ve) acquire surface CD10 in vitro, giving rise to ProB-progenitors and B cells (Figure 4A; supplemental Figure 3B). By contrast, almost all ProB-progenitors lose surface CD34 expression within 3 days of culture to become B cells, and no PreProB-progenitors are generated. Fetal BM ELPs from the same samples give rise to myeloid, NK-, and B-lineage cells (including PreProB-progenitors, ProB-progenitors, and B cells) on human fetal BM MSCs (data not shown). These data support the model of B-progenitor differentiation that places PreProB-progenitors upstream of ProB-progenitors and downstream of ELPs in the fetal BM B-cell differentiation hierarchy. Consistent with this scenario, complete rearrangements of the IgH locus (VDJ) are not detected in LMPPs, ELPs, or PreProB-progenitors, whereas incomplete IgH rearrangements (DJ) are detected in some ELPs and PreProB-progenitors and DJ or VDJ rearrangements in all ProB-progenitors, as well as complete VDJ rearrangements in CD34–CD19+ B cells (Figure 4B; supplemental Table 4). As previously described for fetal B cells,27,28 fetal BM B-progenitors also exhibit preferential usage of IGHD7-27.
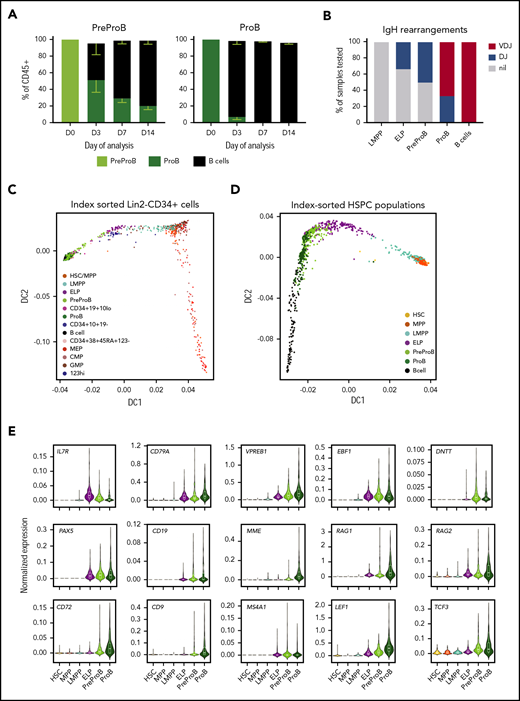
Fetal BM CD10– PreProB-progenitors lie upstream of CD10+ ProB-progenitors in the fetal B-cell developmental hierarchy. (A) B-cell differentiation assay of flow-sorted PreProB-progenitors and ProB-progenitors cocultured on fetal BM MSCs with cytokines (FLT3L, SCF, IL-7, and IL-2) showing proportions of progenitors and mature B-cells produced by days 3, 7, and 14 (results expressed as mean - SEM, n = 3). (B) Pattern of IgH gene rearrangement detected in whole-genome amplified DNA from flow-sorted fetal BM HSPCs expressed as percentage of samples tested (n = 3-7 for each sub-population). (C) Diffusion map of single-cell qRT-PCR (total of 938 cells from 2 biological samples) of index-sorted Lin2−CD34+ or Lin2−CD34–CD19+ fetal BM cells showing B-lymphoid and myeloid/erythroid differentiation trajectories. Genes and TaqMan probes detailed in supplemental Table 1. (D) Diffusion map of single-cell qRT-PCR (total of 1400 cells from 3 biological samples) of flow-sorted fetal BM HSPCs and B cells showing differentiation trajectory from HSCs through to B cells. Genes and TaqMan probes are detailed in supplemental Table 2. (E) Normalized gene expression of selected B cell–associated genes in flow-sorted fetal BM HSPCs by single-cell qRT-PCR (total of 1400 cells from 3 biological samples) .
Fetal BM CD10– PreProB-progenitors lie upstream of CD10+ ProB-progenitors in the fetal B-cell developmental hierarchy. (A) B-cell differentiation assay of flow-sorted PreProB-progenitors and ProB-progenitors cocultured on fetal BM MSCs with cytokines (FLT3L, SCF, IL-7, and IL-2) showing proportions of progenitors and mature B-cells produced by days 3, 7, and 14 (results expressed as mean - SEM, n = 3). (B) Pattern of IgH gene rearrangement detected in whole-genome amplified DNA from flow-sorted fetal BM HSPCs expressed as percentage of samples tested (n = 3-7 for each sub-population). (C) Diffusion map of single-cell qRT-PCR (total of 938 cells from 2 biological samples) of index-sorted Lin2−CD34+ or Lin2−CD34–CD19+ fetal BM cells showing B-lymphoid and myeloid/erythroid differentiation trajectories. Genes and TaqMan probes detailed in supplemental Table 1. (D) Diffusion map of single-cell qRT-PCR (total of 1400 cells from 3 biological samples) of flow-sorted fetal BM HSPCs and B cells showing differentiation trajectory from HSCs through to B cells. Genes and TaqMan probes are detailed in supplemental Table 2. (E) Normalized gene expression of selected B cell–associated genes in flow-sorted fetal BM HSPCs by single-cell qRT-PCR (total of 1400 cells from 3 biological samples) .
Gene expression profiling confirms that PreProB-progenitors lie upstream of ProB-progenitors
To confirm the B-progenitor hierarchy at the molecular level and investigate the transcriptional changes during B-progenitor differentiation, we first performed transcriptional profiling of index-sorted single fetal BM cells (Lin2−CD34+ HSPCs and Lin2−CD34–CD19+ B cells; gating strategy shown in supplemental Figure 4), by quantitative reverse transcription PCR (qRT-PCR) using a custom 96-gene panel (supplemental Table 1). A diffusion map showed a lymphoid differentiation trajectory from HSCs/MPPs to B cells and a myeloid trajectory from HSCs/MPPs to myeloid/erythroid progenitors (Figure 4C; supplemental Figure 5A-B).
To further define the hierarchical relationship between fetal lymphoid progenitors, we index-sorted single HSC, MPP, and lymphoid progenitors and B cells from fetal BM using the same gating strategy used for functional assays (supplemental Figure 1) and performed single-cell qRT-PCR using a customized lymphoid gene panel (supplemental Table 2). A diffusion map confirmed a lymphoid differentiation trajectory from HSCs to B cells with PreProB-progenitors lying upstream of ProB-progenitors and downstream of ELPs (Figure 4D; supplemental Figure 6A-B) supporting our functional data. Early B-lineage gene expression (CD79A, VPREB1, EBF1, IL7RA, and IGHM) is first detected in LMPPs and increases progressively in ELPs and PreProB-progenitors, consistent with earlier reports,28 whereas expression of B cell–specific genes (DNTT, PAX5, CD19, and MS4A1/CD20) is not detected until ELP (Figure 4E; supplemental Figures 5B and 6B). Most B-cell genes (VPREB1, MME/CD10, RAG1, RAG2, CD72, CD9, LEF1, and TCF3) are expressed at higher levels in ProB-progenitors compared with PreProB-progenitors, consistent with a PreProB-progenitor to ProB-progenitor hierarchy, suggesting their importance in B-progenitor maturation.
Next, to identify global transcriptomic differences between PreProB-progenitors and ProB-progenitors and their upstream progenitors, we performed RNA-sequencing of flow-sorted fetal BM HSPCs (100 cells per population). Principal component analysis (PCA) based on the top 500 variably expressed genes clearly separates PreProB-progenitors from ProB-progenitors (Figure 5A). PCA also showed that PreProB-progenitors cluster adjacent to ELPs although differential expression analysis shows higher expression of myeloid (CD15) and T-cell (CD7, CD3E, CD44) genes in ELPs (Figure 5B-C; supplemental Table 5), reflecting the differences in their functional output. Differential expression analysis found 808 variably expressed genes (false discovery rate <0.1) (supplemental Table 6) between PreProB-progenitors and ProB-progenitors, consistent with the distinct identity of these 2 B-progenitor types at a transcriptional level. B-cell genes were upregulated from PreProB-progenitors to ProB-progenitors, supporting the single-cell qRT-PCR data (Figure 5D; supplemental Figure 7A). DNTT and RAG1 genes were expressed at the highest level in B-progenitors before being downregulated in B cells (supplemental Figure 7C). Interestingly, PreProB-progenitors continued to express stem cell–associated (HOXA5, KIT, LIN28B, and RUNX2), myeloid-associated (MPO and CSF1R), and T cell–associated (CD244, CD7, and CD3D) genes (supplemental Figure 7B) despite their lack of myeloid/T-cell output in vitro or in vivo. Similar to adult murine common lymphoid progenitors29 and human cord blood B-progenitors,30 this outcome most likely reflects the concurrent expression of a strong B-lineage differentiation program together with a markedly lower level (8- to 20-fold) expression of myeloid genes in fetal PreProB-progenitors compared with multilineage (LMPP/MPP) and myeloid (granulocyte-monocyte) progenitors (supplemental Figure 7C-D), which, by contrast, readily give rise to myeloid cells in vitro.
![Fetal BM PreProB-progenitors are molecularly distinct from ELPs and ProB-progenitors. (A) Bulk RNA-sequencing of 100 cells from each population (n = 3): PCA of each HSPC population using the top 500 most variably expressed genes. (B) Heat map summarizing differentially expressed genes (false discovery rate [FDR] <0.1) between fetal BM ELPs and PreProB-progenitors (292 differentially expressed genes) and PreProB-progenitors and ProB-progenitors (808 differentially expressed genes). Genes are detailed in supplemental Tables 5 and 6. (C) Log2-fold change of selected lymphoid and myeloid genes that are significantly differentially expressed between fetal BM ELPs and PreProB-progenitors. (D) Log2-fold change of selected lymphoid, myeloid, and stem cell genes that are significantly differentially expressed between fetal BM PreProB-progenitors and ProB-progenitors. (E) Differential chromatin accessibility analysis of ATAC-sequencing from PreProB-progenitors and ProB-progenitors summarized by using PCA and heat map. Details of differentially accessible genes are given in supplemental Table 7. (F) Using ATAC-sequencing, chromatin was more accessible around the promoter regions of genes differentially expressed between PreProB-progenitors and ProB-progenitors (P = .027; n = 2).](https://ash.silverchair-cdn.com/ash/content_public/journal/blood/134/13/10.1182_blood.2019001289/3/m_bloodbld2019001289f5.png?Expires=1769499900&Signature=Ja3PlOcDbS2ZXHi-796FJMFnZ-IelFXLntODETpruckl~QuV84qw4h8yjmVmCARczKQ1gEsIYZtwR3nmzSe8j8CzIcIia0wRd3GR4~mXsJ-NpTBZB-BXyKD3mZYJiv6rJTOYUqdssZeefaO2P-R49h7yt7YdPkbFpFit3~fc~fn6ncDkDCizPxUMYhPoehZaMjGegyfobQ3czzJi1tAeJ3KMn6nTf~uuCncndmNqw0O1cAeryyDTRXVIHAfxwvhmNUvrqLeWAkjNkcnRO0p7dl5O5M48XwGqPLuA0rLqnPVEx5RUx9wbN3OeOTJb9IgMa9R9VxvzY0qU~Tb2AOrTJA__&Key-Pair-Id=APKAIE5G5CRDK6RD3PGA)
Fetal BM PreProB-progenitors are molecularly distinct from ELPs and ProB-progenitors. (A) Bulk RNA-sequencing of 100 cells from each population (n = 3): PCA of each HSPC population using the top 500 most variably expressed genes. (B) Heat map summarizing differentially expressed genes (false discovery rate [FDR] <0.1) between fetal BM ELPs and PreProB-progenitors (292 differentially expressed genes) and PreProB-progenitors and ProB-progenitors (808 differentially expressed genes). Genes are detailed in supplemental Tables 5 and 6. (C) Log2-fold change of selected lymphoid and myeloid genes that are significantly differentially expressed between fetal BM ELPs and PreProB-progenitors. (D) Log2-fold change of selected lymphoid, myeloid, and stem cell genes that are significantly differentially expressed between fetal BM PreProB-progenitors and ProB-progenitors. (E) Differential chromatin accessibility analysis of ATAC-sequencing from PreProB-progenitors and ProB-progenitors summarized by using PCA and heat map. Details of differentially accessible genes are given in supplemental Table 7. (F) Using ATAC-sequencing, chromatin was more accessible around the promoter regions of genes differentially expressed between PreProB-progenitors and ProB-progenitors (P = .027; n = 2).
Fetal BM PreProB-progenitors are molecularly distinct from ELPs and ProB-progenitors. (A) Bulk RNA-sequencing of 100 cells from each population (n = 3): PCA of each HSPC population using the top 500 most variably expressed genes. (B) Heat map summarizing differentially expressed genes (false discovery rate [FDR] <0.1) between fetal BM ELPs and PreProB-progenitors (292 differentially expressed genes) and PreProB-progenitors and ProB-progenitors (808 differentially expressed genes). Genes are detailed in supplemental Tables 5 and 6. (C) Log2-fold change of selected lymphoid and myeloid genes that are significantly differentially expressed between fetal BM ELPs and PreProB-progenitors. (D) Log2-fold change of selected lymphoid, myeloid, and stem cell genes that are significantly differentially expressed between fetal BM PreProB-progenitors and ProB-progenitors. (E) Differential chromatin accessibility analysis of ATAC-sequencing from PreProB-progenitors and ProB-progenitors summarized by using PCA and heat map. Details of differentially accessible genes are given in supplemental Table 7. (F) Using ATAC-sequencing, chromatin was more accessible around the promoter regions of genes differentially expressed between PreProB-progenitors and ProB-progenitors (P = .027; n = 2).
Together, these data confirm the single-cell qRT-PCR data placing PreProB-progenitors upstream of ProB-progenitors and downstream of ELPs.
PreProB-progenitors and ProB-progenitors exhibit subtle differences in chromatin accessibility
To investigate whether the transcriptomic differences between PreProB-progenitors and ProB-progenitors are linked to differences in chromatin accessibility, we next performed ATAC-sequencing25 on flow-sorted fetal BM PreProB-progenitors and ProB-progenitors (2000 cells each from 3 biological samples). PreProB-progenitors and ProB-progenitors both show an open chromatin accessibility pattern either upstream of, or overlapping with, gene bodies of key B-cell development genes, including PAX5, CD79A, RAG1, MME/CD10, DNTT, TCL1A, and IGH (supplemental Figure 8). Interestingly, stem cell and myeloid genes expressed in PreProB-progenitors (LIN28B, CSF1R, and MPO) (supplemental Figure 7B) exhibit qualitatively higher chromatin accessibility in PreProB-progenitors compared with ProB-progenitors. Genome-wide threshold-based differential chromatin accessibility analysis revealed differences in chromatin accessibility between PreProB-progenitors and ProB-progenitors (false discovery rate <0.05) (Figure 5E). We detected 351 differentially accessible regions in close vicinity of 341 genes (supplemental Table 7). A threshold-free comparative approach comparing chromatin accessibility at promoter regions (supplemental Table 8) of the 808 differentially expressed genes identified by RNA-sequencing showed higher chromatin accessibility associated with genes that are upregulated during PreProB to ProB transition (P = .02) (Figure 5F). Taken together, these data show that chromatin accessibility in fetal BM progenitors reflects the transcriptomic profile of these cells and is cell context dependent, demonstrating subtle differences even between closely related B-progenitor populations.
PreProB-progenitors in adult BM are functionally similar to their counterparts in fetal BM but exhibit ontogeny-related transcriptomic differences
To address the specific relationship of PreProB-progenitors to fetal B-cell development, we next investigated the frequency and characteristics of these progenitors in adult BM (n = 6). PreProB-progenitors, as well as ELPs, were rare in adult BM (0.53% ± 0.24% and 0.25% ± 0.11% of Lin2−CD34+ cells, respectively) (Figure 2A; supplemental Figure 9A). We then examined if flow-sorted (supplemental Figure 9B) adult BM PreProB-progenitors were functionally and molecularly similar to or distinct from their fetal BM counterparts. As with fetal BM PreProB-progenitors, adult BM PreProB-progenitors (and ProB-progenitors) differentiate to B cells in vitro, with no myeloid or NK output (supplemental Figure 9C), although adult BM PreProB-progenitors generated lower numbers of B cells than fetal progenitors (supplemental Figure 9D). Finally, we performed single-cell qRT-PCR on flow-sorted adult BM HSPCs (1150 cells from 2 biological samples) to directly compare the B-cell developmental hierarchy between adult and fetal BM and identify any transcriptional differences. Although diffusion maps suggest that adult BM PreProB-progenitors may be more closely related to ProB-progenitors (supplemental Figure 10) than in fetal BM (Figure 4D), adult and fetal PreProB-progenitors expressed very similar levels of most B-lineage genes (CD79A, MME, MS4A1, and PAX5). However, interestingly, compared with adult PreProB-progenitors, fetal PreProB-progenitors expressed higher levels of genes involved in DNA recombination (DNTT and RAG1), with some myeloid (MPO) and HSC/leukemia genes (TCF3, LEF1, MEF2C, IL7RA) supporting previous research showing differences in gene expression between fetal and adult BM cells.28 As well as known fetal genes (LIN28B), fetal PreProB-progenitors uniquely express several genes implicated in infant ALL (iALL) that are either not expressed at all (KLRK1 and PPP1R14A) or are expressed at relatively lower levels in adult counterparts (BAZ2B and BCAT1).31,,-34
Discussion
Because knowledge regarding fetal B-cell development largely derives from studies in mice,35,36 our goal was to identify the molecular and functional characteristics of human B-progenitor development in fetal BM. Here we show, using paired samples, that although B-lymphopoiesis occurs concurrently in liver and BM, it is in fetal BM that B-progenitors undergo a rapid and dramatic expansion during the early second trimester so that they form almost one-half of total BM HSPCs by 20 pcw. The high frequency of B-progenitors in fetal BM so early in life, and the rate at which their frequency increases, have not previously been recognized. We also show for the first time that the earliest B-lymphoid–restricted fetal progenitors are CD10-ve PreProB-progenitors that lie upstream of a second committed CD10+ve ProB-progenitor, from which they are transcriptionally distinct.
Importantly, CD10-ve PreProB-progenitors are not reported in adult BM, suggesting they might play a specifically important role in fetal development. This finding led us to compare adult and fetal BM samples using the same flow cytometric panel, which revealed the presence of a very small population of PreProB-progenitors (median 0.47% of Lin2−CD34+ cells). As with their fetal counterparts, adult BM PreProB-progenitors give rise only to B-lineage cells in vitro and express the expected B-lineage gene expression program. However, fetal PreProB-progenitors display a distinct, ontogeny-related gene expression pattern that is not seen in adult PreProB-progenitors. Fetal PreProB-progenitors uniquely express known fetal genes, such as LIN28B, and several genes implicated in iALL that have not previously been recognized as human fetal-specific hematopoietic genes, such as KLRK1 and PPP1R14A.
This outcome raises the possibility that the identification of a CD10-ve B-progenitor in human fetal liver and fetal BM brings us one step closer to unraveling the origins of B-progenitor leukemia in children, especially iALL. Although the target cell that undergoes transformation in iALL remains unclear,37,,,-41 recent work suggests that for MLL-AF4+ iALL, it is likely to be a progenitor already committed to the B-lineage42 or an LMPP.41 Fetal PreProB-progenitors display a number of characteristics that could provide a permissive molecular context for leukemic transformation by MLL rearrangements. They are highly proliferative fetal-specific progenitors that have similar VDJ rearrangement status and immunophenotypic characteristics to iALL blasts,43 and display a similar transcriptome by RNA-sequencing (supplemental Figure 11A). They demonstrate accessible chromatin at the IgH gene locus and expression of DNTT and RAG1 genes, both of which might be important for fetal-specific pre–B-cell receptor development and leukemia initiation.7,44,45 Furthermore, fetal PrePro-B progenitors, as with iALL blasts, continue to express myeloid and stem cell gene programs (Figure 5D; supplemental Figure 7B), as well as MLL rearranged iALL- associated genes (supplemental Figure 11B). This scenario is particularly pertinent given that iALL may undergo a lineage switch at relapse.46,-48 Our results raise the possibility of this occurring in a committed B-progenitor rather than an upstream multipotent progenitor, although further study will be required to support this theory.
Recent work identified another developmentally restricted progenitor with B-lineage output in early fetal liver in humans.8,9 This IL7R+ progenitor (defined as Lin−CD34+CD127+CD19–) has been suggested as a target cell for transformation by the leukemic fusion gene ETV6-RUNX1, one of the most common causes of childhood CD10+ B-cell ALL. This has many similarities with the ELP we observed in fetal BM, both at the functional level (B cell and NK cell, as well as some myeloid output) and at the transcriptomic level. However, we also noted T-cell potential from fetal BM ELPs and found that these cells lie upstream of PreProB-progenitors, consistent with their less restricted output. It is also possible that the ELP population is heterogeneous and contains within it a small subset of B-lineage–restricted cells; however, this theory could only be addressed by single-cell in vitro assays that are technically extremely difficult given the rarity of this population. Interestingly, according to PCA, fetal BM ELPs, similar to PreProB-progenitors, cluster closely with iALL blasts (supplemental Figure 11A) and might also serve as a permissive cell for MLL rearrangement/transformation.
In conclusion, we describe the molecular and functional characteristics of B-progenitor development in human fetal BM for the first time. This analysis reveals 2 types of B-lymphoid–restricted progenitors, “fetal-type” CD10-ve PreProB-progenitors, which lie upstream of CD10+ve ProB-progenitors from which they are molecularly distinct. PreProB-progenitors are very rare in adult BM and differ from their fetal counterparts functionally and molecularly. Fetal PreProB-progenitors have a unique fetal-specific gene expression program that is absent in postnatal life and providing potential clues to the in uteroorigins of infant/childhood leukemia. This finding, along with their immunophenotypic and transcriptomic similarities with CD10-ve iALL blasts and rapid expansion in fetal BM within a narrow developmental time window, may indicate a permissive cell-intrinsic context and microenvironment for leukemia initiation. Further studies are needed, however, to investigate this theory directly.
The fetal BM RNA-Sequencing and ATAC-sequencing files have been deposited in the National Center for Biotechnology Information’s Gene Expression Omnibus (https://www.ncbi.nlm.nih.gov/geo/) with accession numbers GSE122982 and GSE122989, respectively.
For all other original data, please contact anindita.roy@paediatrics.ox.ac.uk.
The online version of this article contains a data supplement.
The publication costs of this article were defrayed in part by page charge payment. Therefore, and solely to indicate this fact, this article is hereby marked “advertisement” in accordance with 18 USC section 1734.
Acknowledgments
The authors thank the Gold September Charity for funding the ATAC-sequencing and the John Fell Fund for funding equipment. They acknowledge the WIMM Flow Cytometry Facility, which is supported by the Medical Research Council (MRC) Human Immunology Unit, MRC Molecular Haematology Unit (MC_UU_12009), NIHR Oxford BRC, Kay Kendall Leukemia Fund (KKL1057), the John Fell Fund (131/030 and 101/517), the EPA fund (CF182 and CF170), and by the WIMM Strategic Alliance awards G0902418 and MC_UU_12025. The authors acknowledge the contributions of Neil Ashley at the MRC Weatherall Institute of Molecular Medicine (WIMM) Single Cell Facility and MRC-funded Oxford Consortium for Single-Cell Biology (MR/M00919X/1). The authors thank the High-Throughput Genomics Group at the Wellcome Trust Centre for Human Genetics (funded by Wellcome Trust Grant Reference 090532/Z/09/Z), the MRC WIMM Centre for Computational Biology, Radcliffe Department of Medicine, University of Oxford, and the BMS, University of Oxford, for their technical assistance. The human fetal material was provided by the Joint MRC/Wellcome Trust Grant 099175/Z/12/Z Human Developmental Biology Resource (http://hdbr.org). The authors also thank Supat Thongjuea and Rajiv Mundayat for helpful advice on bioinformatic and statistical analyses and Jack Bartram for advice on IgH rearrangement analysis.
A.R. is supported by a Bloodwise Clinician Scientist Fellowship (grants 14041 and 17001), Lady Tata Memorial International Fellowship, and EHA-ASH Translational Research Training in Hematology Fellowship. I.R. is supported by the NIHR Oxford BRC and by a Bloodwise Program Grant (13001). T.A.M. is supported by a MRC (UK) Molecular Haematology Unit grant (MC_UU_12009/6) and by the NIHR Oxford BRC. A.J.M. is supported by the NIHR Oxford BRC and MRC Senior Clinical Fellowship (MR/L006340/1). P.V. is supported by the MRC (MHU Award G1000729 and MRC Disease Team Award 4050189188, Single Cell Award MR/M00919X/1) and CRUK (Program Grant C7893/A12796, and Development Funds CRUKDF0176-DK and C5255/A20758). D.J.H.F.K. is supported by a CIHR Postdoctoral Fellowship.
Authorship
Contribution: S.O., N.E., S.R., G.B., N.F., C.G., L.G., G.W., S.I., and A.R. performed the experiments and analyzed the data; N.T.C., D.J.H.F.K., B. Povinelli, A.A.-D., C.B., I.V., and H.K. analyzed the data; B. Psaila, P.H., S.M.W., and P.B. provided samples; A.K., A.J.M., P.A., P.M., and P.V. reviewed and edited the paper; S.O., T.A.M., I.R., and A.R. wrote and edited the paper; and T.A.M., I.R., and A.R. conceptualized the project.
Conflict-of-interest disclosure: T.A.M. is one of the founding shareholders of OxStem Oncology, a subsidiary company of OxStem Ltd. (2016). The remaining authors declare no competing financial interests.
Correspondence: Anindita Roy, University of Oxford Department of Paediatrics, Level 2, Children's Hospital, John Radcliffe, Oxford OX3 9DU, United Kingdom; e-mail: anindita.roy@paediatrics.ox.ac.uk.

This feature is available to Subscribers Only
Sign In or Create an Account Close Modal