

Key Points
A dual signal from c-Kit and VEGFR-2 determines selective activation of HSCs and MPP2 in response to acute immune thrombocytopenia.
VEGF-A and PDGF-BB relocalize stem cell factor in megakaryocytes, triggering proliferation of HSPCs.

Abstract
Although bone marrow niche cells are essential for hematopoietic stem cell (HSC) maintenance, their interaction in response to stress is not well defined. Here, we used a mouse model of acute thrombocytopenia to investigate the cross talk between HSCs and niche cells during restoration of the thrombocyte pool. This process required membrane-localized stem cell factor (m-SCF) in megakaryocytes, which was regulated, in turn, by vascular endothelial growth factor A (VEGF-A) and platelet-derived growth factor-BB (PDGF-BB). HSCs and multipotent progenitors type 2 (MPP2), but not MPP3/4, were subsequently activated by a dual-receptor tyrosine kinase (RTK)–dependent signaling event, m-SCF/c-Kit and VEGF-A/vascular endothelial growth factor receptor 2 (VEGFR-2), contributing to their selective and early proliferation. Our findings describe a dynamic network of signals in response to the acute loss of a single blood cell type and reveal the important role of 3 RTKs and their ligands in orchestrating the selective activation of hematopoietic stem and progenitor cells (HSPCs) in thrombocytopenia.
Introduction
Hematopoietic stem cells (HSCs) are a rare population of cells in the bone marrow (BM) and are responsible for the continuous production of all blood cells.1 Most HSCs are quiescent and divide infrequently under steady-state conditions.2 HSCs reside in a spatial niche in close proximity to endothelial cells (ECs),3,4 perivascular cells,3 mesenchymal stromal cells,5 and megakaryocytes (Mks).6,7 Notably, niche cells provide signals that are necessary for HSC maintenance and regeneration.8,,,,,,,-16 However, the response of HSCs and BM niche cells to the loss of only 1 mature blood cell type, as in autoimmune cytopenia, is not well understood.
Immune thrombocytopenia (ITP) is an autoimmune disorder that is characterized by low platelet count and resultant spontaneous bleeding. Acute ITP occurs predominantly in children and is frequently associated with viral infections; ITP is characterized by the production of cross-reactive antibodies and subsequent elimination of opsonized platelets in the spleen.17 Thus far, Mks are thought to be the main cell type responding to low platelet count,18 whereas the potential requirement and activation of the HSC and multipotent progenitor compartments in the same context remain unexplored. A recent study has suggested that a rare population of platelet-biased HSCs preferentially proliferates in response to acute Mk and platelet depletion.19,20 However, it is not known whether HSCs can directly sense acute thrombocyte loss or require specific activation signals from the BM niche cells, which, in turn, induce HSC proliferation.
Therefore, we have investigated the response of HSCs and their downstream progenitor subsets in a mouse model of ITP. Here, we demonstrate a very early proliferation and differentiation response of HSCs and multipotent progenitors type 2 (MPP2) to acute antibody-induced platelet depletion mediated by platelet-derived growth factor-BB (PDGF-BB)/PDGF-R, vascular endothelial growth factor A (VEGF-A)/vascular endothelial growth factor receptor 2 (VEGFR-2) and membrane-localized stem cell factor (m-SCF)/c-kit signaling. Importantly, inhibiting 1 of these receptor tyrosine kinases (RTKs; PDGF-R, VEGFR-2, c-Kit) was sufficient to prevent activation of HSCs/MPP2 after thrombocytopenia. Expression of VEGF-A drives the production of PDGF-BB, subsequently resulting in localization of stem cell factor (SCF) on the Mk membrane. Therefore, we uncovered a cooperative network of BM niche cells and signaling molecules leading to directed HSC/MPP2 activation after acute platelet depletion.
Methods
Mice
C57BL/6, B6.SJL-PtprcaPep3b/BoyJ, and C57BL/6-Tg(Pf4-icre)Q3Rsko/J (Pf4-cre) mice crossed with the iDTR line6 and Ubc-GFP21 (expressing GFP under the ubiquitin promoter) mice were obtained from The Jackson Laboratory and were bred and maintained under specific pathogen–free conditions in the animal facility of the Medical Theoretical Center at Technische Universität Dresden. Young adult mice (8-10 weeks old) were used for the experiments; all experiments included animals of the same age that were randomly assigned to experimental groups. To induce depletion of Mks, mice were injected with 1.5 μg of diphtheria toxin (DT) intraperitoneally twice on day 1 and once on day 2 and were euthanized on day 3. Experiments were approved by the Landesdirektion Sachsen.
Thrombocytopenia model
Rabbit anti-mouse antiplatelet serum, injected intraperitoneally (cat. no. WAK-AIA31440; Accurate Chemical and Scientific Corporation), was used to selectively deplete platelets.22 The effective dose was tested and adjusted for each batch of antiplatelet serum before use in experiments, and a dose resulting in <150 × 103 platelets per microliter at 2 hours after the injection was considered suitable for experiments. Control mice were injected with the appropriate amount of normal rabbit serum (cat. no. YNNRS; Accurate Chemical and Scientific Corporation and ab7487; Abcam). Anti-CD42b antibodies (cat. no. R300; emfret Analytics) were injected intraperitoneally (100 µg per mouse).19
In vivo administration of inhibitors
CP-673451 PDGFR inhibitor (cat. no. S1536; Selleckchem) was administered intraperitoneally at a dose of 40 mg/kg 1 hour prior to platelet depletion. Anti-VEGFR-2 blocking antibody (cat. no. BE0060; Bio X Cell) was injected IV (1 mg per mouse) 10 minutes before platelet depletion. ACK2 antibody (CD117 monoclonal antibody, clone ACK2; cat. no. 16-1172-85; Thermo Fisher Scientific) or biotin anti-mouse CD117 antibody (clone ACK2; cat. no. 135129; BioLegend), at a dose of 50 µg per mouse, or CD140b (PDGFRb blocking) (clone APB5; cat. no. 136002; BioLegend) was administered IV 30 minutes before platelet depletion.
Hematological parameters
A Sysmex XT-3000 Vet automated hematology analyzer was used to measure blood cell counts.
Flow cytometry
All analyses were done on a BD LSR II, BD FACSAria II, BD LSRFortessa, or a BD FACSCanto II (BD Bioscience) using different antibodies (supplemental Table 1, available on the Blood Web site). Data were analyzed using FlowJo software. For the analysis of phosphorylated form of VEGFR-2 (pVEGFR-2) on BM-derived ECs (BM-ECs), cells were isolated from femurs and tibiae, fixed immediately with Maxpar Fix I Buffer (cat. no. 201065; Fluidigm) for 30 minutes, and stained with anti-pVEGFR-2 (Tyr1054, Tyr1059) antibody (cat. no. 44-1047G; Thermo Fisher Scientific).
HSC and MPP2 transplantation
Cells were isolated from tibiae, femurs, pelvis, and vertebrae by crushing bones in 5% phosphate-buffered saline (PBS)–fetal calf serum (FCS) and passing them through a 70-µm filter. Erythrocytes were lysed using ACK Lysis Buffer (cat. no. A10492-01; Life Technologies). Cells were stained with a Lineage mix cocktail (B220 bio, CD3e bio, NK1.1 bio, Gr1 bio, Ter119 bio, and CD11b bio), and Anti-Biotin MicroBeads (cat. no. 130-090-485; Miltenyi Biotec) were added to enrich for Lin− cells using LS columns (cat. no. 130-042-401; Miltenyi Biotec). Lin− cells were stained with antibodies, and 300 HSCs (Lin− c-Kit+ Sca1+ CD48− CD150+) and 1500 MPP2 (Lin− c-Kit+ Sca1+ CD48+ CD150+) were sorted and transplanted together with 5 × 10⁵ total BM competitor cells. Recipient mice were lethally irradiated (9 Gy), and the cells were injected IV.
Cell cycle analysis
Cells were fixed and permeabilized using the following buffers: Fixation/Permeabilization Concentrate (cat. no. 00-5123-43), Fixation/Permeabilization Diluent (cat. no. 00-5223-56), and Permeabilization Buffer (10X) (cat. no. 00-8333-56; all from eBioscience). To distinguish between the G0 and G1 phase, cells were stained with Ki-67 FITC. 4′,6-Diamidino-2-phenylindole (Molecular Probes) was used to measure DNA content.
Single-cell colony assay
Single cells were sorted directly into 96-well plates in IMDM, GlutaMAX Supplement (cat. no. 31980022; Thermo Fisher Scientific), 20% FCS (cat. no. 18856; Biochrom), 20 ng/mL recombinant murine SCF (cat. no. 250-03; PeproTech), 20 ng/mL recombinant murine thrombopoietin (cat. no. 34-8686-63; Thermo Fisher Scientific), 20 ng/mL recombinant murine interleukin-3 (IL-3; cat. no. 213-13; PeproTech), and 5 U/mL recombinant human erythropoietin (Roche) and cultivated for 14 days at 37°C with 5% CO2. Cells were spun onto slides and stained with May-Grünwald and Giemsa solution (Sigma-Aldrich). The composition of the colonies was analyzed using a light microscope.
ELISA
Plasma for enzyme-linked immunosorbent assay (ELISA) was obtained through retro-orbital bleeding of the mice. To measure cytokine levels in the BM, 2 femurs and 1 tibia were crushed in 500 µL of PBS or 1 femur was crushed in 300 µL of PBS and centrifuged at 300g; the supernatant was used for analysis. For total SCF, 1 femur and 1 tibia were crushed in 300 µL of PBS, and the cell suspension was frozen at −20°C. A list of ELISA kits used is provided in supplemental Data.
Niche cell sorting
Cells were isolated from all tibiae, femurs, and pelvis and crushed in PBS-FSC. The bone pieces were digested for 1 hour at 37°C with 3 mg/mL Collagenase Type I (Stem Cell Technologies) in Dulbecco’s Modified Eagle Medium (cat. no. BE12-604F; Lonza) supplemented with 10% FCS and 500 µg/mL DNase I (cat. no. 26680; Roche). ECs (CD45− Ter119− CD31high Sca1+), mesenchymal stromal cells (CD45− Ter119− CD31− Sca1+ CD51+ PDGFRa+), osteoblasts (CD45− Ter119− CD31− Sca1− CD51+ PDGFRa−), CXCL12-abundant reticular cells (CD45− Ter119− CD31− Sca1− CD51+ PDGFRa+),23 and pericytes (CD45− Ter119− CD31− Sca1+ PDGFRb+)24 were sorted. Mks were sorted from BM according to their size, CD41 expression, and DNA content as defined by Hoechst staining.
Immunofluorescent staining and imaging of frozen sections
Tibia sections were used for the immunofluorescent staining. Bones were fixed overnight at 4°C in 4% paraformaldehyde and incubated in OSTEOSOFT (cat. no. 101728; Merck) at 37°C for 2 or 3 days. Bones were embedded in Cryogel, frozen on dry ice, and stored at −20°C. Sections (10 µm) were prepared using a CryoStar NX50 cryostat (Thermo Fisher Scientific). Anti-SCF antibodies were labeled with a Zenon Alexa Fluor 488 Rabbit IgG Labeling Kit (cat. no. Z25302; Thermo Fisher Scientific). Images were acquired on a Leica TCS SP5 confocal microscope or with a ZEISS Apotome.2 Colibri system (Zeiss). All images were taken using a 40× objective and were analyzed using Fiji.25
Whole-mount sternum BM imaging
Whole-mount tissue preparation and HSC and Mk staining were performed as described previously.20 Briefly, sternum bones were carefully harvested, cleaned, and transected with a surgical blade into individual pieces. Each piece was bisected sagittally to expose the marrow cavity. Fragments were fixed with 4% paraformaldehyde, blocked/permeabilized in PBS with 20% normal goat serum and 0.5% Triton X-100, and stained with primary antibodies (biotin anti-Lineage panel cocktail [cat. no. 559971; BD Biosciences]; biotin anti-CD48 [cat. no. 13-0481-85; Thermo Fisher Scientific], and CD150 PE [cat. no. 115904; BioLegend]) for 3 days. The tissues were incubated with streptavidin eFluor 450 for 2 hours. Images were acquired using an upright Leica SP8 multiphoton laser scanning microscope and analyzed using Imaris 9.3.0 (Bitplane AG) (supplemental Data).
Next-generation sequencing
A total of 1000 cells was sorted (pooled cells from 3 mice per sample) directly into lysis buffer from an RNeasy Plus Micro Kit (cat. no. 74034; QIAGEN), and RNA was isolated according to the manufacturer’s instructions. SmartSeq2 sequencing method was performed (SmartSeq2 and data analysis in supplemental Data).
RNA isolation and quantitative real-time PCR
BM niche cells were sorted in water. A PrimeScript RT Reagent Kit (cat. no. RR037A; TaKaRa) was used to isolate and transcribe RNA according to the manufacturer’s instructions. SYBR Premix Ex Taq II (Tli RNase H Plus) was used for quantitative real-time polymerase chain reaction (PCR) on a CFX384 Touch Real-Time PCR Detection System (Bio-Rad).26 Primer sequences are shown in supplemental Table 2. All messenger RNA (mRNA) expression levels were calculated relative to β2M or mTBP genes using the Δ-Δ Ct method.27 All Ct values > 30 were excluded from the analysis.
Flow mass spectrometry
BM cells from 2 femurs and 2 tibiae were obtained by crushing in PBS and fixing immediately in Maxpar Fix I Buffer (cat. no. 201065; Fluidigm) for 30 minutes at room temperature. Cells were incubated with metal-tagged antibodies (supplemental Table 3). Next, cells were fixed in methanol for 15 minutes on ice and stained with antibodies against phosphorylated proteins. Cells were incubated overnight in MaxPar Fix and Perm Buffer with Cell-ID Intercalator-Ir (cat. no. 201192A; both from Fluidigm). Samples were acquired on a CyTOF2 mass cytometer.
Data analysis and statistics
Data are presented as mean ± standard error of the mean. Significance was calculated using the Mann-Whitney U test, unless stated otherwise. All statistical analyses were performed using GraphPad Prism 7.02 for Windows (GraphPad Software, La Jolla, CA; www.graphpad.com).
Results
Acute platelet depletion specifically activates HSCs and MPP2
To understand the early impact of thrombocytopenia on the hematopoietic stem and progenitor cell (HSPC) compartment, we injected mice with antiplatelet serum, which resulted in a dramatic loss of platelets in the circulation for ≥72 hours, beginning at 30 minutes after a single injection (Figure 1A). No significant changes in circulatory erythrocyte or white blood cell numbers were detected (supplemental Figure 1A). Because platelets derive from Mks and both share certain surface markers, we specifically enumerated Mks in BM sections at 2 and 24 hours after platelet depletion but found no reduction compared with steady-state conditions (Figure 1B; supplemental Figure 1B). Next, to assess whether platelet depletion influences HSC (CD48−/CD150+ Lineage− Sca-1+ c-Kit+ [LSK]) and MPP populations (MPP2 [CD48+/CD150+ LSK cells] and MPP3/4 [CD48+/CD150− LSK cells]),28 we used CD41 expression to discriminate between myeloid-biased and balanced HSCs29,30 (supplemental Figure 1C). CD41− HSCs and CD41− MPP2 started to proliferate early, at 12 hours after platelet depletion (Figure 1C), followed by an increase in the proliferation of CD41+ HSCs and MPP2 at 24 hours (Figure 1D). Importantly, we observed a significant decrease in the absolute numbers of CD41+ HSCs and pre-Mk progenitors (PreMegs),21,31 whereas CD41− MPP2 numbers increased markedly (Figure 1E). Within 24 hours after acute thrombocytopenia, MPP3/428 did not exhibit enhanced proliferation or a change in cell numbers (supplemental Figure 1D-E), and there was no alteration in erythro-myeloid progenitor numbers (supplemental Figure 1F). At 48 hours after platelet depletion, although the CD41+ HSC numbers decreased, CD41− HSC and CD41− MPP2 numbers increased significantly (Figure 1F). HSCs and MPPs had returned to their steady-state proliferation status by 48 hours (supplemental Figure 1H). Comparable results were obtained using a platelet-depleting antibody that targets CD42b (supplemental Figure 2). Together, our data demonstrate that CD41+ HSCs start dividing later than CD41− HSCs but quickly disappear after acute platelet depletion. We found no evidence for increased apoptosis (supplemental Figure 1G), implying that CD41+ Mk-primed HSCs likely differentiate preferentially in response to acute thrombocytopenia. To verify this, we performed ex vivo single-cell colony assays, as described previously,21 and found that CD41+ HSCs, isolated from mice at 24 hours after platelet depletion, gave rise to fewer Mk colonies compared with CD41+ HSCs from control mice, reiterating the presence of an initially lower number of Mk-primed CD41+ cells (Figure 1G). Taken together, these results clearly reveal that directed loss of only 1 mature blood cell type (thrombocytes) induces proliferation specifically of HSCs and early myeloid-primed multipotent progenitors (MPP2) and leads to differentiation of CD41+ HSCs.
![Platelet depletion leads to the activation of HSCs and MPP2. (A) Platelet numbers in peripheral blood after a single injection of antiplatelet serum (control [Ctrl.], n = 4-12; depletion [Depl.], n = 3-12). The P values were calculated using 2-tailed unpaired Student t tests. (B) Mk numbers per field at 2 hours and 24 hours after platelet depletion (data points are Mk numbers per area from Ctrl. [n = 4] and Depl. [n = 7] mice). Cell cycle analysis of HSCs (LSK CD48− CD150+) and MPP2 (LSK CD48+ CD150+) at 12 hours (Ctrl., n = 14; Depl., n = 17) (C) and at 24 hours (Ctrl., n = 8; Depl., n = 7) (D) after platelet depletion. Number of cells at 24 hours (Ctrl., n = 7; Depl., n = 5) (E) and at 48 hours (Ctrl., n = 7-8; Depl., n = 5-7) (F) after platelet depletion in 2 femur and 2 tibia. (G) Single CD41− and CD41+ HSCs were sorted at 24 hours after platelet depletion and cultivated in liquid culture media supplemented with murine SCF, murine TPO, murine IL-3, and human Epo. Cell composition was analyzed after 14 days using May-Grünwald–Giemsa staining (number of analyzed colonies: CD41− HSCs: 34 Ctrl. and 65 Depl.; CD41+ HSCs: 46 Ctrl. and 72 Depl.).](https://ash.silverchair-cdn.com/ash/content_public/journal/blood/134/13/10.1182_blood.2019000721/3/m_bloodbld2019000721f1.png?Expires=1764099172&Signature=mWe5HZvXgBSUxhiO4UF7qxuRGkeNxHVH3LSOThJeDzWAa0R7pXuNQX6wPaBVfHD8rVg49NDkEZnNnQUEN4FX8A7dKlWofkuWhiewjUF8~bo~br~7DGveb3GXMJKmFUocRdlimx~VtQpf8PdCDd54qXvPiW4EiVEAhBJG~NRHiHfj3UysGjMfwtqYcKN8he8fHRHpCN2JAvU8Y-0u-gHnm0eqZ5qF~ctV2P7T6ll4-PRPjWZ152pTcE2KbifHB4mnfx-faG8g5SXsgBkqzAFrIQp8g~JYitqF7lXti1-cjB0XwV2mFht8NPK~Y5lQ-sWuDQCSFeRMp2CdYkhOl33UdA__&Key-Pair-Id=APKAIE5G5CRDK6RD3PGA)
Platelet depletion leads to the activation of HSCs and MPP2. (A) Platelet numbers in peripheral blood after a single injection of antiplatelet serum (control [Ctrl.], n = 4-12; depletion [Depl.], n = 3-12). The P values were calculated using 2-tailed unpaired Student t tests. (B) Mk numbers per field at 2 hours and 24 hours after platelet depletion (data points are Mk numbers per area from Ctrl. [n = 4] and Depl. [n = 7] mice). Cell cycle analysis of HSCs (LSK CD48− CD150+) and MPP2 (LSK CD48+ CD150+) at 12 hours (Ctrl., n = 14; Depl., n = 17) (C) and at 24 hours (Ctrl., n = 8; Depl., n = 7) (D) after platelet depletion. Number of cells at 24 hours (Ctrl., n = 7; Depl., n = 5) (E) and at 48 hours (Ctrl., n = 7-8; Depl., n = 5-7) (F) after platelet depletion in 2 femur and 2 tibia. (G) Single CD41− and CD41+ HSCs were sorted at 24 hours after platelet depletion and cultivated in liquid culture media supplemented with murine SCF, murine TPO, murine IL-3, and human Epo. Cell composition was analyzed after 14 days using May-Grünwald–Giemsa staining (number of analyzed colonies: CD41− HSCs: 34 Ctrl. and 65 Depl.; CD41+ HSCs: 46 Ctrl. and 72 Depl.).
Platelet depletion leads to the activation of HSCs and MPP2. (A) Platelet numbers in peripheral blood after a single injection of antiplatelet serum (control [Ctrl.], n = 4-12; depletion [Depl.], n = 3-12). The P values were calculated using 2-tailed unpaired Student t tests. (B) Mk numbers per field at 2 hours and 24 hours after platelet depletion (data points are Mk numbers per area from Ctrl. [n = 4] and Depl. [n = 7] mice). Cell cycle analysis of HSCs (LSK CD48− CD150+) and MPP2 (LSK CD48+ CD150+) at 12 hours (Ctrl., n = 14; Depl., n = 17) (C) and at 24 hours (Ctrl., n = 8; Depl., n = 7) (D) after platelet depletion. Number of cells at 24 hours (Ctrl., n = 7; Depl., n = 5) (E) and at 48 hours (Ctrl., n = 7-8; Depl., n = 5-7) (F) after platelet depletion in 2 femur and 2 tibia. (G) Single CD41− and CD41+ HSCs were sorted at 24 hours after platelet depletion and cultivated in liquid culture media supplemented with murine SCF, murine TPO, murine IL-3, and human Epo. Cell composition was analyzed after 14 days using May-Grünwald–Giemsa staining (number of analyzed colonies: CD41− HSCs: 34 Ctrl. and 65 Depl.; CD41+ HSCs: 46 Ctrl. and 72 Depl.).
Gene expression and signaling pathway analysis of stem and progenitor cells
To unravel the differential response of CD41− and CD41+ HSCs in response to acute thrombocytopenia, we performed a global transcriptome analysis, which uncovered a strong difference between HSCs at steady-state and 24 hours after platelet depletion. Specifically, at steady-state we found 657 differentially expressed genes (DEGs) between CD41− and CD41+ HSCs, 971 DEGs between CD41− control and CD41− HSCs after platelet depletion, only 58 DEGs for CD41+ control vs CD41+ HSCs after depletion, and 186 DEGs between CD41+ and CD41− HSCs after depletion (supplemental Table 4). Gene ontology analyses of genes32 that were upregulated in CD41− and CD41+ HSCs after platelet depletion showed significant enrichment of cell cycle–related genes (supplemental Figure 3). At steady-state, a comparison of CD41+ cells and CD41− cells revealed significant enrichment of cell cycle–related genes, which is in line with previous research,33 as well as genes for blood coagulation (supplemental Figure 3A). Using published gene sets specific for Mk differentiation,15,19,21 gene set enrichment analysis (GSEA) of upregulated genes in CD41+ HSCs in comparison with CD41− HSCs also revealed a significant positive correlation in control and thrombocytopenic mice (Figure 2A-B; supplemental Figure 3). These data suggest that the Mk priming of CD41+ HSCs already occurs in steady-state. A comparison of upregulated genes in CD41− HSCs and control CD41− HSCs after platelet depletion did not show enrichment of genes responsible for Mk differentiation. After platelet depletion, CD41+ HSCs compared with control CD41+ HSCs displayed a negative correlation in GSEA with Mk-specific genes (Figure 2A-B), supporting the results of the colony assay, demonstrating that the frequency of Mk-primed CD41+ HSCs was reduced 24 hours after platelet depletion (Figure 1G).
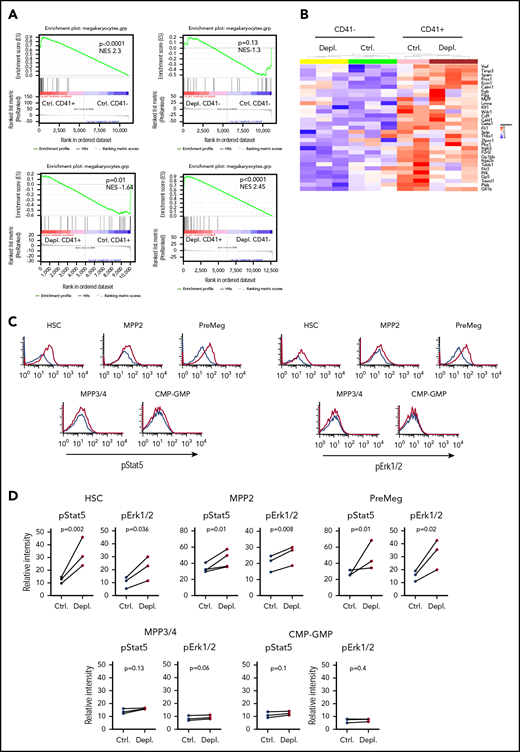
Gene expression and signaling pathways analysis in HSPCs after platelet depletion. (A) GSEA of upregulated genes in CD41+ and CD41− HSCs, with or without platelet depletion. (B) Heat map depicting Mk-specific genes in CD41+ and CD41− HSCs, with or without platelet depletion. (C) Representative graphs showing pStat5 and pErk1/2 levels in HSCs, MPP2, PreMegs, MPP3/4, and common myeloid progenitor–granulocyte macrophage progenitor (CMP-GMP) cells at 2 hours after platelet depletion (data combined from 4 independent experiments, n = 8). Ctrl. in black, Depl. in red. (D) Quantification of pErk1/2 and pStat5 levels in HSCs, MPP2, MPP3/4, PreMegs, and CMP-GMP cells at 2 hours after platelet depletion (data combined from 3 independent experiments, per data point Ctrl. n = 2; Depl. n = 2, connecting lines show samples from the same experiment). Data are represented as mean for each experiment. The P values were calculated by 2-tailed paired Student t tests.
Gene expression and signaling pathways analysis in HSPCs after platelet depletion. (A) GSEA of upregulated genes in CD41+ and CD41− HSCs, with or without platelet depletion. (B) Heat map depicting Mk-specific genes in CD41+ and CD41− HSCs, with or without platelet depletion. (C) Representative graphs showing pStat5 and pErk1/2 levels in HSCs, MPP2, PreMegs, MPP3/4, and common myeloid progenitor–granulocyte macrophage progenitor (CMP-GMP) cells at 2 hours after platelet depletion (data combined from 4 independent experiments, n = 8). Ctrl. in black, Depl. in red. (D) Quantification of pErk1/2 and pStat5 levels in HSCs, MPP2, MPP3/4, PreMegs, and CMP-GMP cells at 2 hours after platelet depletion (data combined from 3 independent experiments, per data point Ctrl. n = 2; Depl. n = 2, connecting lines show samples from the same experiment). Data are represented as mean for each experiment. The P values were calculated by 2-tailed paired Student t tests.
To further define the specific activation of HSCs/MPP2 in response to acute thrombocytopenia, we explored the activation status of multiple intracellular signal transduction pathways using flow mass spectrometry by time of flight. Remarkably, at 2 hours after platelet depletion, we found a significant increase in phosphorylated Stat5 (pStat5) and phosphorylated Erk1/2 (pErk1/2), but not in Akt, p65 (NF-κB signaling), Smad2/3, or Smad1/5, in HSCs, MPP2, and PreMegs (Figure 2C-D; supplemental Figure 4). Furthermore, MPP3/4 and restricted myeloid progenitors did not show phosphorylation of Stat5 or Erk1/2 (Figure 2C-D); these results point to a direct link between intracellular signaling activation and the observed selective stimulation of a fraction of hematopoietic progenitors.
SCF on Mks activates proliferation of HSCs/MPP2 in response to acute thrombocytopenia
To identify the potential growth factors that activate HSC/MPP2 during acute thrombocytopenia, we first tested the concentration of well-known regulators of HSC activation6,7,13,14,34,-36 : thrombopoietin, IL-6, fibroblast growth factor 1 and 2, CXCL4 and CXCL12, tumor necrosis factor, IL-1α, and transforming growth factor β. However, we did not find any altered concentrations in BM supernatants from control or platelet-depleted mice (supplemental Figure 5). SCF is a well-known growth factor that promotes the maintenance of HSC quiescence but also activates HSC proliferation in response to BM failure,8,36 and SCF/c-Kit interaction triggers Stat5 and Erk1/2 phosphorylation.37 Therefore, we investigated soluble and total SCF (supernatant-containing BM cells) 2 hours after platelet depletion. As shown in (Figure 3A), the level of total SCF increased significantly in response to acute thrombocytopenia, whereas soluble SCF did not change (Figure 3A). We further characterized the source of SCF using immunohistochemistry on BM cryosections and found that Mks contain SCF (supplemental Figure 6A). Under steady-state conditions, SCF is preferentially present in the cytoplasm of Mks, but it is moved to the membrane 2 hours following platelet depletion. We confirmed this by surface staining of Mks using an anti-SCF antibody (Figure 3B; supplemental Figure 6B). Interestingly, we found that this redistribution was not accompanied by an increase in SCF mRNA, suggesting a posttranscriptional mechanism underlying the enhanced membrane localization of SCF in Mks (supplemental Figure 6C).
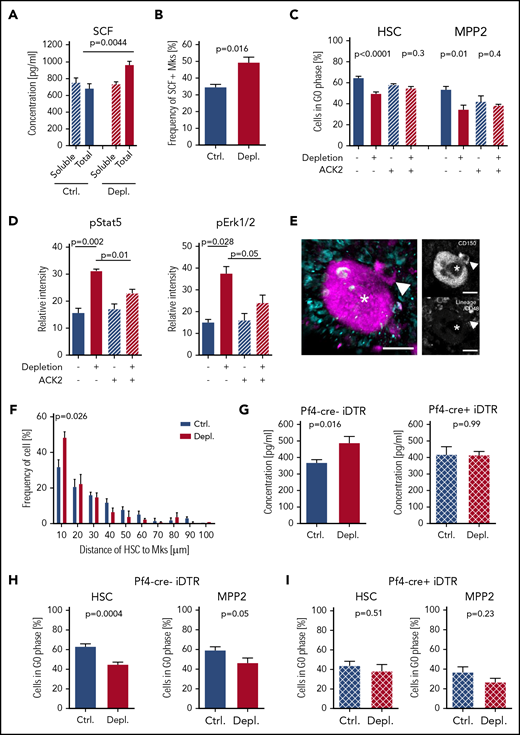
SCF activates hematopoietic cells during acute thrombocytopenia. (A) Quantification of soluble and total SCF in the BM 2 hours after platelet depletion (soluble: Ctrl., n = 10; Depl., n = 12; total: Ctrl., n = 10; Depl., n = 10). (B) Frequency of Mks expressing SCF at the membrane 2 hours after platelet depletion analyzed by flow cytometry (Ctrl., n = 5; Depl., n = 5). (C) Cell cycle analysis of CD41− HSCs and CD41− MPP2 in the absence or presence of c-Kit receptor blocking (ACK2) antibody and/or following platelet depletion (Ctrl., n = 9; Depl., n = 10; Ctrl.+ACK2, n = 4; Depl.+ACK2, n = 5). (D) Phosphorylation of Stat5 and Erk1/2 in control and thrombocytopenic mice, with or without c-Kit receptor blocking 2 hours after platelet depletion (data combined from 2 independent experiments, n = 4). (E) Representative photomicrographs displaying colocalization of CD150+/CD48− Lin− HSCs (arrowheads) and Mk (asterisks) 24 hours after platelet depletion. Scale bars represent 15 μm. (F) Frequency of HSCs/Mks relative to the distance between both cell types (2 independent experiments, ≥100 cells per mouse; Ctrl., n = 4; Depl. n = 3). P values were calculated by a 2-tailed unpaired Student t test. (G) Total SCF level in the BM of Pf4-cre−; iDTR mice and Pf4-cre+; iDTR mice 2 hours after platelet depletion (Ctrl., n = 4; Depl., n = 4). (H) Cell cycle analysis of CD41− HSCs and CD41− MPP2 in Pf4-cre−; iDTR mice was performed 12 hours after platelet depletion (Ctrl., n = 8; Depl., n = 13). (I) Cell cycle analysis of CD41− HSCs and CD41− MPP2 in Pf4-cre+; iDTR mice was performed 12 hours after platelet depletion (Ctrl., n = 7; Depl., n = 6).
SCF activates hematopoietic cells during acute thrombocytopenia. (A) Quantification of soluble and total SCF in the BM 2 hours after platelet depletion (soluble: Ctrl., n = 10; Depl., n = 12; total: Ctrl., n = 10; Depl., n = 10). (B) Frequency of Mks expressing SCF at the membrane 2 hours after platelet depletion analyzed by flow cytometry (Ctrl., n = 5; Depl., n = 5). (C) Cell cycle analysis of CD41− HSCs and CD41− MPP2 in the absence or presence of c-Kit receptor blocking (ACK2) antibody and/or following platelet depletion (Ctrl., n = 9; Depl., n = 10; Ctrl.+ACK2, n = 4; Depl.+ACK2, n = 5). (D) Phosphorylation of Stat5 and Erk1/2 in control and thrombocytopenic mice, with or without c-Kit receptor blocking 2 hours after platelet depletion (data combined from 2 independent experiments, n = 4). (E) Representative photomicrographs displaying colocalization of CD150+/CD48− Lin− HSCs (arrowheads) and Mk (asterisks) 24 hours after platelet depletion. Scale bars represent 15 μm. (F) Frequency of HSCs/Mks relative to the distance between both cell types (2 independent experiments, ≥100 cells per mouse; Ctrl., n = 4; Depl. n = 3). P values were calculated by a 2-tailed unpaired Student t test. (G) Total SCF level in the BM of Pf4-cre−; iDTR mice and Pf4-cre+; iDTR mice 2 hours after platelet depletion (Ctrl., n = 4; Depl., n = 4). (H) Cell cycle analysis of CD41− HSCs and CD41− MPP2 in Pf4-cre−; iDTR mice was performed 12 hours after platelet depletion (Ctrl., n = 8; Depl., n = 13). (I) Cell cycle analysis of CD41− HSCs and CD41− MPP2 in Pf4-cre+; iDTR mice was performed 12 hours after platelet depletion (Ctrl., n = 7; Depl., n = 6).
Next, to assess the impact of SCF in the early phase after platelet depletion, we blocked SCF-dependent signal transduction by injecting mice with ACK2, an antibody known to specifically block Kit.38 ACK2 treatment prior to platelet depletion completely prevented activation of HSC/MPP2 proliferation, as well as strongly repressed the activation of Stat5 and Erk1/2 signaling pathways in HSCs in response to acute thrombocytopenia (Figure 3C-D). Together, these results strongly suggest a vital role for SCF in driving the initial HSPC proliferation response to platelet depletion.
Recent evidence suggests that HSCs are frequently located close to Mks.6,7 We wanted to investigate whether platelet depletion would change the localization of both cell types relative to each other. For this, we used 3-dimensional whole-mount imaging and found a closer localization of HSCs to Mks 2 hours after platelet depletion (Figure 3E-F; supplemental Video 1). Next, we assessed the effects of deleting Mks to understand their impact in acute thrombocytopenia using Pf4 (CXCL4)-cre; iDTR mice.6,7 Three days after DT induction, Mks were depleted in Pf4-cre+; iDTR mice, but the number of platelets in the circulation was not reduced in Mk-deficient mice compared with DT-treated Cre− littermates (supplemental Figure 6D-E). Consecutive platelet depletion resulted in the anticipated increase in total SCF in Cre− mice; this effect was not present in the Mk-deficient Cre+ mice (Figure 3G). Furthermore, HSPCs from Cre− littermates showed activation of cell cycle progression (Figure 3H), whereas this effect was abolished in mice devoid of Mks (Figure 3I). Taken together, these data suggest that m-SCF on Mks is essential for the activation of HSPCs in response to acute thrombocytopenia.
Early PDGF-BB release drives an increase in SCF concentration in BM
PDGF-BB is a growth factor originally discovered in platelet granules that is capable of activating Mks39,40 and stimulating SCF production.41 We assessed PDGF-BB concentration 30 minutes and 2 hours after injection of antiplatelet serum and found negligible circulatory PDGF-BB combined with a significant increase in its concentration in the BM (Figure 4A-B). At the cellular level, we found that Mks and ECs, but no other niche cells, upregulated Pdgf-b mRNA in response to acute thrombocytopenia (Figure 4C; supplemental Figure 7A), in agreement with earlier reports.42,43 We detected a significant increase in PDGF-BB in the BM supernatant in platelet-depleted Mk-deficient Pf4-cre+; iDTR mice (Figure 4D; supplemental Figure 7B); hence, BM-EC is at least 1 of the cell types responsible for the increased production of this growth factor during acute thrombocytopenia.
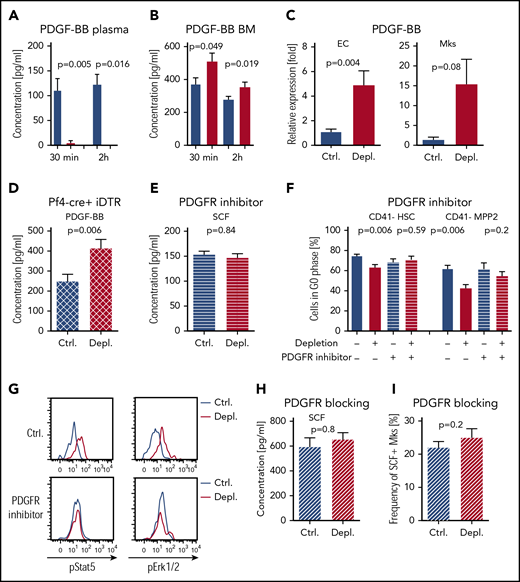
PDGF-BB directly activates m-SCF but stimulates HSC/MPP2 proliferation indirectly. (A) PDGF-BB in plasma 30 minutes (Ctrl., n = 5; Depl., n = 6) and 2 hours (Ctrl., n = 5; Depl., n = 4) after platelet depletion. Ctrl. in blue, Depl. in red. (B) PDGF-BB in BM 30 minutes (Ctrl., n = 7; Depl., n = 7) and 2 hours (Ctrl., n = 10; Depl., n = 9) after depletion. (C) Quantitative PCR analysis of Pdgf-b expression in ECs (Ctrl., n = 11; Depl., n = 11) and Mks (Ctrl., n = 3; Depl., n = 3) at 2 hours after platelet depletion. (D) PDGF-BB in the BM of Pf4-cre+; iDTR mice at 2 hours after depletion (Ctrl., n = 4; Depl., n = 5). (E) Total SCF in the BM after PDGFR inhibitor treatment and platelet depletion at 2 hours (Ctrl., n = 5; Depl., n = 5). (F) Cell cycle analysis of CD41− HSCs and CD41− MPP2 after PDGFR signaling inhibition and induction of thrombocytopenia (Ctrl., n = 5; Depl., n = 7; Ctrl.+blocking, n = 7; Depl.+blocking, n = 7). (G) Representative graphs of pStat5 and pErk1/2 in HSCs, with and without PDGFR inhibition, 2 hours after platelet depletion (data combined from 2 independent experiments, n = 4). (H) Total SCF in the BM after PDGFRb blocking antibody treatment and platelet depletion at 2 hours (Ctrl., n = 5; Depl., n = 5). (I) Frequency of m-SCF+ Mks after PDGFRb blocking antibody treatment and platelet depletion at 2 hours, as analyzed by fluorescence-activated cell sorting (Ctrl., n = 5; Depl., n = 5).
PDGF-BB directly activates m-SCF but stimulates HSC/MPP2 proliferation indirectly. (A) PDGF-BB in plasma 30 minutes (Ctrl., n = 5; Depl., n = 6) and 2 hours (Ctrl., n = 5; Depl., n = 4) after platelet depletion. Ctrl. in blue, Depl. in red. (B) PDGF-BB in BM 30 minutes (Ctrl., n = 7; Depl., n = 7) and 2 hours (Ctrl., n = 10; Depl., n = 9) after depletion. (C) Quantitative PCR analysis of Pdgf-b expression in ECs (Ctrl., n = 11; Depl., n = 11) and Mks (Ctrl., n = 3; Depl., n = 3) at 2 hours after platelet depletion. (D) PDGF-BB in the BM of Pf4-cre+; iDTR mice at 2 hours after depletion (Ctrl., n = 4; Depl., n = 5). (E) Total SCF in the BM after PDGFR inhibitor treatment and platelet depletion at 2 hours (Ctrl., n = 5; Depl., n = 5). (F) Cell cycle analysis of CD41− HSCs and CD41− MPP2 after PDGFR signaling inhibition and induction of thrombocytopenia (Ctrl., n = 5; Depl., n = 7; Ctrl.+blocking, n = 7; Depl.+blocking, n = 7). (G) Representative graphs of pStat5 and pErk1/2 in HSCs, with and without PDGFR inhibition, 2 hours after platelet depletion (data combined from 2 independent experiments, n = 4). (H) Total SCF in the BM after PDGFRb blocking antibody treatment and platelet depletion at 2 hours (Ctrl., n = 5; Depl., n = 5). (I) Frequency of m-SCF+ Mks after PDGFRb blocking antibody treatment and platelet depletion at 2 hours, as analyzed by fluorescence-activated cell sorting (Ctrl., n = 5; Depl., n = 5).
To understand whether PDGF-BB has a significant influence on SCF localization on Mk cells and/or subsequent HSPC activation, we treated mice with a specific PDGFR inhibitor prior to platelet depletion.44 Silencing PDGFR signaling prevented the increase in total SCF (Figure 4E) and significantly inhibited HSC and MPP2 proliferation, which was also accompanied by abrogated phosphorylation of Stat5 and Erk1/2 in HSCs (Figure 4F-G). Using a specific blocking antibody against PDGFRb,45 we confirmed that PDGFRb signaling is responsible for the increase in total SCF and localization of SCF on Mk membranes (Figure 4H-I). Thus, these results support a network of events whereby, upon acute thrombocytopenia, PDGF-BB induces SCF membrane localization in Mks, which, in turn, stimulates the proliferation of HSPCs, whereas HSCs themselves do not express PDGFRb (supplemental Figure 7C).
VEGFR-2 signaling promotes HSC and MPP2 activation through PDGF-BB and/or m-SCF induction
Despite high and uniform Kit expression among early HSPCs, MPP3/4 did not respond to acute thrombocytopenia in our model. We speculated that at least a second factor complements the actions of SCF with regard to selective activation of HSCs/MPP2/PreMegs. A previous study reported that Kdr (VEGFR-2) is selectively expressed in HSCs/MPP2 but not in MPP3/4.46 Therefore, we stained for pVEGFR-2 on different HSPCs after platelet depletion and demonstrated an increase in pVEGFR-2 in HSCs, MPP2, and PreMegs but not in MPP3/4 (Figure 5A). Additionally, we detected a significant increase in Vegfa mRNA in ECs and Mks, as well as in VEGF-A protein in the BM supernatant, shortly after platelet depletion (Figure 5B-C; supplemental Figure 7D). In line with this, we found significantly higher pVEGFR-2 in Mks, as well as in BM-ECs, after platelet depletion (Figure 5D). VEGF-A levels remained significantly high in the BM supernatant after PDGFR signaling blocking and in thrombocytopenic Mk-deficient Pf4-cre; iDTR mice (Figure 5E; supplemental Figure 7E-F); the last observation indicated that BM-ECs were at least partly responsible for upregulation of VEGF-A.
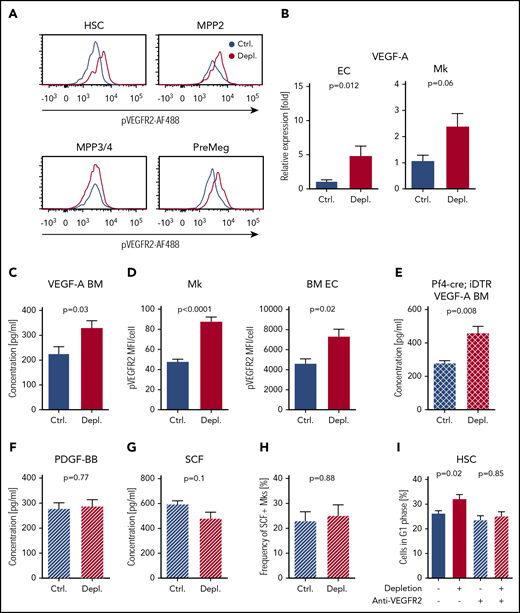
VEGF-A is required for the activation of HSCs and MPP2 in response to acute thrombocytopenia. (A) Representative graphs of pVEGFR-2 on the surface of HSCs, MPP2, PreMegs, and MPP3/4 2 hours after platelet depletion. (B) Quantitative PCR analysis of Vegf-a expression in ECs (Ctrl., n = 11; Depl., n = 13) and Mks (Ctrl., n = 5; Depl., n = 4) 2 hours after platelet depletion. (C) Concentration of VEGF-A in the BM supernatant 2 hours after platelet depletion (Ctrl., n = 7; Depl., n = 13). (D) Mean fluorescence intensity (MFI) of pVEGFR-2 on Mks (Ctrl., n = 7; Depl., n = 7; minimum 60 Mks per condition) and BM-ECs (Ctrl., n = 6; Depl., n = 8). (E) Concentration of VEGF-A in the BM supernatant of Pf4-cre+; iDTR mice 2 hours after platelet depletion (Ctrl., n = 5; Depl., n = 5). (F) Concentration of PDGF-BB in the BM supernatant of mice treated with anti-VEGFR-2 antibody prior to platelet depletion. Samples were collected 2 hours after platelet depletion (Ctrl., n = 6; Depl., n = 5). (G) Concentration of total SCF in the BM of anti-VEGFR-2–treated mice 2 hours after platelet depletion (Ctrl., n = 6; Depl., n = 5). (H) Frequency of m-SCF+ Mks after PDGFRb blocking antibody treatment and platelet depletion at 2 hours, as analyzed by fluorescence activated cell sorting (Ctrl., n = 5; Depl., n = 5). (I) Cell cycle analysis of CD41− HSCs after VEGFR-2 signaling blockade in control and thrombocytopenic mice. Anti-VEGFR-2 antibodies were injected 10 minutes prior to thrombocytopenia. Cells were analyzed 12 hours after platelet depletion (Ctrl., n = 6; Depl., n = 6; Ctrl.+blocking, n = 4; Depl.+blocking, n = 9).
VEGF-A is required for the activation of HSCs and MPP2 in response to acute thrombocytopenia. (A) Representative graphs of pVEGFR-2 on the surface of HSCs, MPP2, PreMegs, and MPP3/4 2 hours after platelet depletion. (B) Quantitative PCR analysis of Vegf-a expression in ECs (Ctrl., n = 11; Depl., n = 13) and Mks (Ctrl., n = 5; Depl., n = 4) 2 hours after platelet depletion. (C) Concentration of VEGF-A in the BM supernatant 2 hours after platelet depletion (Ctrl., n = 7; Depl., n = 13). (D) Mean fluorescence intensity (MFI) of pVEGFR-2 on Mks (Ctrl., n = 7; Depl., n = 7; minimum 60 Mks per condition) and BM-ECs (Ctrl., n = 6; Depl., n = 8). (E) Concentration of VEGF-A in the BM supernatant of Pf4-cre+; iDTR mice 2 hours after platelet depletion (Ctrl., n = 5; Depl., n = 5). (F) Concentration of PDGF-BB in the BM supernatant of mice treated with anti-VEGFR-2 antibody prior to platelet depletion. Samples were collected 2 hours after platelet depletion (Ctrl., n = 6; Depl., n = 5). (G) Concentration of total SCF in the BM of anti-VEGFR-2–treated mice 2 hours after platelet depletion (Ctrl., n = 6; Depl., n = 5). (H) Frequency of m-SCF+ Mks after PDGFRb blocking antibody treatment and platelet depletion at 2 hours, as analyzed by fluorescence activated cell sorting (Ctrl., n = 5; Depl., n = 5). (I) Cell cycle analysis of CD41− HSCs after VEGFR-2 signaling blockade in control and thrombocytopenic mice. Anti-VEGFR-2 antibodies were injected 10 minutes prior to thrombocytopenia. Cells were analyzed 12 hours after platelet depletion (Ctrl., n = 6; Depl., n = 6; Ctrl.+blocking, n = 4; Depl.+blocking, n = 9).
To test the importance of VEGF signaling in the activation of HSPCs, we blocked VEGFR-2 with a specific antibody shortly before platelet depletion and found that the previously observed increase in PDGF-BB in the BM supernatant, as well as m-SCF on Mks, was blocked (Figure 5F-H). In contrast, inhibition of PDGF-BB signaling did not affect the VEGF-A increase in the BM supernatant (supplemental Figure 7F), suggesting that VEGF-A acts upstream of PDGF-BB. Additionally, anti-VEGFR-2 pretreatment prevented HSC proliferation (Figure 5I). Together, these results reveal that VEGF-A is crucial for the HSPC response during the early phase of acute thrombocytopenia.
Chronic thrombocytopenia impairs HSC function
Next, we studied whether acute thrombocytopenia affects the repopulation capacity of HSCs and MPP2 by transplanting these cells, at 48 hours after platelet depletion, into lethally irradiated recipient mice (supplemental Figure 8A-B). Although, we did not find any difference in the reconstitution capacity of HSCs from control and depleted mice (supplemental Figure 8A), the MPP2 population from thrombocytopenic mice exhibited reduced platelet repopulation (supplemental Figure 8B).
Because a single injection of antiplatelet serum induced HSC proliferation, we speculated that repeated cycles of platelet depletion over a longer time period would lead to HSC exhaustion. To test this hypothesis, we injected mice with the antiplatelet serum every other day for 2 weeks. Despite higher numbers of CD41− HSCs, CD41− MPP2, and CD41+ MPP2 in the depleted mice compared with controls (Figure 6A), the frequency of nonproliferating cells was identical to untreated controls (Figure 6B), probably as a result of a new equilibrium that was already formed at this stage. To assess functionality of HSCs after chronic platelet depletion, we transplanted HSCs along with competitors into lethally irradiated recipient mice and found that, even at early time points after primary transplantation, HSCs from the chronically platelet depleted mice showed a significantly lower repopulation capacity compared with that of control mice (Figure 6C). This repopulation defect was even more prominent after secondary transplantation (Figure 6D); these observations imply that chronic activation of HSCs in response to prolonged thrombocytopenia impairs their repopulation capacity.
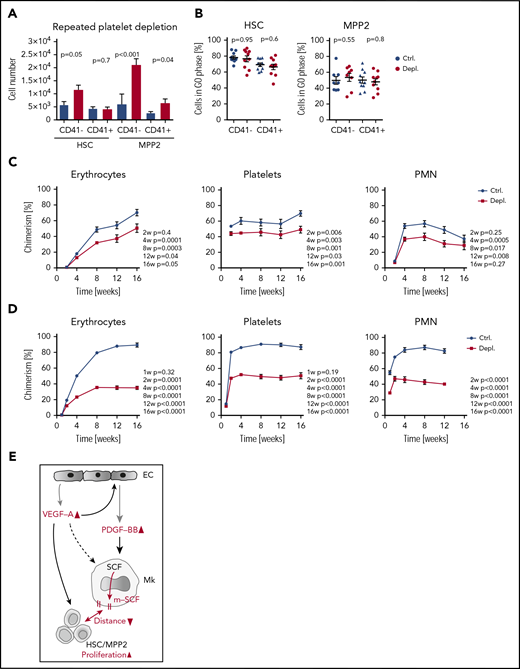
Chronic platelet depletion leads to HSC exhaustion. (A) Numbers of CD41−/+ HSCs and CD41−/+ MPP2 in BM of mice that were injected with antiplatelet or control serum every second day for 2 weeks; BM was analyzed at day 15 (Ctrl., n = 14; Depl., n = 14). (B) Cell cycle analysis of CD41−/+ HSCs and CD41−/+ MPP2 after repetitive platelet depletion (Ctrl., n = 10; Depl., n = 10). (C) HSCs (300 cells) were sorted from Ubc-GFP mice after chronic platelet depletion and transplanted into lethally irradiated recipients together with 5 × 10⁵ total BM competitor cells. The frequency of donor-derived blood cells was followed up to 16 weeks (Ctrl., n = 5-11; Depl., n = 6-11). (D) Frequency of donor-derived blood cells after secondary transplantation of 300 HSCs from mice with chronic platelet depletion together with 5 × 10⁵ fresh total BM competitor cells (Ctrl., n = 6; Depl., n = 6). (E) Increased expression and localization of different growth factors and activation of their receptors consequently leads to activation of HSC/MPP2 proliferation in response to acute thrombocytopenia. Upon platelet depletion, VEGF-A is quickly released in the BM. Next, VEGF-A/VEGFR-2 activation on ECs and possibly other cells induces the production and release of PDGF-BB, which triggers the localization of SCF from the cytoplasm of Mks to their membrane (m-SCF). In turn, this potentially imposes juxtacrine signaling between Mks and HSPCs (m-SCF/c-Kit), decreases the relative distance between both cell types, and, in conjunction with VEGF-A/VEGFR-2, specifically activates HSCs and MPP2. Gray arrows represent release/production/localization, black arrows represent binding/activation, double-headed arrows represent nearing of different cells, and red color denotes changes upon platelet depletion.
Chronic platelet depletion leads to HSC exhaustion. (A) Numbers of CD41−/+ HSCs and CD41−/+ MPP2 in BM of mice that were injected with antiplatelet or control serum every second day for 2 weeks; BM was analyzed at day 15 (Ctrl., n = 14; Depl., n = 14). (B) Cell cycle analysis of CD41−/+ HSCs and CD41−/+ MPP2 after repetitive platelet depletion (Ctrl., n = 10; Depl., n = 10). (C) HSCs (300 cells) were sorted from Ubc-GFP mice after chronic platelet depletion and transplanted into lethally irradiated recipients together with 5 × 10⁵ total BM competitor cells. The frequency of donor-derived blood cells was followed up to 16 weeks (Ctrl., n = 5-11; Depl., n = 6-11). (D) Frequency of donor-derived blood cells after secondary transplantation of 300 HSCs from mice with chronic platelet depletion together with 5 × 10⁵ fresh total BM competitor cells (Ctrl., n = 6; Depl., n = 6). (E) Increased expression and localization of different growth factors and activation of their receptors consequently leads to activation of HSC/MPP2 proliferation in response to acute thrombocytopenia. Upon platelet depletion, VEGF-A is quickly released in the BM. Next, VEGF-A/VEGFR-2 activation on ECs and possibly other cells induces the production and release of PDGF-BB, which triggers the localization of SCF from the cytoplasm of Mks to their membrane (m-SCF). In turn, this potentially imposes juxtacrine signaling between Mks and HSPCs (m-SCF/c-Kit), decreases the relative distance between both cell types, and, in conjunction with VEGF-A/VEGFR-2, specifically activates HSCs and MPP2. Gray arrows represent release/production/localization, black arrows represent binding/activation, double-headed arrows represent nearing of different cells, and red color denotes changes upon platelet depletion.
Discussion
We investigated the acute effects of severe platelet depletion as a model resembling ITP and demonstrated that HSCs and MPP2, but not MPP3/4, respond rapidly to thrombocytopenia by actively proliferating. Mechanistically, an orchestrated network of 3 RTKs in HSPCs and Mks was shown to underlie this selective response.
We demonstrated divergent stress-related behavior in CD41+ and CD41− HSCs, with CD41− HSCs actively proliferating in response to acute thrombocytopenia, whereas CD41+ HSCs seem to intensely differentiate. The latter was underscored by the expression of Mk-related genes in steady-state CD41+ HSCs only, accompanied by a reduced capacity to generate Mk-specific colonies after platelet depletion in vitro. Selective activation of MPP2 with a possible bias toward Mk production upon hematopoietic stress is in line with a study by Pietras and colleagues.47
We focused on 3 RTKs and their respective ligands and demonstrated a significant increase in m-SCF on Mks. These results are consistent with an earlier report stating that m-SCF is the dominant isoform in vivo, which provides long-term support to c-Kit–expressing target cells via juxtacrine associations.48 This m-SCF/c-Kit interaction appears to be a key regulator of HSPC activation, as demonstrated by c-Kit receptor blockade that resulted in inhibition of the downstream signal transduction pathways Stat5 and Erk1/2 and, consequently, abrogation of HSPC proliferation. We found that, upon acute thrombocytopenia, HSCs and Mks moved markedly closer to each other, whereas depletion of Mks abrogated HSC/MPP2 proliferation. These data, together with previous findings,6,7 identified Mks as central niche cells that drive HSPC activation as a response to acute thrombocytopenia.
Concurrently, acute thrombocytopenia caused higher VEGF-A and PDGF-BB levels in the BM, and subsequent inhibition of the activation of their receptor tyrosine kinases, VEGFR-2 and PDGFRb, prevented activation of HSCs/MPP2. ECs and Mks upregulated Vegfa and Pdgfb gene expression, but Mk depletion had no effect on PDGF-BB or VEGF-A levels, indicating their production by at least ECs upon platelet depletion. However, only inhibition of VEGFR-2 activation prevented an increase in PDGF-BB release, SCF membrane localization in Mks, and HSC/MPP2 proliferation, whereas PDGFR blocking was unable to prevent VEGF-A induction. These data indicate that, upon platelet depletion, VEGF-A/VEGFR-2 signaling preceded PDGF-BB expression, whereas all 3 RTKs and their ligands contribute to driving HSPC proliferation (Figure 6E). This network may also be active in other conditions associated with low platelet numbers, such as cancer-associated thrombocytopenia or drug-related side effects.
Our results resolve the intriguing question of why HSCs and MPP2, but not MPP3/4, selectively respond to thrombocytopenia. VEGFR-2 was shown to be expressed in HSCs/MPP2 but not in MPP3/4,46 and we found that the simultaneous stimulation of c-Kit and VEGFR-2 is required to activate HSCs/MPP2.
Collectively, our results clearly demonstrate that niche cells, including ECs and Mks, trigger different cascades of events under these conditions, which lead to selective activation of HSCs and MPP2. We speculate that such complex dual signaling may control selective HSPC activation in response to other stress conditions.
The RNA sequencing data reported in this article have been deposited in the Gene Expression Omnibus database (accession number GSE133947).
All data are available upon request (tatyana.grinenko@uniklinikum-dresden.de).
The online version of this article contains a data supplement.
The publication costs of this article were defrayed in part by page charge payment. Therefore, and solely to indicate this fact, this article is hereby marked “advertisement” in accordance with 18 USC section 1734.
Acknowledgments
The authors thank P. S. Frenette for helpful discussions, advice on whole-mount sternum preparation/staining, and Pf4-cre; iDTR mice, as well as Vasuprada Iyengar for language and content editing.
This work was supported by the Core Facility Cellular Imaging at the Faculty of Medicine Carl Gustav Carus, as well as by grants from Deutsche Forschungsgemeinschaft (GR4857/1-1) (T.G.) and a Center for Regenerative Therapies Dresden seed grant to T.G. and B.W. T.G. received support from the Fritz Thyssen Foundation (10.14.2.153), and B.W. was supported by the Heisenberg program (Deutsche Forschungsgemeinschaft WI3291/5-1 and 12-1).
Authorship
Contribution: T.G. designed the study; B.R., T.G., and A.K. performed the majority of the experiments; J.R. developed the panel for mass spectrometry by time of flight experiments; A.S. performed deep sequencing analysis; S.R and A.D. performed next-generation sequencing; M.G. performed multiphoton microscopy; T.G. and B.W. supervised the research and wrote the manuscript; B.R., A.G., and T.C. edited the manuscript; and all authors discussed the results and commented on the manuscript.
Conflict-of-interest disclosure: The authors declare no competing financial interests.
Correspondence: Tatyana Grinenko, Technische Universität Dresden, Fetscherstrasse 74, Dresden 01307, Germany; e-mail: tatyana.grinenko@uniklinikum-dresden.de; and Ben Wielockx, Technische Universität Dresden, Fetscherstrasse 74, Dresden 01307, Germany; e-mail: ben.wielockx@tu-dresden.de.

This feature is available to Subscribers Only
Sign In or Create an Account Close Modal