

Key Points
RAS/RTK mutations occur in 63% of patients with t(8;21) AML and confer poor prognosis.
One third of patients with t(8;21) AML who relapse are genetically distinct from diagnostic findings.

Abstract
Acute myeloid leukemia with t(8;21)(q22;q22) is characterized by considerable clinical and biological heterogeneity leading to relapse in up to 40% of patients. We sequenced coding regions or hotspot areas of 66 recurrently mutated genes in a cohort of 331 t(8;21) patients. At least 1 mutation, in addition to t(8;21), was identified in 95%, with a mean of 2.2 driver mutations per patient. Recurrent mutations occurred in genes related to RAS/RTK signaling (63.4%), epigenetic regulators (45%), cohesin complex (13.6%), MYC signaling (10.3%), and the spliceosome (7.9%). Our study identified mutations in previously unappreciated genes: GIGYF2, DHX15, and G2E3. Based on high mutant levels, pairwise precedence, and stability at relapse, epigenetic regulator mutations were likely to occur before signaling mutations. In 34% of RAS/RTKmutated patients, we identified multiple mutations in the same pathway. Deep sequencing (∼42 000×) of 126 mutations in 62 complete remission samples from 56 patients identified 16 persisting mutations in 12 patients, of whom 5 lacked RUNX1-RUNX1T1 in quantitative polymerase chain reaction analysis. KIThigh mutations defined by a mutant level ≥25% were associated with inferior relapse-free survival (hazard ratio, 1.96; 95% confidence interval, 1.22-3.15; P = .005). Together with age and white blood cell counts, JAK2, FLT3-internal tandem duplicationhigh, and KIThigh mutations were identified as significant prognostic factors for overall survival in multivariate analysis. Whole-exome sequencing was performed on 19 paired diagnosis, remission, and relapse trios. Exome-wide analysis showed an average of 16 mutations with signs of substantial clonal evolution. Based on the resemblance of diagnosis and relapse pairs, genetically stable (n = 13) and unstable (n = 6) subgroups could be identified.
Introduction
Core binding factor acute myeloid leukemia (AML), the most common cytogenetic subtype of AML, is defined by the presence of t(8;21)(q22;q22) or inv(16)(p13q22)/t(16;16)(p13;q22). AML with t(8;21)(q22;q22) is recognized by the World Health Organization as a unique entity within the category of “AML with recurrent genetic abnormalities.”1 Compared with other cytogenetic subsets of AML, patients with t(8;21) are considered a favorable risk group because of their high remission and survival rates.2
t(8;21)(q22;q22) fuses the RUNX1 gene located on chromosome 21 to the RUNX1T1 gene located on chromosome 8, leading to the RUNX1–RUNX1T1 fusion gene (also known as AML1–ETO fusion).3 The functional consequences of this fusion have been well studied over the last decade.4,5 Unequivocally, RUNX1–RUNX1T1 inhibits wild-type RUNX1 function in a dominant-negative manner by competing for heterodimerization and DNA binding at Runx binding sites.5 Although recognized as a leukemia-initiating event, the fusion is not sufficient to induce leukemia in murine or human hematopoietic cells,6-8 suggesting that additional genetic aberrations are required for overt full-blown leukemia. Recently, massively parallel-sequencing studies have unraveled a long list of somatic gene mutations underlying the leukemogenesis of t(8;21) AML. In addition to known mutations in the RAS (K/NRAS) and tyrosine kinase signaling pathways (RAS/RTK; CBL, FLT3, JAK2, KIT, PTPN11), chromatin modifiers/epigenetic regulators of transcription (ASXL1/2, BCOR/L1, TET2), MYC signaling (MGA, MYC, CCND1/2), and components of the cohesin complex are recurrently altered.9-19 Some of these genetic aberrations, such as KIT mutations and FLT3–internal tandem duplication (ITD), have been reported to confer poor prognosis in some, but not all, studies.20 It has been suggested that this poor prognosis is restricted to patients with a high allele burden of these mutant genes.21 Previous studies have been limited by relatively small sample numbers, a focus on limited gene sets, or they had pooled pediatric and adult patients. Therefore, we embarked on a comprehensive molecular study of 331 adult AML patients with t(8;21) using a 66-gene targeted sequencing panel approach to more definitively review these issues that are potentially relevant to the choice of therapy.
Current knowledge about genetic aberrations and patterns of clonal evolution at relapse of t(8;21) AML is limited. Two studies investigated paired diagnosis/relapse specimen (5 and 7 cases, respectively).9,17 Whole-exome sequencing (WES) demonstrated dynamic patterns of clonal evolution during disease progression, including loss, retention, or gain of mutations. However, no relapse-specific genetic aberrations have been identified to date. To provide further insight into disease progression, we have carried out WES of 19 paired diagnosis, complete remission (CR), and relapse trios, tracking the different genetic clones during disease evolution.
Methods
Patients
Bone marrow or peripheral blood samples from 331 adolescent/adult patients (aged 15-84 years) with t(8;21) AML were collected from collaborating institutions in Germany (n = 65), The Netherlands (n = 50), Taiwan (n = 80), and the United Kingdom (n = 136). More than 75% of patients were enrolled into multicenter treatment trials of the German AML study group (AML SHG protocols 0295 and 0199, AMLSG 07-04), HOVON/SAKK protocols -04, -29, -42, -42A, and -102, and UK MRC AML10, AML12, and AML15 trials. Details of the treatment protocols have been reported previously.22-33 All but 5 patients were treated with an intensive cytarabine/anthracycline induction backbone and subsequent cytarabine-based consolidation therapy. Cumulative dosages of high-dose cytarabine varied among the different treatment strategies: AMLSG (18-54 g/m2), HOVON/SAKK (13-25 g/m2), MRC (1-45 g/m2), and Taiwan (48-64 g/m2). A total of 27 patients received allogeneic hematopoietic stem cell transplantation in the first remission. Written consent was obtained in accordance with the Declaration of Helsinki, and ethical approval was obtained from the local ethics committees.
Mutation analysis by targeted sequencing
A total of 305 patients was screened for 66 genes recurrently mutated in AML using a customized version of the TruSight Myeloid Sequencing panel (supplemental Table 1, available on the Blood Web site), according to the manufacturer’s instructions. Libraries were paired-end sequenced with a mean sequencing depth of ∼4000× on a NextSeq sequencer and of ∼1000× on a MiSeq sequencer (supplemental Figure 1). Variants were detected with a variant allele frequency (VAF) cutoff of 5%. Of all detected variants, 38% were validated by amplicon-based targeted deep sequencing (n = 243), digital droplet polymerase chain reaction (n = 27), or Sanger sequencing (n = 9), as previously described.34-38 Variant calling and criteria used for candidate selection are detailed in supplemental Material and methods.
Other cytogenetic and molecular analyses
The t(8;21) rearrangement was determined by karyotyping (as well as additional cytogenetic abnormalities) and/or fluorescence in situ hybridization and/or evidence of RUNX1–RUNX1T1 fusion transcripts, as previously described.39,40 The screening for FLT3-ITD was performed by Genescan-based fragment analysis enabling quantification of the allelic ratio (AR).41-43
WES and clonal evolution
WES, with an average reading depth of 138×, was performed for 26 paired diagnosis/CR samples (supplemental Table 2). For 19 of these patients, samples were additionally sequenced at first relapse (Rel1), and for 4 patients, samples were additionally sequenced at first and at second relapse (Rel2). WES was performed using SureSelect Human All Exon V5 and V6 (Agilent Technologies, Santa Clara, CA) enrichment, followed by sequencing on a HiSeq 2500 platform (Illumina, San Diego, CA).44-46 For patients suffering from 2 relapses, clonal evolution was evaluated by amplicon-based targeted deep sequencing of all single nucleotide variations (SNVs) detected at diagnosis, CR1, Rel1, CR2, and Rel2 (n = 650 SNVs).
Statistical analysis
To determine the sequential order of acquired mutations, we applied Bradley-Terry maximum likelihood model fitting to cases with ≥2 mutations (n = 212). The gene MGA was used as reference. We used the Pearson Goodness-of-Fit Test to determine whether mutations in RAS/RTK signaling genes showed statistical evidence for clonal heterogeneity. We assumed that mutations occurred in different clones at P < .05.
The definition of CR, overall survival (OS), and relapse-free survival (RFS) followed recommended criteria.47 Primary analysis was performed on OS. Sensitivity analyses were performed on CR and RFS. Pairwise comparisons of variables for exploratory purposes were performed using the Mann-Whitney U test or χ2 test. Kaplan-Meier analysis was performed to construct survival curves, and the log-rank test was applied to evaluate differences between subgroups. Logistic regression models, including treatment strategies of contributing study groups trial as a covariable, were used to study associations between individual variables and CR rate. Cox models stratified for treatment strategies of contributing study groups were used for time-to-event variables (OS and RFS), and P values were calculated using the Wald test. Multivariate logistic regression models were constructed for factors associated with achievement of CR, and multivariate Cox proportional hazards models were used to study factors associated with survival end points. Cytogenetic aberrations and gene mutations were included in multivariate models if they were detected in ≥10 patients with an unadjusted univariate P ≤ .1. Because mutation burden has been shown to carry important prognostic value in t(8;21) AML,21 we investigated the impact of mutant levels of FLT3-ITD and KIT mutations. Using maximally selected log-rank statistics, ARs ≥0.35 and mutant levels ≥25% were defined as FLT3-ITDhigh and KIThigh, respectively. To provide quantitative information on the relevance of results, 95% confidence intervals (CIs) of hazard ratios (HR) were computed. Two-sided P values ≤ .05 were considered significant in the primary analysis and as indicators for a trend in all additional analyses. All analyses were carried out using SPSS version 23.0 (IBM, Armonk, NY).
Results
Mutation and variant allele spectrum in t(8;21) AML
Sequencing of 331 diagnostic t(8;21) AML samples revealed a total of 729 mutations (supplemental Tables 3 and 4). Mutations were found in 49 genes, of which 42 were recurrently mutated (Figure 1A). In 316 patients (95%), we found ≥1 mutation, with 2.2 ± 1.4 (mean ± SD) mutations per patient (supplemental Figure 2). A total of 210 patients (63.4%) harbored mutations in RAS/RTK signaling pathways, with KIT (27%), NRAS (14.8%), FLT3 (16.9%; 10% of all patients harbored a FLT3-ITD), KRAS (5.7%), and CBL (5%) representing the most common RAS/RTK aberrations. Mutations in the RTK signaling regulator GIGYF2 were found in 5 patients (1.5%) and occurred in a hotspot affecting arginine codons at positions 791 and 792.48 Approximately half of all patients (149/331 = 45%) harbored a mutation in genes involved in epigenetic regulation (chromatin remodeling and DNA methylation): ASXL2 (15.7%), ASXL1 (12.4%), TET2 (7.9%), EZH2 (5.7%), and KDM6A (4.2%). Genes encoding for components of the cohesin complex or the splicing machinery were identified in 13.6% and 7.9% of patients and rarely co-occurred (supplemental Figure 3). Hotspot mutations in DHX15, an RNA helicase implicated in pre–messenger RNA splicing, mainly affected codon R222 and occurred in 6% of patients. MYC signaling was altered in 10.3% of patients, primarily due to alterations in CCND2 (4.3%) and MGA (3.6%). Additionally, a high rate of loss-of-function mutations in ZBTB7A (13%), one of the transcription factors that regulates hematopoietic differentiation, was found.16
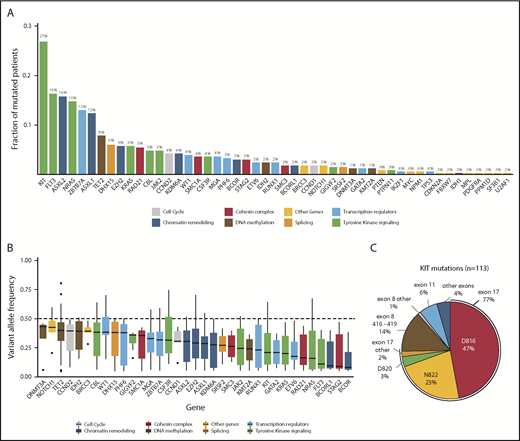
Overview of mutations identified by targeted sequencing. (A) Bar graph showing the frequency of mutated patients per gene for all genes with detected variants. Bars are colored according to the functional category of the gene (supplemental Table 16). Mutation frequencies are shown above the bars (%). FLT3 variants include FLT3-ITD and FLT3-TKD. (B) Box plots showing the median, 25% quantile, and 75% quantile of the VAF for all genes mutated in >4 patients. The dashed line indicates 50% VAF that was expected for heterozygous mutations. VAFs were corrected for patient-specific chromosomal aberrations and sex bias. Genes were color coded according to their assigned category. FLT3-ITDs were not included in this analysis. (C) Pie chart showing the distribution of 113 KIT mutations in 89 patients for the most frequent codons and exons, with mutation frequencies shown as percentage.
Overview of mutations identified by targeted sequencing. (A) Bar graph showing the frequency of mutated patients per gene for all genes with detected variants. Bars are colored according to the functional category of the gene (supplemental Table 16). Mutation frequencies are shown above the bars (%). FLT3 variants include FLT3-ITD and FLT3-TKD. (B) Box plots showing the median, 25% quantile, and 75% quantile of the VAF for all genes mutated in >4 patients. The dashed line indicates 50% VAF that was expected for heterozygous mutations. VAFs were corrected for patient-specific chromosomal aberrations and sex bias. Genes were color coded according to their assigned category. FLT3-ITDs were not included in this analysis. (C) Pie chart showing the distribution of 113 KIT mutations in 89 patients for the most frequent codons and exons, with mutation frequencies shown as percentage.
In our cohort, we observed a median VAF of 0.28. We detected the highest median VAF in genes involved in DNA methylation, including DNMT3A (0.43), TET2 (0.40), and IDH2 (0.39), suggesting that these mutations are present in the majority of the cells and, therefore, play a role in early stages of leukemogenesis (Figure 1B). We observed lower median VAFs for mutations of transcription factors (0.19), RAS/RTK signaling (0.22), and cohesin complex (0.20), especially for those in FLT3 (0.11), KIT (0.21), and the RAS GTPases NRAS (0.16) and KRAS (0.20), indicating that alterations in these genes are later events. Further, we modeled the sequential order of mutation acquisition in pairwise precedences.49 Applying this approach in 212 patients with ≥2 mutations, we confirmed genes involved in RAS/RTK pathways and chromatin remodeling to be later events, whereas TET2, ZBTB7A, and CCND2 aberrations were acquired earlier (supplemental Figure 4). We noted that 34% of patients with a RAS/RTK mutation harbored additional alterations of the same pathway. A total of 71 patients harbored ≥2 signaling mutations, with patients having mutations in different RAS/RTK genes (n = 35), different variants in the same gene (n = 22), or both (n = 14) (Figure 2A; supplemental Figure 5). Of 89 KITmutated patients, 21 (23.6%) showed additional KIT mutation(s), resulting in the highest double mutation rate in 1 gene. We found 113 KIT mutations in 89 patients, of which 86 mutations were located in exon 17, mainly SNVs at D816 or N822. In exon 8, we found 17 mutations, mainly in-frame insertions/deletions at positions 416 to 419 (Figure 1C). Most of the patients (95%) with multiple KIT mutations harbored ≥1 exon 17 mutation. To test for clonal heterogeneity, we used the Pearson Goodness-of-Fit Test.49 Although the sum of VAFs was <50% and, thus, too low for prediction tests in 54 cases, statistical evidence for clonal heterogeneity was found in 11 patients, indicating that respective mutations occurred in different clones (Figure 2B-C; supplemental Figure 5). In 6 patients, no evidence for clonal heterogeneity could be shown (P > .05).

Mutational landscape and clonal heterogeneity of RAS/RTK signaling genes. (A) Mutational landscape showing patients with mutations in RAS/RTK pathway (right panel). The mutation frequency of each gene is shown (left panel). (B) VAFs of RAS/RTK pathway mutations with evidence for clonal heterogeneity for 3 illustrative patients. (C) VAFs of RAS/RTK pathway mutations without evidence for clonal heterogeneity. Clonality prediction was determined using the Pearson Goodness-of-Fit Test.
Mutational landscape and clonal heterogeneity of RAS/RTK signaling genes. (A) Mutational landscape showing patients with mutations in RAS/RTK pathway (right panel). The mutation frequency of each gene is shown (left panel). (B) VAFs of RAS/RTK pathway mutations with evidence for clonal heterogeneity for 3 illustrative patients. (C) VAFs of RAS/RTK pathway mutations without evidence for clonal heterogeneity. Clonality prediction was determined using the Pearson Goodness-of-Fit Test.
Clinicobiological associations and prognostic impact of gene mutations in t(8;21) AML
The study population included 331 t(8;21) AML patients with a median age of 41.7 years (Table 1). Most patients were cytomorphologically classified as AML with maturation. Although 94% of patients presented with de novo AML, secondary and therapy-related AML were each diagnosed in 3% of patients. JAK2 mutations were found significantly less often in de novo AML (4.8% vs 26.7%, P < .001; supplemental Table 5). Median white blood cell (WBC) count was 17.9 × 10⁹/L and was highest in cases with an FLT3, KIT, or NRAS mutation. An extramedullary manifestation was present at diagnosis in 13 of 124 patients (10.5%) and correlated with the presence of DHX15 and KIThigh mutations, especially when a KIT mutation was located in exon 17 (25.9% vs 6.2%, P = .008; supplemental Table 6). For 316 patients, cytogenetic data from karyotyping were available. Loss of a sex chromosome was the most frequent additional aberration (loss of Y, n = 108; loss of X, n = 43). Taking molecular and cytogenetic data together, 99% showed a genetic aberration in addition to the RUNX1–RUNX1T1 fusion (Figure 3; supplemental Table 7).
Pretreatment characteristics of 331 t(8;21) AML patients (N = 331)
| Characteristics | Data |
|---|---|
| Age, median (range), y | 41.7 (15-84) |
| Sex, n (%) | |
| Male | 188 (57) |
| Female | 143 (43) |
| Diagnostic timeframe, n (%) | |
| 1990-1999 | 75 (23) |
| 2000-2004 | 76 (23) |
| 2005-2010 | 93 (28) |
| 2010-2016 | 87 (26) |
| Morphology, n (%) | |
| AML with minimal differentiation | 9 (3) |
| AML without maturation | 28 (9) |
| AML with maturation | 260 (84) |
| Acute myelomonocytic leukemia | 11 (3) |
| Acute monoblastic/monocytic leukemia | 3 (1) |
| Missing data | 20 |
| Type of AML, n (%) | |
| De novo | 305 (94) |
| Secondary | 10 (3) |
| Therapy related | 9 (3) |
| Missing data | 7 |
| Additional cytogenetic aberration, n | |
| Loss of X chromosome | 43 |
| Loss of Y chromosome | 108 |
| Trisomy 8 | 10 |
| −7/del7q | 11 |
| del9q | 37 |
| Others | 64 |
| Bone marrow blasts | |
| Mean, % | 56.8 |
| Missing data, n | 50 |
| WBC count | |
| Median, ×109/L | 17.9 |
| Range, ×109/L | 0.9-153 |
| Missing data, n | 10 |
| Hemoglobin | |
| Median, g/L | 8.1 |
| Range, g/L | 2.5-15.4 |
| Missing data, n | 60 |
| Platelet count | |
| Median, ×109/L | 51.5 |
| Range, ×109/L | 3-647 |
| Missing data, n | 40 |
WBC, white blood cell.

Mutational landscape of 327 mutated t(8;21) AML patients. The landscape shows all genetic and cytogenetic aberrations for each patient (right panel). Mutations are color coded by mutation type. The histogram shows the frequency distribution of all aberrations (left panel).
Mutational landscape of 327 mutated t(8;21) AML patients. The landscape shows all genetic and cytogenetic aberrations for each patient (right panel). Mutations are color coded by mutation type. The histogram shows the frequency distribution of all aberrations (left panel).
Clinical follow-up data were available for 322 of 331 patients. Median follow-up time for patients who remained alive was 6.74 years (range, 0.25-21.1). Overall, 296 (92.2%) patients reached CR after induction therapy, 17 patients died during induction (5.3%), and 8 experienced primary induction failure (2.5%).
Multivariate logistic regression analysis revealed a reduced CR rate in patients with a cytogenetic aberration of chromosome 7 (−7/del7q; P = .026), FLT3-ITDhigh (P = .05), or a JAK2 mutation (P = .04). Patients with a higher platelet count obtained a CR more often (P = .04; supplemental Table 8). We next evaluated the prognostic impact of clinicobiological variables on RFS. Six variables were selected for multivariate analysis stratified for treatment strategies of the contributing study groups. Restricted to male patients, loss of Y was the only independent factor for longer RFS. Together with high WBC counts and FLT3-ITDhigh, KITmutated patients with a high mutant level ≥25% were at higher risk for relapse (HR, 1.96; 95% CI, 1.22-3.15; P = .005; supplemental Table 9). With respect to OS, 9 variables were included in multivariate analysis. KIThigh and JAK2 mutations were the strongest factors for poor prognosis in our cohort (Figure 4). Additionally, age, high WBC counts, trisomy 8, and FLT3-ITDhigh were also independently associated with inferior OS. In male patients, loss of Y was associated with longer survival (HR, 0.49; 95% CI, 0.3-0.8; P = .004). Censoring our analysis for patients receiving allogeneic hematopoietic stem cell transplantation in CR1 resulted in similar results for RFS and OS. No difference was observed for any survival end point with respect to the number of signaling mutations or clonal heterogeneity status (supplemental Figure 6). Collectively, we observed that mutations predicted to occur later in leukemogenesis appear to act as predictors for clinical outcome.

Multivariate analysis with clinical and biological variables. Gene mutations were included in the Cox regression analysis if they were detected in ≥10 patients and had a univariate P value ≤ .10 for OS, not adjusted for multiple comparisons. The model was stratified for center treatment strategy. KIT-mutated patients with a VAF ≥25% and FLT3-ITD patients with AR ≥0.35 were defined as KIThigh or FLT3-ITDhigh.
Multivariate analysis with clinical and biological variables. Gene mutations were included in the Cox regression analysis if they were detected in ≥10 patients and had a univariate P value ≤ .10 for OS, not adjusted for multiple comparisons. The model was stratified for center treatment strategy. KIT-mutated patients with a VAF ≥25% and FLT3-ITD patients with AR ≥0.35 were defined as KIThigh or FLT3-ITDhigh.
Profiling of somatic mutations in AML with t(8;21) at diagnosis, CR, and relapse
WES was performed on paired diagnosis, CR, and relapse trios of 19 t(8;21) AML patients. A total of 425 SNVs and small indels with translational consequence was detected in 385 genes (supplemental Table 10), of which 19 were mutated in >1 patient (supplemental Figure 7). Only 8 SNVs were located in areas affected by 1 of the 30 copy number alterations that we detected (supplemental Table 11). The total number of somatic mutations did not change at relapse, with a mean of 16.6 mutations per patient at diagnosis and 15.5 mutations at relapse. In total, 131 mutations (31%) present at diagnosis were lost at relapse, and 110 mutations (26%) were selected/acquired during disease progression, whereas 184 mutations (43%) were found in diagnosis and relapse samples of patients (Figure 5A). Of note, the t(8;21) fusion was detected in all patients at diagnosis and relapse, suggesting common ancestral clones. All but 2 AML trio samples shared ≥1 additional genomic alteration at diagnosis and relapse. An increase of C>A and A>T transversions was observed in relapse-specific mutations compared with diagnostic mutations (P = .06; supplemental Figure 8).
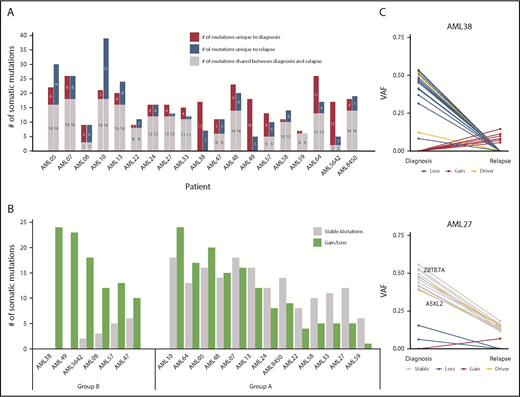
Distribution of somatic mutations in paired diagnosis relapse samples. (A) Bar graph showing the total number of SNVs per patient. For each patient, the number of mutations in diagnosis and relapse is depicted as shared, unique to diagnosis, or unique to relapse. (B) Ratio of stable/unstable (gained or lost) mutations. Patients with ≥60% gained/lost mutations were considered group B. (C) VAF plots of 2 exemplary patients from each group (group A: AML27; group B: AML38) showing the different evolutionary patterns observed from diagnosis to relapse. Known AML driver genes are highlighted. VAFs were corrected for frequent chromosomal aberrations and sex bias. The VAF plots of the remaining 17 patients can be found in supplemental Figures 10 and 11.
Distribution of somatic mutations in paired diagnosis relapse samples. (A) Bar graph showing the total number of SNVs per patient. For each patient, the number of mutations in diagnosis and relapse is depicted as shared, unique to diagnosis, or unique to relapse. (B) Ratio of stable/unstable (gained or lost) mutations. Patients with ≥60% gained/lost mutations were considered group B. (C) VAF plots of 2 exemplary patients from each group (group A: AML27; group B: AML38) showing the different evolutionary patterns observed from diagnosis to relapse. Known AML driver genes are highlighted. VAFs were corrected for frequent chromosomal aberrations and sex bias. The VAF plots of the remaining 17 patients can be found in supplemental Figures 10 and 11.
In 3 patients for whom WES was performed, we found persisting mutations in morphologically defined CR samples (VAF range, 5-14%). Although flow cytometry–based minimal residual disease monitoring was negative in 1 patient, the RUNX1–RUNX1T1 fusion was detectable at low messenger RNA levels in all cases (supplemental Table 12). This prompted us to investigate mutation persistence using amplicon-based ultradeep sequencing for 126 mutations in 62 CR samples from 56 patients (mean coverage, 41 430 reads per amplicon). A total of 16 mutations was identified in 12 samples (VAF range, 0.1-12%; supplemental Table 13), whereas the RUNX1–RUNX1T1 fusion was detectable by quantitative polymerase chain reaction during CR in 26 patients. Of note, 5 patients showed mutational residual disease while the fusion was not detectable (supplemental Figure 9).
To identify types of clonal evolution, we defined each mutation as stable, if present at diagnosis and relapse, or as lost or gained, if it was detected only at diagnosis or relapse, respectively. With the exception of AML59, in all patients parts of the individual diagnostic mutation spectrum were lost and replaced with ≥1 new mutation at relapse. These data suggest that some clones were successfully eradicated during induction chemotherapy, whereas others escaped and/or were selected and subsequently expanded at relapse by acquiring ≥1 new mutation. When calculating the ratio of the number of stable/gained or lost mutations, we found 2 evolutionary groups. Patients with ≥40% stable mutations defined group A, and cases with ≥60% of gained/lost variants were pooled in group B (Figure 5B; supplemental Figures 10-11). Group B patients (n = 6) had a dynamic tumor development, with relapse samples showing little or no resemblance to the cancer found at diagnosis. In the course of their disease, 1 major clone replaced another. For patients from group A, diagnosis and relapse showed a more similar genetic composition (Figure 5C). Although clonal evolution seemed to be patient specific, we noted some gene-related patterns. Mutations in epigenetic regulators and genes involved in cell cycle control were stable or got lost (ie, they were always found at diagnosis and never acquired just at relapse), further supporting their important role in leukemic initiation. In contrast, mutations in transcription factors, RAS/RTK signaling pathway genes, members of the cohesin complex, and splicing machinery were equally found to be stable, gained, or lost (supplemental Figure 12). When comparing baseline characteristics of relapsing t(8;21) AML patients according to their evolutionary patterns (group A or group B), no major differences were observed (supplemental Table 14). Group B patients had a significantly longer OS compared with patients with a more analogous mutation profile (group A) at diagnosis and relapse (P = .006; supplemental Figure 13). These data warrant further investigations in larger paired diagnosis/relapse cohorts for threshold fine-tuning, because an “intermediate” subgroup might also be extracted from our study.
Next, we investigated dynamic evolution of multiclonal RAS/RTK mutations to address the biological relevance of clonal heterogeneity at relapse. KIT itself, the most frequently mutated gene of the RAS/RTK signaling pathways, showed a very diverse clonal evolution, with gained or lost mutations in 7 of 10 KITmutated patients (supplemental Figure 14). In all 5 cases with multiple RAS/RTK mutations, the mutations were present in different clones at diagnosis and showed opposing clonal dynamics over time (supplemental Figure 15).
To obtain more detailed insights into the clonal architecture of t(8;21) AML and its dynamic evolution, we investigated 4 patients who suffered from a Rel2. To increase the accuracy of VAF quantification, variants were resequenced, with a mean coverage of 39 400 reads per amplicon per sample (supplemental Table 15). All patients harbored a dominant mutation cluster representing the founding clone, as well as ≥1 subclone at diagnosis. A second subclone, not the founding clone or the major diagnosis subclone, drove Rel1 and was only detectable with low VAFs at diagnosis. In group B patients (AML47 and AML57) (Figure 6A-B; supplemental Figure 16), this second clone outcompeted the other clones after induction chemotherapy, whereas the original clones were eradicated. In contrast, the other 2 patients (AML05 and AML07) kept the AML-initiating clone and/or the first major subclone as a considerable part of the tumor composition at Rel1 (Figure 6C-D; supplemental Figure 17). Therefore, it seems likely that these primary clones harbored therapy-resistance properties themselves. The high similarity between Rel1 and Rel2 indicates that both relapses were driven by the same clone; however, in Rel2, new subclones appeared, or the first major subclone came back up, suggesting ongoing DNA damage due to prolonged effects from cytotoxic therapy and/or clonal selection of very minor subclones that existed below the limit of detection.
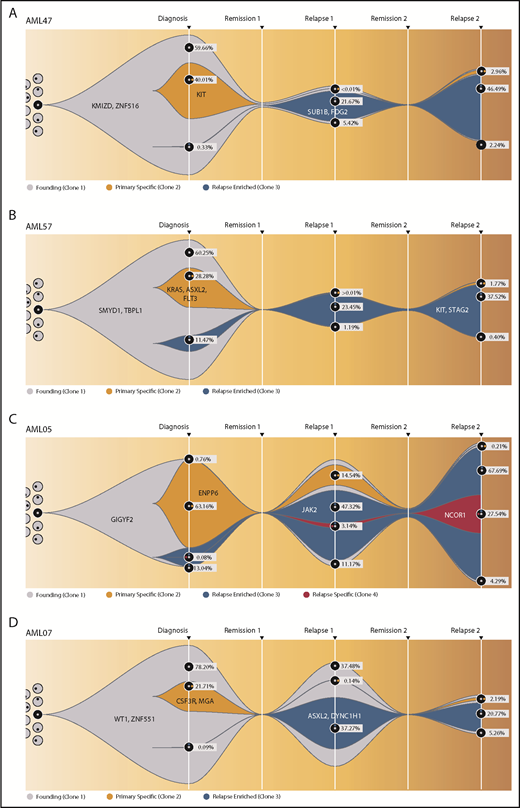
Fish plots showing the clonal evolution from primary tumor to first and second relapse for all double-relapse patients. Model of clonal progression during the course of disease for patient AML47 (A) and patient AML57 (B). For founding clone (gray), primary specific clone (yellow), and relapse-enriched clone (blue), exemplary clone-defining genes are shown. The remaining genes and their affiliation to 1 of the clones, as well as a more detailed evolutionary tree, can be found in supplemental Figures 16 and 17. For diagnosis, Rel1, and Rel2, the proportion of each subclone is shown as the percentage of the whole cell content. AML05 (C) and AML07 (D) from the group with an analogous mutation profile at diagnosis and relapse (group A) were depicted in the same manner. The RUNX1–RNX1T1 fusion was detected in all time points.
Fish plots showing the clonal evolution from primary tumor to first and second relapse for all double-relapse patients. Model of clonal progression during the course of disease for patient AML47 (A) and patient AML57 (B). For founding clone (gray), primary specific clone (yellow), and relapse-enriched clone (blue), exemplary clone-defining genes are shown. The remaining genes and their affiliation to 1 of the clones, as well as a more detailed evolutionary tree, can be found in supplemental Figures 16 and 17. For diagnosis, Rel1, and Rel2, the proportion of each subclone is shown as the percentage of the whole cell content. AML05 (C) and AML07 (D) from the group with an analogous mutation profile at diagnosis and relapse (group A) were depicted in the same manner. The RUNX1–RNX1T1 fusion was detected in all time points.
Discussion
In this study, we embarked on a comprehensive molecular investigation to unravel the molecular genetics underlying the diagnosis and relapse of t(8;21) AML in the largest cohort ever investigated (331 patients). In all but 4 patients, we detected additional genetic aberration(s) cooperating with the RUNX1–RUNX1T1 fusion to overt full-blown leukemia. In line with previous reports, the most common additional aberrations were mutations in the RAS/RTK pathways in 63% of subjects, alterations in epigenetic regulators in 45% of subjects, and loss of a sex chromosome in 48% of subjects.9,10,39 Of note, and in contrast to other AML subtypes, such as cytogenetically normal AML,50,51 we failed to identify genetic patterns of co-occurrence or exclusivity, suggesting no major mutation-based clusters/subgroups subdividing t(8;21) AML (supplemental Figure 18). Approximately one fifth of t(8;21) patients had persisting mutations during CR. Surprisingly, some of these patients tested negative for the RUNX1–RUNX1T1 fusion. Although recent reports provided evidence that persisting molecular minimal residual disease is associated with relapse and poor prognosis in AML,52-54 it will be of major interest to couple mutation and fusion quantification to improve patient monitoring in this entity in the future.
Our data show that signaling mutations are rather late events and impact patient outcome: JAK2 and FLT3-ITDhigh were associated with reduced CR rates, KIThigh was associated with shorter RFS, and JAK2, FLT3-ITDhigh, and KIThigh were associated with shorter OS. A comparable evolutionary mutation pattern has recently been described in transformed myelodysplastic syndrome patients, with secondary AML–associated mutations (type I mutations) almost always having lower VAFs than mutations in age-related clonal hematopoiesis and other mutations (type II mutations).45 In contrast to their high frequency and early nature in age-related clonal hematopoiesis,55-57 ASXL1 mutations are rather late events in t(8;21) AML, which also holds true for its homolog ASXL2. We confirm that ASXL1 mutations do not harbor prognostic impact in t(8;21) and, in line with the current European Leukemia Net risk classification,2 they should not be used as an adverse marker if co-occurring with t(8;21). RUNX1 mutations, the other mutation marker of the European Leukemia Net classification, also did not influence patient outcome in this cohort; however, because of the small patient number (n = 8), an even larger patient cohort is necessary for a final verdict.
Observations pointing to the importance of subclonal tumoral heterogeneity have been highlighted in various hematologic malignancies.45,58-61 Recently, Itzykson et al reported that clonal interference in RAS/RTK pathways, a phenomenon defined by the coexistence of clones sharing a common ancestor and harboring independent lesions targeting the same pathway, occurs in up to 36% of cases of t(8;21) AML and is associated with shorter event-free survival.62 In that study, clonal interference was defined by the presence of ≥2 signaling mutations, assuming mutations occur in different clones. We observed multiple RAS/RTK mutations in 22% of patients without an impact on CR rate, RFS, or OS. Using prediction tools, evidence for clonal heterogeneity could be identified in some of these cases; however, clonal heterogeneity and interference are not the same, because evolutionary independent genetic lesions are required for the latter. Only single-cell experiments will be able to address clonal independency of multiple RAS/RTK mutations. Nevertheless, we observed many expanding RAS/RTK mutations at relapse, pointing to the importance of clonal heterogeneity for our understanding of relapse mechanisms. With respect to relapse-specific mutations, few previously unknown genes were identified. In 11% of patients, we discovered a frameshift mutation affecting the E3 ubiquitin ligase G2E3 that has previously been implicated as a regulator of DNA damage response and cell death.63 Whether G2E3 and/or other novel mutations, such as GIGYF2 or DHX15, might be useful as target-specific treatment approaches should be addressed in future studies. Although KIT mutations have been associated with unfavorable outcome in several, but not all, studies,20,21,64 the prognostic importance of FLT3-ITD is not well established in t(8;21) AML.20 In our large cohort, high mutant levels of both genes were associated with poor prognosis. Thus, therapeutic targeting with midostaurin, a multitargeted kinase inhibitor approved for FLT3mutated AML65 ; the multikinase inhibitor dasatinib, which showed encouraging results in a phase Ib/IIa trial when added to intensive chemotherapy in core binding factor AML patients66 ; or other RTK inhibitors are promising treatment approaches to improve patient outcome.
In summary, we provide a comprehensive overview on the mutational landscape, the importance of driver genes, and models of genetic relapse. We hope that our data will serve as a basis for guided and risk-adapted treatment strategies.
The online version of this article contains a data supplement.
The publication costs of this article were defrayed in part by page charge payment. Therefore, and solely to indicate this fact, this article is hereby marked “advertisement” in accordance with 18 USC section 1734.
Acknowledgments
This work was supported by grant DA1787/1-1 from the Deutsche Forschungsgemeinschaft, a Mechthild-Harf research fellowship from the Deutsche Knochenmarkspenderdatei (DKMS) Giving Life Foundation, grant 2017_EKES.33 from the Else Kröner-Fresenius-Stiftung, grant 17/4 from the Gutermuth Stiftung, a Lady Tata Memorial Trust (F.D.), and a Deutsches Konsortium für Translationale Krebsforschung (DKTK) research grant (F.D. and L.B.). This work was also sponsored, in part, by grants MOST 106-2314-B-002-226-MY3 and 106-2314-B-002-231-MY3 from the Ministry of Science and Technology (Taiwan), grant MOHW107-TDU-B-211-114009 from the Ministry of Health and Welfare (Taiwan), and by the Project for Cancer Research and Therapeutics Evolution (Japan Agency for Medical Research and Development; 16cm0106501h0001; S.O.). W.C. received a fellowship from the Deutsche José Carreras Leukämie-Stiftung. M.H. was supported by Deutsche Forschungsgemeinschaft grants HE 5240/5-1 and HE 5240/6-1. D.C.L. and R.E.G. were supported by Bloodwise.
Authorship
Contribution: F.D. designed the research; F.C., K.H., K.Y., H.-A.H., N.W., W.C., R.H., Y.O., Y. Shiraishi, Y. Shiozawa, T.Z., and S.O. performed the research and/or bioinformatics; H.-A.H., M.H., R.K.H., O.B., P.K., W.-C.C., I.-W.B., J.-L.T., F.T., A.G., B.L., D.C.L., L.B., P.J.M.V., H.-F.T., and R.E.G. contributed patient samples and clinical data; F.C., K.H., K.Y., R.H., and F.D. analyzed the data; F.C., K.H., K.Y., H.-A.H, D.C.L., L.B., R.E.G., S.O., and F.D. wrote the manuscript; and all authors read and agreed to the final version of the manuscript.
Conflict-of-interest disclosure: The authors declare no competing financial interests.
Correspondence: Frederik Damm, Department of Hematology, Oncology, and Tumor Immunology, Charité, University Medical Center, Augustenburger Platz 1, 13353 Berlin, Germany; e-mail: frederik.damm@charite.de.

This feature is available to Subscribers Only
Sign In or Create an Account Close Modal