

Key Points
A 7-gene signature is derived that can identify myeloma patients who respond better to bortezomib- or lenalidomide-based therapy.
Treatment according to the signature is noninferior to treatment with combined bortezomib, lenalidomide, and dexamethasone.

Abstract
Improving outcomes in multiple myeloma will involve not only development of new therapies but also better use of existing treatments. We performed RNA sequencing on samples from newly diagnosed patients enrolled in the phase 2 PADIMAC (Bortezomib, Adriamycin, and Dexamethasone Therapy for Previously Untreated Patients with Multiple Myeloma: Impact of Minimal Residual Disease in Patients with Deferred ASCT) study. Using synthetic annealing and the large margin nearest neighbor algorithm, we developed and trained a 7-gene signature to predict treatment outcome. We tested the signature in independent cohorts treated with bortezomib- and lenalidomide-based therapies. The signature was capable of distinguishing which patients would respond better to which regimen. In the CoMMpass data set, patients who were treated correctly according to the signature had a better progression-free survival (median, 20.1 months vs not reached; hazard ratio [HR], 0.40; confidence interval [CI], 0.23-0.72; P = .0012) and overall survival (median, 30.7 months vs not reached; HR, 0.41; CI, 0.21-0.80; P = .0049) than those who were not. Indeed, the outcome for these correctly treated patients was noninferior to that for those treated with combined bortezomib, lenalidomide, and dexamethasone, arguably the standard of care in the United States but not widely available elsewhere. The small size of the signature will facilitate clinical translation, thus enabling more targeted drug regimens to be delivered in myeloma.
Introduction
Multiple myeloma is a plasma-cell neoplasm characterized by lytic bone lesions, hypercalcemia, renal impairment, and bone marrow failure. Although outcomes have improved in recent years with the introduction of novel agents, the disease remains incurable, and clinical responses display considerable heterogeneity.1,2 Additional improvements will come not only from introduction of new drugs but also from better use of existing drugs. Younger, fitter patients are usually treated with a drug combination involving a proteasome inhibitor (PI) and/or an immunomodulatory drug (IMiD) followed by high-dose melphalan therapy with autologous stem-cell transplantation (ASCT). For transplantation-ineligible patients, recent trial data suggest that the treatment of choice may be a combination of the PI bortezomib (Velcade; Millennium Pharmaceuticals, Cambridge, MA), the IMiD lenalidomide (Revlimid; Celgene, Summit, NJ), and dexamethasone (VRD).3 However, this combination is expensive and is not funded in most countries outside the United States. Furthermore, for frail patients, 3-drug combinations may prove too toxic.
It is possible that treatment outcomes in myeloma might be improved by the application of precision medicine (ie, the rational selection of drugs based on the biology of each patient’s tumor). Several studies have demonstrated the potential of using transcriptomic data to derive prognostic information in myeloma.4-6 Signatures can be usefully combined7 but are generally agnostic to treatment,4,5,8-12 and their main clinical utility is likely to be the identification of patients who may benefit from trials for high-risk disease. We sought to derive a signature that could predict responses to specific therapies.
The phase 2 PADIMAC (Bortezomib, Adriamycin, and Dexamethasone [PAD] Therapy for Previously Untreated Patients With Multiple Myeloma: Impact of Minimal Residual Disease in Patients With Deferred ASCT) study was designed to examine whether patients with good responses to PAD could safely avoid upfront ASCT. We employed RNA-sequencing (RNA-seq) on available good-quality RNA from enrolled patients and derived a training data set from patients with sustained deep responses in the absence of ASCT. We thus generated a signature for predicting bortezomib responsiveness in patients with myeloma not receiving ASCT. When tested in independent data sets, the signature performed well, identifying patients who benefited from bortezomib-based treatment in the absence of an IMiD. Furthermore, when tested on lenalidomide plus dexamethasone (RD)–treated patients, the signature performed in a reciprocal fashion, suggesting that it could be used as a binary classifier to choose between bortezomib-based treatment and RD. Patients who had been treated correctly according to the signature classification had a superior survival to those who had not. Indeed, in the related CoMMpass (Clinical Outcomes in Multiple Myeloma to Personal Assessment of Genetic Profile) data set, correctly treated patients receiving either bortezomib-based therapy (without IMiD) or receiving RD (without bortezomib) had a noninferior survival to those treated with VRD. This suggests that our signature could be employed to improve the safety and cost effectiveness of myeloma therapy without compromising outcomes.
Materials and methods
Sample accrual and processing and data generation
Sample accrual and RNA isolation
RNA of sufficient quality for RNA-seq was available from 44 patients treated in the PADIMAC trial (ISRCTN03381785). The trial protocol is described in the supplemental Materials, available on the Blood Web site. PADIMAC was conducted in accordance with the Declaration of Helsinki and Good Clinical Practice guidelines and was approved by the National Health Service National Research Ethics Service. Participants provided written informed consent. Patient registration and trial management were performed by the Cancer Research UK and University College London Cancer Trials Centre. All patients had newly diagnosed untreated myeloma and Eastern Cooperative Oncology Group performance status of 0 to 3 and were eligible for ASCT. Total RNA was isolated using standard methodology, as described in the supplemental Materials.
Identification of mutations and gene expression
Standard methods were used to identify mutations and determine gene expression. Detailed methodology is described in the supplemental Materials and supplemental Table 1. Briefly, reads were mapped with TopHat13 and aligned with Samtools.14 Single-nucleotide variants (SNVs) and small indels were identified using VarScan,15,16 and RNA fusions were identified using FusionCatcher.17 Read counts were generated with the Rsubread package.18,19 Raw and count-level data have been uploaded to Gene Expression Omnibus (GEO; GEO reference GSE116324). Differentially expressed genes were identified using DESeq2,20-22 and the Gage23 and Pathview24,25 packages were used for pathway analysis.
Machine learning
Selection of test data sets
Test RNA-seq data sets were derived from CoMMpass (https://research.themmrf.org/). Microarray test sets were obtained for relapsed/refractory patients treated with bortezomib26 (GEO reference GSE9782), plasma-cell leukemia (PCL) patients treated with RD27 (GEO reference GSE39925), and newly diagnosed myeloma patients treated with PAD followed by ASCT28 (GEO reference GSE19784). We refer to these data as the Millennium, PCL, and HOVON/GMMG data sets, respectively.
Data preprocessing, training, validation, and testing
RNA-seq counts were normalized and corrected for heteroscedasity according to published methods.29-35 Potential signature genes were identified from the PADIMAC data set by an empirical Bayes method,36 then selected as described using synthetic annealing,37 with an error rate determined by a support vector machine implemented from the e1071 package (https://cran.r-project.org/web/packages/e1071/index.html).
Signature assignments were made using the large margin nearest neighbor (LMNN) algorithm.38 Performance within the PADIMAC data set was checked by 10-fold cross-validation. For external testing, all PADIMAC data were used for training, with an initial 50:50 split into training and internal validation sets fixed for all testing. R and Matlab scripts replicating this process have been included with the supplemental Materials. All CoMMpass, Millennium, PCL, or HOVON/GMMG data were used for testing. To determine the robustness of the signature performance in each case, a form of permutation testing was used, as described in the supplemental Materials.
Statistical considerations
Null and observed assignments were compared using the Mann-Whitney-Wilcoxon test. Survival was compared using the Cox proportional hazards model. P values ≤.05 were considered significant.
Results
Initial assessment of PADIMAC data excludes a mutation-based classifier
We performed RNA-seq on purified CD138+ plasma cells from a cohort of 44 patients treated in the PADIMAC trial. Clinical data are shown in supplemental Table 2. We first explored the possibility of using a mutation-based classifier for bortezomib responsiveness. We identified fusion and SNV transcripts from the RNA-seq data (Figure 1A-B; supplemental Tables 3 and 4). There were 0 to 8 fusions in each sample, with a median of 1 (Figure 1A). Expected IgH-WHSC1 fusions were detected from t(4;14) patients (supplemental Table 3). There was a median of 9 SNVs per patient in coding regions, which is lower than seen in previous DNA sequencing studies.39-42 This may reflect reduced expression from mutant alleles43 as well as a failure to detect mutations in the furthest 5′ regions of some genes. Nevertheless, we identified many of the known driver mutations in myeloma (Figure 1B; supplemental Table 4). Other known drivers were not mutated in our cohort, which may be related to sample size or may reflect lack of expression of mutated alleles.43
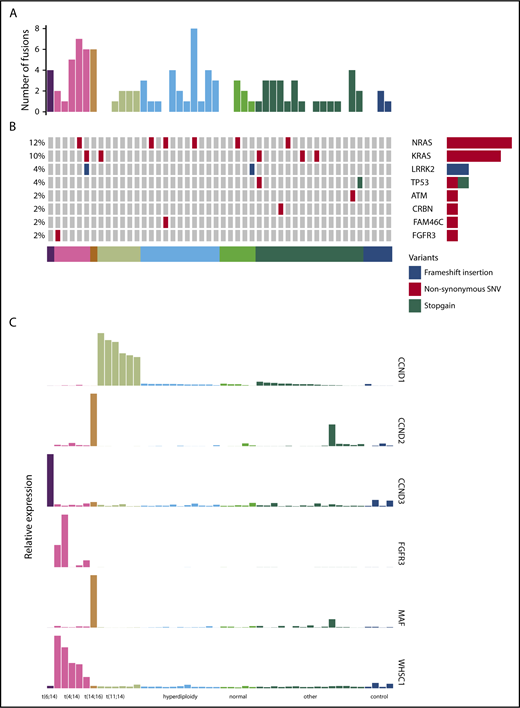
Fusion events, key SNVs, and translocation/cyclin D (TC) classification of PADIMAC data. Each column represents a single sample. Samples are arranged into and color coded by their TC classes (shown at the bottom). (A) Number of fusion events in each sample. (B) Key SNVs in each sample. (C) Expression of genes whose dysregulation is associated with TC classification in each sample.
Fusion events, key SNVs, and translocation/cyclin D (TC) classification of PADIMAC data. Each column represents a single sample. Samples are arranged into and color coded by their TC classes (shown at the bottom). (A) Number of fusion events in each sample. (B) Key SNVs in each sample. (C) Expression of genes whose dysregulation is associated with TC classification in each sample.
Overall, 45.5% of patients in the cohort achieved very good partial remission or better after PAD induction (supplemental Table 2). We defined a bortezomib-good group, namely patients who achieved very good partial remission or better and who were progression free at 1 year without ASCT (13 [29.5%] of 44). We termed the remaining patients bortezomib standard (31 [70.5%] of 44). There were no associations between these groups and age, International Staging System (ISS), or myeloma type (supplemental Table 5). We also saw no significant associations between bortezomib responsiveness and presence of key cytogenetic, SNV, or translocation events (supplemental Table 6). There were trends toward significant associations between the bortezomib-good group and both the presence of any translocation and the presence of a β2 microglobulin translocation (supplemental Table 6). However, we did not feel that these associations were sufficiently strong for predicting clinical outcomes. We therefore turned to expression profiling.
Derivation of a 7-gene bortezomib response signature
Expression of target genes known to be differentially expressed using microarray44 and quantitative polymerase chain reaction45 technologies in the translocation/cyclin D classification was consistent with that previously described (Figure 1C),44 confirming the utility of RNA-seq for measuring relative gene expression in myeloma. We therefore proceeded to identify a gene signature for bortezomib responsiveness. We ranked potential genes using synthetic annealing37 (supplemental Figures 1 and 2). Derived signatures comprising 4 to 11 genes performed better than permuted assignments in cross-validation of PADIMAC data using the LMNN algorithm (supplemental Figures 3 and 4; Matthews correlation coefficient [MCC]: median, 0.55 vs −0.045; Mann-Whitney U, 0; 2-tailed P = .00090; supplemental Figure 4A; F measure: median, 0.67 vs 0.25; Mann-Whitney U, 0; 2-tailed P = .00090; supplemental Figure 4B). Of these signatures, the best performing was the 7-gene signature (Figure 2A). Because training of the LMNN algorithm parameters involves splitting the training set into training and internal validation sets (supplemental Figure 2), we checked that the 7-gene signature was robust by performing multiple (n = 100) training/validation splits and comparing performance with permuted assignments (n = 100) during cross-validation. The observed assignments had higher MCCs and F measures than the null assignments (MCC: median, 0.50 vs 0.0054; Mann-Whitney U, 8; 2-tailed P = 2.85 × 10⁻³⁴; Figure 2B; F measure: median, 0.64 vs 0.26; Mann-Whitney U, 3; 2-tailed P = 2.42 × 10⁻³⁴; Figure 2C), confirming that the signature performed well regardless of the training/validation split.

A 7-gene signature accurately predicts response to bortezomib-based therapy in PADIMAC and the independent CoMMpass data sets. (A) MCCs and F measures of bortezomib-good assignments by 4 to 11 gene signatures derived from synthetic annealing after cross-validation within the PADIMAC data set. (B-C) MCCs and F measures of bortezomib-good assignments by the 7-gene signature after multiple (n = 100) cross-validations within the PADIMAC data set (signature) compared with the MCCs and F measures of permuted assignments (null). The P values are those of the Wilcoxon-Mann-Whitney test, under the null hypothesis that the distributions of observed and null performances are the same. (D) Kaplan-Meier plot showing the progression-free survival (PFS) of patients who received bortezomib-based therapy within CoMMpass (n = 147) and who were predicted to benefit (n = 39; broken line) or not (n = 108; solid line) from bortezomib-based therapy by the 7-gene signature after training in PADIMAC. The P value and hazard ratios (HRs) are those obtained from Cox regression analysis. (E) HRs for disease progression of bortezomib-good vs bortezomib-standard patients who received bortezomib-based therapy in CoMMpass. Predictions were made by the 7-gene signature, trained in PADIMAC, and followed repeated (n = 100) training/validation splits (signature). The HRs are compared with a null data set of HRs obtained after permutations of the assignments (null). The P value is that of the Wilcoxon-Mann-Whitney test, under the null hypothesis that the distributions of observed and null performances are the same.
A 7-gene signature accurately predicts response to bortezomib-based therapy in PADIMAC and the independent CoMMpass data sets. (A) MCCs and F measures of bortezomib-good assignments by 4 to 11 gene signatures derived from synthetic annealing after cross-validation within the PADIMAC data set. (B-C) MCCs and F measures of bortezomib-good assignments by the 7-gene signature after multiple (n = 100) cross-validations within the PADIMAC data set (signature) compared with the MCCs and F measures of permuted assignments (null). The P values are those of the Wilcoxon-Mann-Whitney test, under the null hypothesis that the distributions of observed and null performances are the same. (D) Kaplan-Meier plot showing the progression-free survival (PFS) of patients who received bortezomib-based therapy within CoMMpass (n = 147) and who were predicted to benefit (n = 39; broken line) or not (n = 108; solid line) from bortezomib-based therapy by the 7-gene signature after training in PADIMAC. The P value and hazard ratios (HRs) are those obtained from Cox regression analysis. (E) HRs for disease progression of bortezomib-good vs bortezomib-standard patients who received bortezomib-based therapy in CoMMpass. Predictions were made by the 7-gene signature, trained in PADIMAC, and followed repeated (n = 100) training/validation splits (signature). The HRs are compared with a null data set of HRs obtained after permutations of the assignments (null). The P value is that of the Wilcoxon-Mann-Whitney test, under the null hypothesis that the distributions of observed and null performances are the same.
The genes comprising the signature are EMC9, FAM171B, PLEK, MYO9B, RCN3, FLNB, and KIF1C (supplemental Table 7). We did not see enrichment of these genes within the pathway gene sets from the Molecular Signatures Database46-48 (http://software.broadinstitute.org/gsea/msigdb/annotate.jsp; C2 collection). However, at least 3 of the proteins (EMC9, RCN3, and KIF1C) are associated with the endoplasmic reticulum, and 3 others (PLEK, MYO9B, and FLNB) interact with actin filaments. Furthermore, 3 genes (EMC9, MYO9B, and KIF1C) associate positively with proliferation in myeloma.10 Despite the lack of objective pathway enrichment in our signature, supervised analysis of the RNA-seq data as a whole did reveal pathways upregulated in bortezomib-good patients (supplemental Table 8).
The 7-gene signature is predictive of outcome in bortezomib-treated patients in the independent CoMMpass data set
To enable testing of our signature in an independent external data set, we extracted RNA-seq data from CoMMpass. We selected previously untreated patients who did not proceed to ASCT, because none of the bortezomib-good patients had undergone transplantation. There were 147 such bortezomib-treated patients (who had received no IMiD), 40 RD patients, and 208 VRD patients for whom RNA-seq data were available (supplemental Tables 9-11). There were a few differences in clinical features between the groups. PADIMAC patients, being transplantation eligible, were younger than all the CoMMpass cohorts (supplemental Figures 5-7). VRD-treated patients in CoMMpass were younger than the bortezomib-treated and RD cohorts (supplemental Figures 9 and 10). RD-treated patients had higher rates of del13 than PADIMAC or bortezomib-treated patients and a lower rate of t(4;14) than bortezomib-treated patients (supplemental Figures 6 and 8). There were no differences in ISS stage between the groups (supplemental Figures 5-10).
We trained our 7-gene signature on the PADIMAC data and tested its ability to identify patients who would benefit from bortezomib-based therapy within CoMMpass (supplemental Figure 11). Patients who received bortezomib-based therapy and were assigned to the bortezomib-good group had a better PFS than those assigned to the bortezomib-standard group (Figure 2D; Table 1, row 1). The randomization seed for the PADIMAC training/validation split had been fixed before testing. To ensure that the predictive ability of the signature was robust, we performed multiple additional training/validation splits of the PADIMAC training set and compared the resulting assignments in the CoMMpass test set with permuted assignments that formed a null data set. As expected for a robust signature, HRs for the predicted bortezomib-good patients were lower than HRs from random predictions (Figure 2E; Table 2, row 1).
Cox regression results for survival comparisons
| Treatment (data set) | Comparison | n1 | n2 | Median survival 1, mo | Median survival 2, mo | HR* (CI) | P |
|---|---|---|---|---|---|---|---|
| Bortezomib based (C) | Bortezomib standard vs bortezomib good (PFS) | 108 | 39 | 21.9 | 36.2 | 0.37 (0.17-0.81) | .0063 |
| RD (C) | Bortezomib standard vs bortezomib good (PFS) | 29 | 11 | Not reached | 18.8 | 2.35 (0.76-7.63) | .16 |
| Bortezomib based or RD (C) | Incorrectly treated vs correctly treated (PFS) | 119 | 68 | 20.1 | Not reached | 0.40 (0.23-0.72) | .0012 |
| Bortezomib based or RD (C) | Incorrectly treated vs correctly treated (OS) | 119 | 68 | 30.7 | Not reached | 0.41 (0.21-0.80) | .0049 |
| Bortezomib based or RD or VRD (C) | All VRD vs all non-VRD (PFS) | 208 | 187 | 43.7 | 26.0 | 1.50 (1.06-2.13) | .02 |
| Bortezomib based or RD or VRD (C) | All VRD vs all non-VRD (OS) | 208 | 187 | Not reached | 37.8 | 2.05 (1.34-3.13) | .00084 |
| Bortezomib based or RD or VRD (C) | All VRD vs non-VRD correctly treated (OS) | 208 | 68 | Not reached | Not reached | 1.12 (0.58-2.13) | .74 |
| Bortezomib based or RD or VRD (C) | All VRD vs non-VRD correctly treated (PFS) | 208 | 68 | 43.7 | Not reached | 0.86 (0.50-1.47) | .57 |
| Bortezomib based ± ASCT | Bortezomib correctly treated vs ASCT (PFS) | 47 | 39 | 36.6 | 36.2 | 1.16 (0.47-2.87) | .75 |
| Bortezomib based ± ASCT | Bortezomib correctly treated vs ASCT (OS) | 47 | 39 | 43.7 | Not reached | 3.10 (0.80-12.01) | .08 |
| VRD (C) | Lenalidomide best vs bortezomib best (OS) | 164 | 44 | Not reached | Not reached | 1.41 (0.69-2.90) | .36 |
| VRD (C) | Lenalidomide best vs bortezomib best (PFS) | 164 | 44 | 43.7 | 45.4 | 1.11 (0.62-1.97) | .74 |
| Bortezomib alone (M) | Lenalidomide best vs bortezomib best (PFS) | 135 | 38 | 4.14 | 4.77 | 0.66 (0.43-1.0) | .04 |
| Bortezomib alone (M) | Lenalidomide best vs bortezomib best (OS) | 148 | 40 | 15.2 | 21.8 | 0.57 (0.53-0.91) | .01 |
| RD (PCL) | Lenalidomide best vs bortezomib best (PFS) | 8 | 10 | Not reached | 1.0 | Not defined† | 2.52 × 10⁻⁵ |
| RD (PCL) | Lenalidomide best vs bortezomib best (OS) | 8 | 10 | Not reached | 12.5 | Not defined† | .0013 |
| PAD/ASCT (H) | Lenalidomide best vs bortezomib best (PFS) | 84 | 57 | 26.6 | 31.8 | 0.91 (0.60-1.37) | .63 |
| PAD/ASCT (H) | Lenalidomide best vs bortezomib best (OS) | 85 | 58 | Not reached | Not reached | 0.73 (0.40-1.34) | .30 |
All signature assignments were based on the 7-gene signature. Correctly treated patients (rows 3, 4, and 7-10) were those predicted by the signature as lenalidomide best and who were treated with RD or those predicted as bortezomib best and treated with bortezomib-based therapy.
C, CoMMpass data set; CI, confidence interval; H, HOVON/GMMG data set; M, Millennium data set; n1, first group in comparison; n2, second group in comparison; OS, overall survival.
HR: second group vs first group.
HR for the PCL group is not defined because all patients in group 2 experienced progression before any progressions in group 1 (row 11) or because there were no deaths in group 1 (row 12).
Mann-Whitney-Wilcoxon results testing the robustness of the 7-gene signature to assignments
| Treatment (data set) | Comparison | Median HR* observed | Median HR* null | Mann-Whitney U | P |
|---|---|---|---|---|---|
| Bortezomib based (C) | Bortezomib standard vs bortezomib good (PFS) | 0.44 | 0.94 | 348 | 5.67 × 10⁻³⁰ |
| RD (C) | Bortezomib standard vs bortezomib good (PFS) | 2.01 | 0.93 | 1526 | 1.91 × 10⁻¹⁷ |
| Bortezomib based or RD (C) | Incorrectly treated vs correctly treated (PFS) | 0.48 | 0.92 | 185 | 5.44 × 10⁻³² |
| Bortezomib based or RD (C) | Incorrectly treated vs correctly treated (OS) | 0.46 | 0.85 | 3 | 2.52 × 10⁻³⁴ |
| Bortezomib alone (M) | Lenalidomide best vs bortezomib best (PFS) | 0.68 | 0.97 | 489 | 2.75 × 10⁻²⁸ |
| Bortezomib alone (M) | Lenalidomide best vs bortezomib best (OS) | 0.53 | 1.00 | 108 | 5.67 × 10⁻³³ |
| RD (PCL) | Bortezomib best vs lenalidomide best (PFS) | 0.24 | 0.83 | 1334 | 2.84 × 10⁻¹⁹ |
| RD (PCL) | Bortezomib best vs lenalidomide best (OS) | 0.20 | 0.96 | 1117 | 1.98 × 10⁻²¹ |
Mann-Whitney-Wilcoxon results testing the robustness of the 7-gene signature to assignments across multiple (n = 100) training/validation data splits; 100 assignments were made in each data set by the 7-gene signature after random training/validation splits (observed). Each of these assignments was then permuted to maintain assignment ratios (null). The performance of the observed and null assignments for predicting PFS and OS was compared in terms of HRs by the Mann-Whitney-Wilcoxon test.
C, CoMMpass data set; H, HOVON/GMMG data set; M, Millennium data set.
HR: second group vs first group.
The 7-gene signature has reciprocal performance in RD-treated patients and has the potential to select therapy
To distinguish between the signature acting as a general predictor of good-prognosis disease and as a specific predictor of bortezomib-sensitive disease, we tested it in RD-treated patients. We reasoned that, if the signature were bortezomib specific, the survival of RD-patients assigned to the bortezomib-good group would be no better than the survival of those assigned to the bortezomib-standard group. To our surprise, RD-treated patients assigned to the bortezomib-good group in fact had an inferior PFS to those assigned to the bortezomib-standard group (Figure 3A; Table 1, row 2). Although the difference was not significant, those assigned to the bortezomib-good group across repeated training/validation splits had consistently lower survival, with higher HRs than those obtained by permuting the assignments (Figure 3B; Table 2, row 2).

The 7-gene signature can be used as a classifier to select between bortezomib-based therapy and RD in the independent CoMMpass data set. (A) Kaplan-Meier plot showing the PFS of patients who received RD therapy (n = 40) within CoMMpass and who were predicted to benefit (n = 11; broken line) or not (n = 29; solid line) from bortezomib-based therapy by the 7-gene signature after training in PADIMAC. The P value and HR are those obtained from Cox regression analysis. (B) HRs for disease progression of bortezomib-good vs bortezomib-standard patients who received RD in CoMMpass. Predictions were made by the 7-gene signature, trained in PADIMAC, and followed repeated (n = 100) training/validation splits (signature). The HRs are compared with a null data set of HRs obtained after permutations of the assignments (null). The P value is that of the Wilcoxon-Mann-Whitney test, under the null hypothesis that the distributions of observed and null performances are the same. (C) Kaplan-Meier plot showing the PFS of patients who received bortezomib-based therapy or RD within CoMMpass (n = 187) and who received the correct (n = 68; broken line) or incorrect (n = 119; solid line) therapy predicted by the 7-gene signature after training in PADIMAC. The P value and HR are those obtained from Cox regression analysis. (D) Kaplan-Meier plot showing the OS of patients who received bortezomib-based therapy or RD within CoMMpass (n = 187) and who received the correct (n = 68; broken line) or incorrect (n = 119; solid line) therapy predicted by the 7-gene signature after training in PADIMAC. The P value and HR are those obtained from Cox regression analysis. (E) Kaplan-Meier plot showing the OS of patients (n = 276) who received VRD (n = 208; solid line) or who received bortezomib-based therapy or RD within CoMMpass and who received the correct therapy predicted by the 7-gene signature (n = 68; broken line) after training in PADIMAC. The P value and HR are those obtained from Cox regression analysis. (F) Kaplan-Meier plot showing the OS of patients who received VRD in CoMMpass (n = 208; solid line) and who were predicted to benefit from RD (n = 164; solid line) or from bortezomib-based therapy (n = 44; broken line) by the 7-gene signature after training in PADIMAC. The P value and HR are those obtained from Cox regression analysis.
The 7-gene signature can be used as a classifier to select between bortezomib-based therapy and RD in the independent CoMMpass data set. (A) Kaplan-Meier plot showing the PFS of patients who received RD therapy (n = 40) within CoMMpass and who were predicted to benefit (n = 11; broken line) or not (n = 29; solid line) from bortezomib-based therapy by the 7-gene signature after training in PADIMAC. The P value and HR are those obtained from Cox regression analysis. (B) HRs for disease progression of bortezomib-good vs bortezomib-standard patients who received RD in CoMMpass. Predictions were made by the 7-gene signature, trained in PADIMAC, and followed repeated (n = 100) training/validation splits (signature). The HRs are compared with a null data set of HRs obtained after permutations of the assignments (null). The P value is that of the Wilcoxon-Mann-Whitney test, under the null hypothesis that the distributions of observed and null performances are the same. (C) Kaplan-Meier plot showing the PFS of patients who received bortezomib-based therapy or RD within CoMMpass (n = 187) and who received the correct (n = 68; broken line) or incorrect (n = 119; solid line) therapy predicted by the 7-gene signature after training in PADIMAC. The P value and HR are those obtained from Cox regression analysis. (D) Kaplan-Meier plot showing the OS of patients who received bortezomib-based therapy or RD within CoMMpass (n = 187) and who received the correct (n = 68; broken line) or incorrect (n = 119; solid line) therapy predicted by the 7-gene signature after training in PADIMAC. The P value and HR are those obtained from Cox regression analysis. (E) Kaplan-Meier plot showing the OS of patients (n = 276) who received VRD (n = 208; solid line) or who received bortezomib-based therapy or RD within CoMMpass and who received the correct therapy predicted by the 7-gene signature (n = 68; broken line) after training in PADIMAC. The P value and HR are those obtained from Cox regression analysis. (F) Kaplan-Meier plot showing the OS of patients who received VRD in CoMMpass (n = 208; solid line) and who were predicted to benefit from RD (n = 164; solid line) or from bortezomib-based therapy (n = 44; broken line) by the 7-gene signature after training in PADIMAC. The P value and HR are those obtained from Cox regression analysis.
The implication of these findings is that patients predicted to do well with bortezomib by our signature do poorly when treated with RD and vice versa. Hence, the 7-gene signature could be used as a binary classifier to rationally choose between bortezomib-based therapy and RD. To test this, we selected CoMMpass patients treated with bortezomib-based therapy or with RD and assigned each to a bortezomib-best or lenalidomide-best group. We then compared survival between those patients who received the predicted best treatment and those who did not. Patients who received the correct therapy had a superior PFS (Figure 3C; Table 1, row 3) and OS (Figure 3D; Table 1, row 4). The incorrectly treated patients had a median PFS of 20.1 months and a median OS of 31.2 months, whereas the median PFS and OS were not reached for correctly treated patients. These predictions were again robust to the initial training/validation split of the PADIMAC data set (supplemental Figure 12; Table 2, rows 3 and 4).
We excluded the possibility that the signature was acting as a surrogate for clinical features. We saw no association between signature assignment and key cytogenetic events (P = .13; Fisher’s exact test; supplemental Table 12), and in multivariate Cox regression, ideal treatment according to the signature retained significance for survival when age, ISS, or myeloma subtype were taken into account (supplemental Table, 13 rows 1 and 2).
Because of the finding of proliferative genes in our signature, we also wanted to check that it was not acting as a surrogate for the gene expression–based proliferation index (GPI50) signature10 or other prognostic signatures. Because these signatures have not, to our knowledge, been applied to RNA-seq data previously, we first tested that they could be applied to the CoMMpass data set. Indeed, when all of the GPI50, University of Arkansas for Medical Sciences (UAMS70), Erasmus University Medical Centre (EMC92), and Intergroupe Francophone du Myélome (IFM15) signatures4-6,10 were applied to CoMMpass, the distribution of scores was similar to that seen in microarray data sets5 (supplemental Figure 13A,C,E,G). Furthermore, all signatures retained prognostic significance using thresholds equivalent to those previously published5 (supplemental Figure 13B,D,F,H). Having established that these prognostic signatures were effective in RNA-seq data, we examined whether there was any association between their assignments and the assignments of our 7-gene signature. None was seen (supplemental Table 14). Furthermore, receiving ideal treatment according to the 7-gene signature retained its prognostic significance even in a multivariate analysis including these signatures (supplemental Table 15).
A recent trial reported the superiority of VRD over RD in transplantation-ineligible patients,3 but VRD treatment is not currently funded widely outside the United States. We wondered whether rationally selected therapy could be a cost-effective alternative to this gold-standard treatment. We first demonstrated that VRD was superior to unselected bortezomib-based treatment and RD in CoMMpass (supplemental Figure 14; Table 1, rows 5 and 6). We then compared the survival of patients treated correctly according to our signature with the survival of all patients treated with VRD in CoMMpass. There was no statistically significant difference in OS (Figure 3E; Table 1, row 7) or PFS (supplemental Figure 15A; Table 1, row 8) between patients treated correctly with bortezomib or RD and those treated with VRD. This was also true in a multivariate analysis incorporating clinical features (supplemental Table 13, rows 3 and 4). We also compared the outcomes of CoMMpass patients treated correctly with bortezomib according to the signature (without transplantation) with those of all patients receiving bortezomib-based induction followed by ASCT. Interestingly, there was no significant difference in survival between the 2 groups (supplemental Figure 16; Table 1, rows 9 and 10), although there was weak evidence of an effect implying longer OS with transplantation.
We hypothesized that the 7-gene signature should have minimal predictive ability in VRD-treated patients. As expected, we saw no difference between the outcomes for patients assigned to the bortezomib-best or lenalidomide-best group when those patients were treated with VRD. This was true both for OS (Figure 3F; Table 1, row 11) and for PFS (supplemental Figure 15B; Table 1, row 12). This lack of predictive ability was also seen in multivariate analyses incorporating clinical features (supplemental Table 13, rows 5 and 6).
The 7-gene signature performs well in other independent data sets
We were keen to test how our signature would perform in other nontransplantation settings, such as relapsed disease. However, being limited by the availability of publicly available RNA-seq data, we turned to microarray data. There were 2 suitable data sets available. One comprised samples from patients with relapsed/refractory myeloma treated with single-agent bortezomib26 (the Millennium data set). The second contained transcriptomic data from a small series of patients with PCL treated with RD27 (the PCL data set). We reasoned that, within the Millennium data set, patients assigned to the bortezomib-best class should have a better survival, whereas within the PCL data set, those assigned to the lenalidomide-best class should have a superior outcome.
Signature assignments behaved as predicted. In the Millennium data set, the bortezomib-best group had a superior PFS (Figure 4A; Table 1, row 13) and OS (Figure 4B; Table 1, row 14) compared with the lenalidomide-best group. These results were robust to training/validation splits (Figure 4C; Table 2, rows 5 and 6). In the PCL data set, those predicted to be in the lenalidomide-best group had a superior PFS (Figure 4D; Table 1, row 15) and OS (Figure 4E; Table 1, row 16) compared with patients assigned to the bortezomib-best group. Again, the signature was robust, with little influence from the training/validation split (Figure 4F; Table 2, rows 7 and 8).

The 7-gene signature accurately predicts bortezomib or lenalidomide responsiveness in further independent data sets. (A) Kaplan-Meier plot showing the PFS of patients who received single-agent bortezomib within the Millennium studies (n = 173) and who were predicted to benefit from bortezomib-based therapy (n = 38; broken line) or from RD therapy (n = 135; solid line) by the 7-gene signature after training in PADIMAC. The P value and HR are those obtained from Cox regression analysis. (B) Kaplan-Meier plot showing the OS of patients who received single-agent bortezomib within the Millennium studies (n = 188) and who were predicted to benefit from bortezomib-based therapy (n = 40; broken line) or RD therapy (n = 148; solid line) by the 7-gene signature after training in PADIMAC. The P value and HR are those obtained from Cox regression analysis. (C) HRs for PFS and OS of patients predicted to benefit from bortezomib-based therapy who received bortezomib in the Millennium studies. Predictions were made by the 7-gene signature, trained in PADIMAC with repeated (n = 100) training/validation splits (signature). The HRs are compared with a null data set of HRs obtained after permutations of the assignments (null). The P values are those of the Wilcoxon-Mann-Whitney test, under the null hypothesis that the distributions of observed and null performances are the same. (D) Kaplan-Meier plot showing the PFS of patients who received RD within the PCL study (n = 18) and who were predicted to benefit (n = 8; solid line) or not (n = 10; broken line) from RD therapy by the 7-gene signature after training in PADIMAC. The P value is that obtained from Cox regression analysis. (E) Kaplan-Meier plot showing the OS of patients who received RD within the PCL study (n = 18) and who were predicted to benefit (n = 8; solid line) or not (n = 10; broken line) from RD therapy by the 7-gene signature after training in PADIMAC. The P value is that obtained from Cox regression analysis. (F) HRs for PFS and OS of patients predicted to benefit from lenalidomide-based therapy and who received RD in the PCL study. Predictions were made by the 7-gene signature, trained in PADIMAC with repeated (n = 100) training/validation splits (signature). The HRs are compared with a null data set of HRs obtained after permutations of the assignments (null). The P value is that of the Wilcoxon-Mann-Whitney test, under the null hypothesis that the distributions of observed and null performances are the same.
The 7-gene signature accurately predicts bortezomib or lenalidomide responsiveness in further independent data sets. (A) Kaplan-Meier plot showing the PFS of patients who received single-agent bortezomib within the Millennium studies (n = 173) and who were predicted to benefit from bortezomib-based therapy (n = 38; broken line) or from RD therapy (n = 135; solid line) by the 7-gene signature after training in PADIMAC. The P value and HR are those obtained from Cox regression analysis. (B) Kaplan-Meier plot showing the OS of patients who received single-agent bortezomib within the Millennium studies (n = 188) and who were predicted to benefit from bortezomib-based therapy (n = 40; broken line) or RD therapy (n = 148; solid line) by the 7-gene signature after training in PADIMAC. The P value and HR are those obtained from Cox regression analysis. (C) HRs for PFS and OS of patients predicted to benefit from bortezomib-based therapy who received bortezomib in the Millennium studies. Predictions were made by the 7-gene signature, trained in PADIMAC with repeated (n = 100) training/validation splits (signature). The HRs are compared with a null data set of HRs obtained after permutations of the assignments (null). The P values are those of the Wilcoxon-Mann-Whitney test, under the null hypothesis that the distributions of observed and null performances are the same. (D) Kaplan-Meier plot showing the PFS of patients who received RD within the PCL study (n = 18) and who were predicted to benefit (n = 8; solid line) or not (n = 10; broken line) from RD therapy by the 7-gene signature after training in PADIMAC. The P value is that obtained from Cox regression analysis. (E) Kaplan-Meier plot showing the OS of patients who received RD within the PCL study (n = 18) and who were predicted to benefit (n = 8; solid line) or not (n = 10; broken line) from RD therapy by the 7-gene signature after training in PADIMAC. The P value is that obtained from Cox regression analysis. (F) HRs for PFS and OS of patients predicted to benefit from lenalidomide-based therapy and who received RD in the PCL study. Predictions were made by the 7-gene signature, trained in PADIMAC with repeated (n = 100) training/validation splits (signature). The HRs are compared with a null data set of HRs obtained after permutations of the assignments (null). The P value is that of the Wilcoxon-Mann-Whitney test, under the null hypothesis that the distributions of observed and null performances are the same.
The 7-gene signature loses predictive power in patients proceeding to ASCT
The bortezomib-good patients in the PADIMAC training set avoided ASCT because of their good response, according to trial protocol. We had thus far confined testing in external data sets to patients who had not undergone ASCT. We wondered whether the signature would retain its predictive power in patients proceeding to ASCT or whether transplantation would overcome the survival differences between correctly and incorrectly treated patients. The HOVON-64/GMMG-HD4 phase 3 trial49 compared patients with newly diagnosed myeloma treated with conventional chemotherapy vs those treated with PAD. Both groups of patients proceeded to ASCT.
We used our signature to make bortezomib-best and lenalidomide-best assignments in patients who had received PAD. We reasoned that, if the signature retained its predictive power in the ASCT setting, we would see superior survival in those patients assigned to the bortezomib-best group. However, this was not the case, and we saw no significant difference in either PFS (Figure 5A; Table 1, row 17) or OS (Figure 5B; Table 1, row 18) between the different signature assignments.

The 7-gene signature loses predictive ability in the transplantation setting. (A) Kaplan-Meier plot showing the PFS of patients who received PAD within the HOVON-65/GMMG-HD4 study (n = 143) before ASCT and who were predicted to benefit from bortezomib-based therapy (n = 58; broken line) or from RD therapy (n = 85; solid line) by the 7-gene signature after training in PADIMAC. The P value and HR are those obtained from Cox regression analysis. (B) Kaplan-Meier plot showing the OS of patients who received PAD within the HOVON-65/GMMG-HD4 study (n = 143) before ASCT and who were predicted to benefit from bortezomib-based therapy (n = 58; broken line) or RD therapy (n = 85; solid line) by the 7-gene signature after training in PADIMAC. The P value and HR are those obtained from Cox regression analysis.
The 7-gene signature loses predictive ability in the transplantation setting. (A) Kaplan-Meier plot showing the PFS of patients who received PAD within the HOVON-65/GMMG-HD4 study (n = 143) before ASCT and who were predicted to benefit from bortezomib-based therapy (n = 58; broken line) or from RD therapy (n = 85; solid line) by the 7-gene signature after training in PADIMAC. The P value and HR are those obtained from Cox regression analysis. (B) Kaplan-Meier plot showing the OS of patients who received PAD within the HOVON-65/GMMG-HD4 study (n = 143) before ASCT and who were predicted to benefit from bortezomib-based therapy (n = 58; broken line) or RD therapy (n = 85; solid line) by the 7-gene signature after training in PADIMAC. The P value and HR are those obtained from Cox regression analysis.
As a further check for the specificity of the signature, we also tested its predictive value in the dexamethasone-only arm. As anticipated, there was no difference in PFS between those patients predicted to be bortezomib good and those predicted to be lenalidomide good (supplemental Figure 17A). However, patients predicted to be bortezomib good had a superior OS in this arm (supplemental Figure 17B). This is likely because patients receiving dexamethasone were eligible to receive crossover bortezomib upon disease progression.
Discussion
If it can be realized, precision cancer medicine will benefit patients in terms of improved efficacy and reduced toxicity and will benefit society in terms of better management of limited drug budgets. Transcriptomics has considerable promise in this area.50 There are signatures that predict for overall prognosis in cancer,51-62 including myeloma,4-12 and signatures that predict response to individual therapies.63-67 However, we are not aware of any published signature that can be used to rationally select between different active cancer therapies. Remarkable improvements in myeloma outcome over recent years have been seen thanks to the introduction of multiple novel agents, but this has been associated with increasing costs of treatment.68 Therefore, precision medicine is arguably of particular importance in this disease to help navigate through the increasing armamentarium of available therapies.
Here, we describe the derivation and testing of a 7-gene signature that can be used to select between bortezomib-based or RD therapy in myeloma patients not undergoing ASCT. Patients treated correctly according to the signature in the CoMMpass data set had a 69.7% 3-year OS, similar to the outcome of patients treated with VRD, probably the current standard of care for transplantation-ineligible patients.3 These comparisons have to be viewed with caution, because CoMMpass is not a clinical trial. Nevertheless, there was no evidence that VRD-treated patients represented a poor-prognosis cohort in CoMMpass; there were no significant differences between the rates of poor-risk cytogenetics or ISS in the VRD group and the bortezomib- or RD-treated group, and noninferior survival was maintained in a multivariate model incorporating ISS.
If the outcome with rationally selected bortezomib- or lenalidomide-based therapy is equivalent to that with VRD, it would be important to consider why this might be. It may be that many patients treated with VRD are predominantly benefiting from just the bortezomib or the lenalidomide. Alternatively, it might be that any gains in combining the drugs are offset by increased toxicity, particularly in older or frailer patients. It is important to note that the reciprocal performance that we observed is an intrinsic property of the signature and not simply because bortezomib sensitivity is automatically associated with lenalidomide resistance (and vice versa). This is clearly not the case in clinical practice, nor is it consistent with the existence of multiple treatment-agnostic prognostic signatures in myeloma.
Although PADIMAC was a trial for transplantation-eligible patients, the signature was trained on patients who had had a good response in the absence of ASCT. Therefore, our initial test set comprised patients who were transplantation ineligible (there were no data sets from transplantation-eligible patients who did not proceed to transplantation). Transplantation-ineligible patients would be the most obvious to benefit after successful translation of the signature to the clinic. When tested in transplantation-eligible patients who had received PAD and ASCT in the HOVON-64/GMMG-HD4 trial, the signature lost its predictive ability, implying that transplantation can overcome the effect of not receiving the correct treatment. An interesting question would be whether receiving the correct predicted treatment without transplantation is equivalent to ASCT. We saw no survival difference between transplantation-ineligible patients treated correctly with bortezomib and all transplantation-eligible patients treated with bortezomib followed by ASCT. However, there was weak evidence of an effect suggesting better OS for patients who underwent transplantation.
There are limitations of our signature that need to be overcome before employment in a clinical trial. The signature assigns approximately one quarter to one third of patients to the bortezomib-best group and the remainder to the lenalidomide-best group by default. It may be that this larger group is heterogeneous, with some patients having poorer prognosis or multiclonal disease and thus requiring VRD or the addition of other novel agents. Others may benefit equally from bortezomib- or lenalidomide-based treatments, regardless of signature assignment. Our signature was not capable of identifying these different groups (data not shown). Our external test cohorts were fairly small because of the lack of publicly available and appropriate test data sets, and prospective validation of our signature will be needed. This will probably require the development of a quantitative polymerase chain reaction or focused sequencing panel, although the small number of genes in the signature means that this should be feasible. Finally, it is not clear to what extent our signature represents a drug effect or a class effect, because of the lack of publicly available test data sets involving patients treated with alternative PIs or IMiDs. Future data may become available from clinical trials in which expression profiling is incorporated into the protocol.
We believe that our signature has the potential to move the myeloma field toward rational therapy decisions for transplantation-ineligible patients in the future. It is essential that myeloma genomic data sets with relevant clinical outcome data continue to be made publicly available to allow refinement and prospective validation of these approaches. This will require the ongoing support of the myeloma research community.
The online version of this article contains a data supplement.
The publication costs of this article were defrayed in part by page charge payment. Therefore, and solely to indicate this fact, this article is hereby marked “advertisement” in accordance with 18 USC section 1734.
Acknowledgments
The authors thank the patients and their physicians who participated in the PADIMAC and CoMMpass studies and are extremely grateful to the reviewers for their comments and suggestions, which have undoubtedly strengthened the paper.
The PADIMAC trial was funded by a Leukaemia and Lymphoma Research (now Bloodwise) grant (LRF/10018) and a University College London Biomedical Research Centres grant. It was managed by the Cancer Research UK and University College London Cancer Trials Centre. It was overseen by the National Cancer Research Institute Haemato-oncology Clinical Study Group. J.A. was funded by the Cancer Research UK–University College London Centre Award (C416/A18088 and C416/A25145). M.A.C. is a Wellcome-Beit Intermediate Fellow. PADIMAC was also funded in part by research funding from Janssen to the following authors: J.D.C., M.J.S., S.S., M.K., F.W., A.E.V., J.C., M.F.Q., G.C., C.R.C., G.P., R.G.O., and K.Y.
Authorship
Contribution: M.A.C., J.S., J.A., C.R., R.P., J.J.K., J.H., and K.W. conceived the present study and performed data analysis; and all authors contributed to data collection and writing of the manuscript.
Conflict-of-interest disclosure: Alexion: honoraria (M.K.). Amgen: travel bursaries (G.C.), advisory role/consultancy (K.Y.), honoraria (R.P., G.P., K.Y.), speaker’s bureau (G.C.), and research (F.W., G.C., L.C.-H., K.Y.). Autolus: advisory role/consultancy (K.Y.). Bayer: honoraria (J.C.). Celgene: travel bursaries (C.R., R.P., F.W., G.C., R.G.O.), advisory role/consultancy (R.G.O.), honoraria (G.P., R.G.O.), speaker’s bureau (M.J.S., G.C., G.P.), and research (K.Y.). Chugai: advisory role/consultancy (K.Y.) and research (K.Y.). Gilead: travel bursaries (J.J.K.), honoraria (M.K., G.P.) and speaker’s bureau (M.K., G.P.). Janssen: travel bursaries (G.C., G.P.), advisory role/consultancy (R.P., M.J.S., G.C., R.G.O., K.Y.), honoraria (M.A.C., R.P., M.F.Q., G.C., G.P., R.G.O., K.Y.), and speaker’s bureau (M.J.S., G.C., G.P., K.Y.). Novartis: travel bursaries (A.E.V.). Pfizer: travel bursaries (J.C.), honoraria (A.E.V.), and research (L.C.-H.). Sanofi: travel bursaries (G.C.) and speaker’s bureau (G.C.). Seattle Genetics: advisory role/consultancy (G.C.). Takeda: travel bursaries (M.A.C., G.C., G.P.), advisory role/consultancy (R.P., G.C., K.Y.), honoraria (M.A.C., R.P., R.G.O., G.C., G.P., K.Y.), speaker’s bureau (G.C., G.P.), and research (G.C.). The remaining authors declare no competing financial interests.
Correspondence: Michael A. Chapman, Department of Haematology, University of Cambridge, NHS Blood and Transplant, Long Rd, Cambridge CB2 0PT, United Kingdom; e-mail: mac54@cam.ac.uk.

This feature is available to Subscribers Only
Sign In or Create an Account Close Modal