

Key Points
Different metabolic pathways are involved in intracellular metabolic reprogramming depending on the genetic characteristics of AML cells.
Leukemic progenitors activate different programs of the metabolism, depending on their levels of differentiation blockade.

Abstract
Leukemic cells display some alterations in metabolic pathways, which play a role in leukemogenesis and in patients’ prognosis. To evaluate the characteristics and the impact of this metabolic reprogramming, we explore the bone marrow samples from 54 de novo acute myeloid leukemia (AML) patients, using an untargeted metabolomics approach based on proton high-resolution magic angle spinning-nuclear magnetic resonance. The spectra obtained were subjected to multivariate statistical analysis to find specific metabolome alterations and biomarkers correlated to clinical features. We found that patients display a large diversity of metabolic profiles, according to the different AML cytologic subtypes and molecular statuses. The link between metabolism and molecular status was particularly strong for the oncometabolite 2-hydroxyglutarate (2-HG), whose intracellular production is directly linked to the presence of isocitrate dehydrogenase mutations. Moreover, patients’ prognosis was strongly impacted by several metabolites, such as 2-HG that appeared as a good prognostic biomarker in our cohort. Conversely, deregulations in phospholipid metabolism had a negative impact on prognosis through 2 main metabolites (phosphocholine and phosphoethanolamine), which could be potential aggressiveness biomarkers. Finally, we highlighted an overexpression of glutathione and alanine in chemoresistant patients. Overall, our results demonstrate that different metabolic pathways could be activated in leukemic cells according to their phenotype and maturation levels. This confirms that metabolic reprogramming strongly influences prognosis of patients and underscores a particular role of certain metabolites and associated pathways in AML prognosis, suggesting common mechanisms developed by leukemic cells to maintain their aggressiveness even after well-conducted induction chemotherapy.
Introduction
Acute myeloid leukemia (AML) consists of a set of malignant proliferations that lead to immature myeloid progenitor cells, which have completely or partially lost their differentiation capacity and get accumulated in the bone marrow, peripheral blood, and potentially, in other organs. The incidence is about 3 to 8 cases/100 000 per year in the world.1 Historically, AML has several subtypes according to French-American-British (FAB) classification (M0-M7), representing clonal expansion of malignant hematopoietic cells blocked at distinct differentiation stages along with different lineages.2
Despite the considerable progress in the understanding of the genetic characteristics of AML, we need to go further in the characterization of leukemic cells. Indeed, the main treatment of AML is still based on chemotherapy using a combination of cytosine arabinoside and anthracycline. These drugs have been used as a standard of care for nearly 40 years,3 but the 5-year survival remains about 35% in patients less than 60 years of age,4 conferring to this malignant blood disease a real adverse prognosis. Therefore, new approaches are warranted to better define the prognosis of the patients at diagnosis and to develop drugs targeting mechanism of leukemic initiation and progression.
Mutated genes and/or chromosomal aberrations have been long shown to affect some processes, including signaling pathways or cell differentiation. Subsequently, genetic modifications that induce alterations in epigenetic control of gene expression, RNA splicing, or regulation of immune response have been described.5 Indeed, a part of the immunosuppression in AML may be directed by genetic aberrations and simultaneously by some metabolites.6 In addition, and in complement to these functional alterations, metabolic reprogramming was determined to be a major contributor to the leukemic process.
In a general way, cancer cells are characterized by a quick and uncontrolled proliferation and had a reduced/altered dependence to external stimuli. To supply cells in nutrients and energy needed for their growth and division, several mechanisms are involved. Beyond the Warburg effect, which allows introducing the concept of the metabolic reprogramming, other metabolic pathways are strongly altered in cancers. In AML, the leukemic cells produce reactive oxygen species (ROS), which could promote blast proliferation.7 Particularly, it seems that the aggressiveness and poor prognosis linked with FMS-like tyrosine kinase 3-internal tandem duplication (FLT3-ITD) AML are because of the increase in endogenous ROS.8 The leukemic cells could have a high oxidative phosphorylation activity, associated to the chemoresistance.9 Our team recently showed that de novo AML patients had a deregulated redox balance, which was linked to their molecular status and played a major role in their prognosis.10 Isocitrate dehydrogenase (IDH) mutations provide a significant example of the link between metabolism and leukemogenesis.11 These mutations play a crucial role in the modification of energetic metabolism in leukemic cells and in deregulation of ROS production, generating 2-hydroxyglutarate (2-HG) instead of α-ketoglutarate (α-KG) when the gene is mutated.12 Moreover, glutamine (Gln) is particularly involved in metabolic reprogramming. The leukemic cells use this metabolite as a carbon source for energy production through the tricarboxylic acid (TCA) cycle and redox homeostasis. Also, Gln is an important metabolite for glutathione (GSH) synthesis, making it an essential element in the redox balance control in AML. The link between glutaminolysis and TCA cycle activity appears to be essential in cell survival,13 because Gln is a source of α-KG, which can be converted into 2-HG by IDH mutants.14
In this context of deregulated metabolism in leukemic cells, high-resolution magic angle spinning-nuclear magnetic resonance (HRMAS-NMR) is particularly well suited for metabolomics investigations because it is highly robust, reproducible, and nondestructive. This method is well appropriated to semisolid sample analysis and allows us to be close to in vivo conditions. Moreover, the HRMAS method is very rapid and allows the direct analysis of the samples, without the need for a prior step of chemical extraction of metabolites,15 which helps avoid some bias. Limited NMR or mass spectrometry–based metabolomics studies on AML patients have already been carried out. Wang et al16 and Musharraf et al17 have shown significant metabolic differences between AML patients and healthy subjects involving aberrant metabolic pathways such as TCA cycle, glycolysis, or fatty acid metabolism. More recently, another team has found a noninvasive serum metabolite biomarker panel for the detection of AML.18 In our study, we used HRMAS-NMR to show that, in the basal state, human leukemia cell lines exhibit a specific metabolic signature related to the diversity of AML subtypes represented and their phenotypes. Moreover, when cultured in a serum-free medium, they showed quick metabolic adaptation and continued to proliferate and survive despite the lack of nutrients.19
In the present study, using the same method, we aimed to better characterize metabolic pathways deregulated in leukemic cells to find discriminant metabolites correlated to the prognosis of de novo adult AML at diagnosis. In a prospective study, we investigated the metabolic profiles of AML patients and explored their different metabolic specificities, according to the different FAB subtypes of AML used as markers of the cellular differentiation, the European Leukemia Net (ELN) prognostic group, the molecular statuses (NPM1 [nucleophosmin 1], FLT3-ITD, and IDH mutations), the status of different immunologic markers studied by flow cytometry, and the response to the chemotherapy induction. We thus established a list of discriminant metabolites having a positive or negative correlation with AML prognosis. In this way, we identified some clues to aid therapeutic decisions and directly target the altered metabolic pathways in AML.
Materials and methods
Patient inclusion and sample collection
Fifty-four patients were recruited between June 2016 and December 2019 from Grenoble-Alpes University Hospital, in accordance with the ethical standards and the Declaration of Helsinki. The selection criteria were the diagnosis of de novo AML with bone marrow blasts higher than 20% and age above 18 years old. The patients with secondary AML or acute promyelocytic leukemia were not included in this study. The bone marrow samples were collected in BD Vacutainer tubes before chemotherapy induction. All patients received a standard 7 + 3 scheme of induction.
HRMAS-NMR–based metabolomics
Sample preparation.
Bone marrow samples were pretreated and mononuclear cells were isolated by the Ficoll gradient. The cells were suspended in few microliters of cold deuterated phosphate-buffered saline and transferred into an insert for MAS rotor (total volume, 30 µL), which were stored at −80°C until acquisition by HRMAS-NMR. One to 3 inserts per patient were prepared (depending on available sample).
Acquisition parameters.
All the 1H NMR experiments were performed using a Bruker 500 Avance III spectrometer (IRMaGE, CEA-Grenoble). Just before acquisition, the sample was inserted into a 4-mm zirconium rotor, which was immediately transferred to the magnet. The MAS spin rate was set to 4000 Hz and sample temperature to 277 K. A Car-Purcell-Meiboom-Gilles (CPMG) acquisition sequence was used to attenuate the signal from the lipids and macromolecules present in the sample (total echo time, 30 ms). Each acquisition lasted 17 minutes.
Preprocessing of spectra.
All the HRMAS-NMR spectra were corrected for phase using Topspin (v3.5, Bruker Biospin). All further preprocessing steps (baseline correction, chemical shift alignments) and bucketing were performed using NMRProcFlow 1.2 Online (https://nmrprocflow.org/). The spectral region between 0.8 and 8.7 ppm was divided into buckets with an equal width of 0.001 ppm. The regions δ 4.6 to 5.3, δ 3.35 to 3.40, δ 3.65 to 3.75, δ 3.79 to 3.93, and δ 3.95 to 4.03 were discarded to eliminate the residual water peak and to remove the pollution signal, corresponding to the peaks of a polyethylene glycol component. Each bucket was normalized to the total sum of buckets. The peak assignment was based on 2-dimensional (2D) experiments (heteronuclear single quantum coherence [HSQC] and total correlated spectroscopy [TOCSY]), databases (eg, HMD Human Metabolome Database), and the literature.
Statistical analysis
Multivariate analyses were conducted using the SIMCA 16.1 software (Umetrics). The orthogonal projection to latent structure with discriminant analysis (OPLS-DA) models were built with HRMAS-NMR data and from which subgroup (or patient subtype) data originated, depending on the condition studied or the patient subgroup analyzed. The total number of components was determined using the cross-validation procedure, which produces the R2Y and Q2 factors that indicate, respectively, the goodness of the fit and predictability of the model. A model is considered as robust and predictive when both are ≥0.5. The scores were plotted in 2D with the first 2 components, whereas the loadings were plotted in 1D to mimic a spectrum. Furthermore, each NMR variable was color-coded according to the statistical signification of the correlation among the groups, with a hot colored (eg, red) metabolite being more significant than a cold colored (eg, blue) one. Metabolites with correlation >0.5 were considered for further univariate analyses. Moreover, univariate statistics (Student t tests, 2-way analysis of variance, and survival analysis) were conducted with GraphPad Prism (supplemental Methods).
Immunophenotyping by flow cytometry
Bone marrow aspirate was collected in BD Vacutainer tubes for routine analysis. The sample was analyzed within 8 hours after the aspiration. The cells were numerated using the ABX MICROS 60 (HORIBA ABX SAS, Montpellier, France) cell counter. Then, the following antibodies were tested on all patient samples: CD34-APC-A750 (581; Ref B92463; Beckman Coulter), MPO-PE (Kit CD3/MPO/CD79a; 5B8; Ref 333164; BD Biosciences), CD14-V450 (MφP9; Ref 560349; BD Biosciences), CD300e-APC (UP-H2; Ref 130-101-773; Miltenyi Biotec), CD117-APC (104D2; Ref 333233; BD Biosciences), CD133-PE (AC133; Ref 130-080-801; Miltenyi Biotec), and CD45-V500 (HI30; Ref 560777, BD Biosciences). The cells were stained by direct immunofluorescence for 15 minutes in the dark at room temperature. After this incubation, the erythrocytes were lysed, and the samples were washed with BD FACS lysing solution (Ref 349202; BD Biosciences) and phosphate-buffered saline, respectively. The analyses of the samples were performed on a FACSCanto-II flow cytometer with 3 lasers and 8 colors (BD Biosciences). Finally, the data were analyzed using BD FACSDiva Software v6 (BD Biosciences). Blast cells were identified by CD45/SSC gating, as these cells are CD45low. This gating procedure improved the phenotypic determination of the leukemic clone.
Results
Patients’ characteristics
At diagnosis, the median age was 62 years, with a sex ratio of 1.7, indicating a masculine predominance. The leukocytosis was variable, with patients having a leukocyte rate in peripheral blood between 4 and 30 103/µL predominantly. AML subtypes were defined according to the FAB classification. The most represented subtype was M2 (43% of the patients), whereas the least represented subtype was M0 (6% of the patients). Concerning the blast percentage in bone marrow, 16 patients had more than 80%, 11 between 60% and 80%, 14 between 40% and 60%, and 13 between 20% and 40% of bone marrow blasts. Prognostic groups were defined according ELN risk stratification, favorable, adverse, and intermediate, based on their karyotypes and associated mutations. AML patients (n = 54) were divided into the 3 risk subgroups: favorable (n = 21), adverse (n = 18), and intermediate (n = 15). Three genetic abnormalities were studied in our cohort: NPM1, FLT3-ITD, and IDH (pooled as IDH1 and IDH2 mutations). Thirty-one percent of the patients were NPM1 mutated, 24% were FLT3 duplicated, and 24% were IDH mutated. Other mutations needed to establish the prognostic risk of patients according to the ELN classifications are shown in supplemental Table 1. Finally, the response to the chemotherapy treatment was evaluated. The patients were considered as chemoresistant in absence of response to the first induction of chemotherapy after 1 month. Thirty-one patients were chemosensitive, and 7 were chemoresistant (supplemental Table 1).
Patients from different AML FAB subtypes display different metabolic profiles
The metabolites identified in the 1H HRMAS-NMR spectra of cells are presented in supplemental Table 2. As shown in Figure 1A, on the score plot of the OPLS-DA model built, some patients seemed to display common metabolic characteristics while a general tendency to scattering was observed (Figure 1A). This may be because of the presence of 2-HG in high quantity, because IDH mutation was evenly distributed in all AML subtypes. Therefore, when excluding IDH-mutated patients (Figure 1B), the OPLS-DA model was much more robust, and a clear separation of the profiles according to the cellular differentiation was found. This result has been confirmed by excluding the 2-HG peak in the statistical model of Figure 1A (supplemental Figure 1).
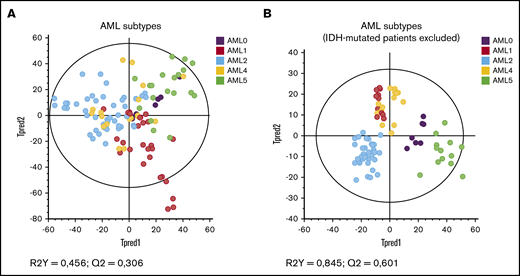
Specific metabolic profile of AML patients according to cytologic subtypes of leukemic progenitors (FAB classification). (A) Score plot of the OPLS-DA model built with HRMAS NMR data of all patients (n = 54) and the different AML subtypes. Based on the model factors (R2Y = 0,456; Q2 = 0,306), we see a tendency to separate the patients’ profiles according to their cytologic subtypes. Some patients appear to have common features. (B) Score plot of the same OPLS-DA model as panel A, excluding the IDH mutated patients (n = 41). The model is very robust and predictive (R2Y = 0,845; Q2 = 0,601). The distribution of the metabolic profiles is influenced by the oncometabolite 2-HG.
Specific metabolic profile of AML patients according to cytologic subtypes of leukemic progenitors (FAB classification). (A) Score plot of the OPLS-DA model built with HRMAS NMR data of all patients (n = 54) and the different AML subtypes. Based on the model factors (R2Y = 0,456; Q2 = 0,306), we see a tendency to separate the patients’ profiles according to their cytologic subtypes. Some patients appear to have common features. (B) Score plot of the same OPLS-DA model as panel A, excluding the IDH mutated patients (n = 41). The model is very robust and predictive (R2Y = 0,845; Q2 = 0,601). The distribution of the metabolic profiles is influenced by the oncometabolite 2-HG.
Metabolomics revealed significant intracellular changes according to the mutational status of patients
Three genetic abnormalities were systematically studied in our cohort. First, we observed NPM1-mutated patients and wild-type-NPM1 patients had a clear different metabolic profile (Figure 2A). This is because of a significant decrease of glutamate (Glu), phosphocholine (PC), and phosphocreatine/creatine (PCr/Cr) in the NPM1-mutated subgroup, as well as an increase of 2-HG (not significant) and taurine (tau) in mutated patients compared with wild-type NPM1 patients (Figure 2B).
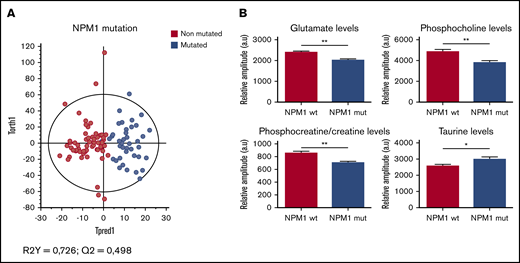
Specific metabolic profile of AML patients according to the mutational status of NPM1. (A) Score plot of the OPLS-DA model built with HRMAS-NMR data of NPM1 wild-type patients (n = 30) and NPM1-mutated patients (n = 17). The model is robust and predictive (R2Y = 0,726; Q2 = 0,498). We see a clear separation between the 2 groups. (B) Levels of Glu, PC, PCr/Cr, and tau in NPM1 wild-type patients compared with NPM1-mutated patients. Mean value ± standard error of the mean (SEM). Student t test, *P < .05, **P < .01.
Specific metabolic profile of AML patients according to the mutational status of NPM1. (A) Score plot of the OPLS-DA model built with HRMAS-NMR data of NPM1 wild-type patients (n = 30) and NPM1-mutated patients (n = 17). The model is robust and predictive (R2Y = 0,726; Q2 = 0,498). We see a clear separation between the 2 groups. (B) Levels of Glu, PC, PCr/Cr, and tau in NPM1 wild-type patients compared with NPM1-mutated patients. Mean value ± standard error of the mean (SEM). Student t test, *P < .05, **P < .01.
Concerning the FLT3 status, excellent separation of the FLT3-ITD and FLT3 wild-type subgroups was found (Figure 3A), because of a significant increase of alanine (Ala), choline (Cho), phosphoethanolamine (PE), and tau, as well as a significant decrease of Gln, PCr/Cr, and scyllo-inositol (scyllo-I) in the FLT3-ITD patients compared with FLT3 wild-type patients (Figure 3B).
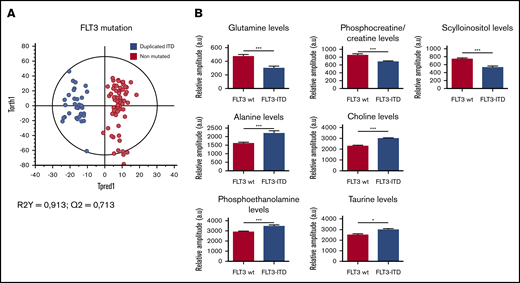
Specific metabolic profile of AML patients according to the mutational status of FLT3-ITD. (A) Score plot of the OPLS-DA model comparing FLT3 wild-type patients (n = 32) vs FLT3-ITD patients (n = 13). The model is very robust and predictive (R2Y = 0,913; Q2 = 0,713). The separation between FLT3-ITD patients and FLT3 wild-type patients is clear. (B) Levels of Gln, PCr/Cr, scyllo-I, Ala, Cho, PE, and τ in FLT3 wild-type patients compared with FLT3-ITD patients. Mean value ± SEM. Student t test, *P < .05, ***P < .001.
Specific metabolic profile of AML patients according to the mutational status of FLT3-ITD. (A) Score plot of the OPLS-DA model comparing FLT3 wild-type patients (n = 32) vs FLT3-ITD patients (n = 13). The model is very robust and predictive (R2Y = 0,913; Q2 = 0,713). The separation between FLT3-ITD patients and FLT3 wild-type patients is clear. (B) Levels of Gln, PCr/Cr, scyllo-I, Ala, Cho, PE, and τ in FLT3 wild-type patients compared with FLT3-ITD patients. Mean value ± SEM. Student t test, *P < .05, ***P < .001.
Last, as expected, a clear clustering between IDH-mutated and wild-type IDH patients was observed in the OPLS-DA model in Figure 4A, because 2-HG is only present in the mutated group and then emerged as the most discriminant metabolite between the 2 subgroups (P < .0001). No significant difference was observed between the IDH1 and IDH2 mutations (P = 0,47; data not shown). Moreover, a significant decrease of Ala, Glu, GSH, PC, and PE was also measured in the mutated patients (Figure 4B-C), suggesting that IDH mutation induces remodeling of several metabolic pathways. All the metabolic changes according to the mutational statuses were detailed in supplemental Table 3.
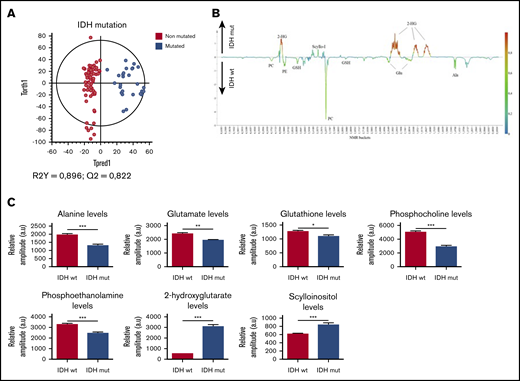
Specific metabolic profile of AML patients according to the mutational status of IDH. (A) Score plot of the OPLS-DA model comparing IDH wild-type patients (n = 36) vs IDH-mutated patients (n = 13). The model is robust and predictive (R2Y = 0,896; Q2 = 0,822), showing a clear separation between IDH-mutated and IDH wild-type patients. (B) 1D loading plot of IDH wild-type and IDH mutated patients, showing the main differences between the 2 groups. (C) Levels of Ala, Glu, GSH, PC, PE, 2-HG, and scyllo-I in IDH wild-type patients compared with IDH-mutated patients. Mean value ± SEM. Student t test, *P < .05, **P < .01, ***P < .001.
Specific metabolic profile of AML patients according to the mutational status of IDH. (A) Score plot of the OPLS-DA model comparing IDH wild-type patients (n = 36) vs IDH-mutated patients (n = 13). The model is robust and predictive (R2Y = 0,896; Q2 = 0,822), showing a clear separation between IDH-mutated and IDH wild-type patients. (B) 1D loading plot of IDH wild-type and IDH mutated patients, showing the main differences between the 2 groups. (C) Levels of Ala, Glu, GSH, PC, PE, 2-HG, and scyllo-I in IDH wild-type patients compared with IDH-mutated patients. Mean value ± SEM. Student t test, *P < .05, **P < .01, ***P < .001.
Metabolic profile is linked to the differentiation stage of leukemic cells
Several variations of the metabolic profile, according to the FAB subtype, suggested that the differentiation stage of leukemic cells could influence their metabolic characteristics. Therefore, we analyzed metabolic profiles according to the characteristic immunophenotyping of blast cells determined for each patient at diagnosis. We first compared patients with a CD34+/MPO− phenotype, corresponding to immature AML to those with the phenotype CD34−/MPO+, corresponding to more mature AML. An increase in aspartate (Asp) level was observed in patients with immature AML, whereas the patients with more mature AML were mainly characterized by an increase of 2-HG (Figure 5A). Then, we were interested by AML differentiated in the monocytic lineage (M4 and M5). Hence, we analyzed the CD14 and CD300e status, and Gln appeared as a marker of the monocytic cells, corresponding to the phenotype CD14+/CD300e+, whereas proline (Pro) was mainly increased in monoblastic cells, corresponding to the phenotype CD14−/CD300e− (Figure 5B). No differences were found concerning the other tested antibodies and other analyzed metabolites.
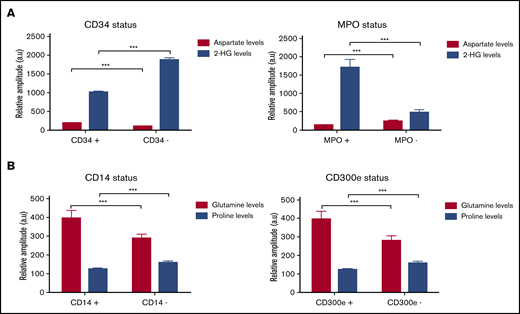
Changes in metabolites levels according to the immunologic status of patients. (A) Levels of Asp and 2-HG metabolites according to the CD34/MPO status in M0, M1, and M2 subtypes, corresponding to immature AML. (B) Levels of Gln and Pro according to the CD14/CD300e status in M4 and M5 subtypes, corresponding to more mature AML. Mean value ± SEM. Two-way analysis of variance test, ***P < .001.
Changes in metabolites levels according to the immunologic status of patients. (A) Levels of Asp and 2-HG metabolites according to the CD34/MPO status in M0, M1, and M2 subtypes, corresponding to immature AML. (B) Levels of Gln and Pro according to the CD14/CD300e status in M4 and M5 subtypes, corresponding to more mature AML. Mean value ± SEM. Two-way analysis of variance test, ***P < .001.
Impact of metabolism on prognosis in de novo AML
We further tested the potential interest of metabolomics for AML prognosis. For that aim, we first built an OPLS-DA model with the 2 subgroups favorable and adverse risk, and we next predicted the prognosis of patients classified in the intermediate prognostic subgroup. First, we observed that patients in these 2 favorable and adverse risk groups had clearly different metabolic profiles (Figure 6A), mainly because of higher intracellular levels of Asp and GSH (Figure 6B) in the adverse group compared with the favorable group. While predicting intermediate patients without prior knowledge using the adverse-favorable OPLS-DA model, we found 53% of them classified as favorable (n = 8) and 47% classified as adverse (P < .05, exact Fisher test; Figure 6C). Until now, among the 7 patients with intermediate prognoses, which were predicted as adverse by the model, 6 are unfortunately dead. Among the 8 patients predicted as favorable prognosis, 5 of them are still alive.
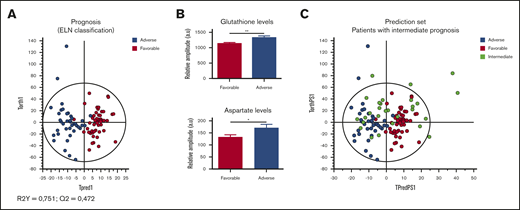
Specific metabolic profile of AML patients according to their prognosis (ELN classification). (A) Score plot of the OPLS-DA model comparing adverse (n = 18) vs favorable (n = 21) prognostic groups (R2Y = 0.751; Q2 = 0.472). (B) Levels of GSH and Asp in favorable group compared with adverse group. Mean value ± SEM. Student t test, *P < .05, **P < .01. (C) The prediction of the patients with intermediate risk in the OPLS-DA model built with adverse and favorable subgroups shows a distribution of the half of these patients in favorable risk (n = 8) and the other half in adverse risk (n = 7).
Specific metabolic profile of AML patients according to their prognosis (ELN classification). (A) Score plot of the OPLS-DA model comparing adverse (n = 18) vs favorable (n = 21) prognostic groups (R2Y = 0.751; Q2 = 0.472). (B) Levels of GSH and Asp in favorable group compared with adverse group. Mean value ± SEM. Student t test, *P < .05, **P < .01. (C) The prediction of the patients with intermediate risk in the OPLS-DA model built with adverse and favorable subgroups shows a distribution of the half of these patients in favorable risk (n = 8) and the other half in adverse risk (n = 7).
Following this, the patients’ responses to chemotherapy was analyzed. A great difference between metabolic profile of chemosensitive and chemoresistant patients was seen in the OPLS-DA model (Figure 7A). In the differentially expressed metabolites, we observed an increase in Gln and scyllo-I (P = .05) in chemosensitive patients. On the other side, an increase in GSH and tau levels was measured in chemoresistant patients, like in those with an adverse prognosis, and a significant increase in Ala (P < .01) level, like in FLT3-ITD patients (Figure 7B-C).
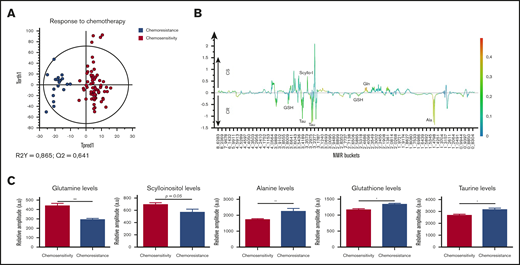
Specific metabolic profile of AML patients according to their response to chemotherapy induction. (A) Score plot of the OPLS-DA model comparing chemosensitive patients (n = 31) vs chemoresistant patients (n = 7). The model is very robust and predictive (R2Y = 0.865; Q2 = 0.641), showing well-separated groups. (B) 1D loading plot of chemosensitive (CS) and chemoresistant (CR) patients. (C) Levels of Gln, scyllo-I, Ala, GSH, and τ in chemosensitive patients compared with chemoresistant patients. Mean value ± SEM. Student t test, *P < .05, **P < .01.
Specific metabolic profile of AML patients according to their response to chemotherapy induction. (A) Score plot of the OPLS-DA model comparing chemosensitive patients (n = 31) vs chemoresistant patients (n = 7). The model is very robust and predictive (R2Y = 0.865; Q2 = 0.641), showing well-separated groups. (B) 1D loading plot of chemosensitive (CS) and chemoresistant (CR) patients. (C) Levels of Gln, scyllo-I, Ala, GSH, and τ in chemosensitive patients compared with chemoresistant patients. Mean value ± SEM. Student t test, *P < .05, **P < .01.
Then, to evaluate whether the blast percentage could have influenced our results in all the analysis described in this study, we compared the mean of blast percentage in bone marrow between all the groups of the studied patients: NPM1 wild type vs NPM1 mutated; FLT3 wild type vs FLT3-ITD; IDH wild type vs IDH mutated; favorable vs adverse prognosis; and chemosensitive vs chemoresistant patients. All the mean comparison tests are not significant with P > .05 (supplemental Figure 3).
Finally, because 2-HG was clearly linked to the presence of IDH mutation and because this mutation has been reported as a prognostic marker, we evaluated the prognostic value of 2-HG intracellular level. We observed that patients with adverse prognosis displayed lower levels of 2-HG compared with favorable prognosis. To confirm the interest of 2-HG level, we used the optimal threshold point of 1160 units identified using ROC analysis to generate a Kaplan-Meier curve. A better survival after 3.7 years was highlighted in AML patients who displayed higher levels of 2-HG, even though it was not significant (P = .11; supplemental Figure 2). Moreover, to evaluate a potential impact of disease burden, we studied the correlation between blast number and 2-HG level. The results clearly show the absence of correlation (R2 = .09; supplemental Figure 3).
Discussion
In recent years, the development of HRMAS-NMR–based metabolomics has led to a better characterization of the cancer-associated metabolic changes in cellulo. In this study, this method has been used to refine our knowledge about the metabolic characteristics of leukemic cells to elucidate the mechanisms developed by these leukemic cells to promote their proliferation and the impact of these deregulations on patients’ prognosis. The use of advanced statistics, such as OPLS-DA, was essential and powerful in separating unwanted variance caused by the variability between patient lifestyle, regimen, or age, from the variance caused by genetic status, prognostic risk, or response to chemotherapy.
The global analysis of the metabolites found in the leukemic samples shows an important variation in their expression between all the patients. Large differences between FAB subtypes were identified first, which is consistent with the fact that FAB subtypes of AML represent different cellular types, linked to the differentiation and maturation stage of the leukemic cells. Moreover, we observed that the differences among FAB subtypes are clearly more significant when the oncometabolite 2-HG is excluded from the analysis. The impact of 2-HG on the statistic model seems logical because its production was found in a large amount within IDH-mutated patients that were present in all the AML subtypes at diagnosis.
Next, we explored the mutational status for the 3 genes: NPM1, FLT3, and IDH. Metabolic alterations were found, which can be correlated to the patients’ genotypes. Regarding the IDH mutations, the link between the molecular status and the metabolism has been largely described in the last decade.20,21 Previous studies have highlighted a 20- to 50-fold variation of 2-HG levels in sera, urine, and marrow aspirate in IDH-mutated vs nonmutated patients.22-24 In our study, we found the same range of expression of 2-HG and we especially showed, for the first time in our knowledge, that IDH mutations induce a significant accumulation of 2-HG into the cells. Moreover, using ROC analysis, we identified a 2-HG threshold allowing for the distinction between IDH-mutated and wild-type IDH patients with a specificity close to 100%. In addition to the variation of 2-HG levels, we highlighted significant variations in other metabolites levels in IDH-mutated patients, suggesting an impact of IDH status on various metabolic pathways. Indeed, we observed some deregulations in the amino acid metabolism, with a reduction of Glu and GSH levels in IDH-mutated patients. The same observations were recently described in gliomas.25 In connection with that, Gln was found to be a good prognostic biomarker (although it was usually associated with heightened aggressiveness), because it is found to be increased in FLT3 wild-type and IDH-mutated patients, as well as in chemosensitive patients. This can be explained that by the fact that Gln is a primary carbon source for the biosynthesis of 2-HG in mutant IDH tumors, which was highlighted by in vivo imaging on mice.26
Concerning the FLT3 and NPM1 mutations, the metabolic alterations were less specific, probably because these genes have no direct impact on key enzymes of metabolism. The significant variation of several metabolites observed in mutated vs nonmutated patients for these 2 genes could reflect more the general metabolic adaptation (eg, the FLT3-driven increase of proliferation), with an acceleration of the membrane phospholipid production in FLT3-ITD patients. Indeed, FLT3 mutation in AML led to a more important proliferation and differentiation in cancer cells, increasing their survival and decreasing the apoptosis.27,28 Furthermore, the mutation in the NPM1 gene induced the assembly of a large number of proteins required for ribosomal biosynthesis. Hence, this mutation was found to contribute to the cellular growth and proliferation.29
Furthermore, we attempted to correlate the metabolic characteristics of patients with the differentiation phenotype of leukemic cells and found that the 2-HG was overexpressed in patients with the CD34−/MPO+ phenotype, among the AML subtypes M0, M1, and M2. It appeared that 2-HG was most representative of the advanced stages of differentiation in these subtypes, with 11 of our 13 patients mutated for the IDH gene (85%) who were classified as M1 or M2 subtypes at diagnosis. The same has been already described in child AML30 patients and adult patients.31 Among M4 and M5 patients, Gln was found to overexpress in patients harboring CD14+/CD300e+ phenotype, corresponding to monocytic cells. Zellner et al highlight that monocytes are the main cells that use Gln as an important energy substrate.32 Moreover, it was described in hepatocarcinoma cells that Gln was mainly increased at the mature stage of the cancer.33
As the activation and the deregulation of metabolic pathways are processes developed by cancer cells to promote their survival, thus promoting disease progression, it is likely that the overexpression of certain metabolites can impact patients’ prognoses34 ; the present study shows results to support the same. With respect to prognostic analysis, the metabolic profiles of the patients classified under favorable and adverse risk, as well as those of chemosensitive and chemoresistant patients, display significant differences. Interestingly, the same metabolites were overexpressed in the adverse prognostic subgroup and in chemoresistant patients, particularly the GSH level. This metabolite appeared as a poor prognostic biomarker, suggesting that leukemic cells had an aberrant glutathione metabolism. Based on the literature, an increase in this metabolite is associated with a strongly proliferative response, which is essential for cell cycle progression.35 This increase can be correlated with the number of patients in relapse. The patients in the adverse prognostic group are at a greater risk of relapse than others because of their complex karyotype and associated mutations.36 Moreover, GSH increase is a major factor contributing to the drug resistance through different mechanisms. This metabolite can be linked or can react with drug substances, interact with the ROS, and also help avoid DNA damage.35 A high expression of glutathione-S-transferase combined with high GSH levels can increase the conjugation and detoxification rate of chemotherapy agents, considerably decreasing their efficacy.37 Furthermore, oxidized glutathione levels at diagnosis were lower in survivors vs nonsurvivors in patients with AML.10
We further highlighted alterations in the expression of some phospholipids (PC, PE) related to the prognoses and genotype of the patients. Notably, phospholipid metabolism is frequently altered in cancers. Specifically, the choline kinases, which transform choline into PC, can be overexpressed, which leads to an increase in PC levels, which in turn plays an important role in cell transformation and cancerous proliferation.38 High levels of PE indicate an intense cellular proliferation, frequently observed in cancers, associated with a PC increase.39 Ackerstaff et al40 showed elevated levels of PE and PC in breast cancer tissues compared with healthy tissues. In AML, Wang et al16 observed that PC was expressed at higher level in sera of patients with intermediate risk compared with favorable risk. More recently, a lipidomic approach was performed to help the stratification of AML patients,41 and a novel link between phospholipid metabolism and AML stemness was uncovered, thereby providing a potential therapeutic target for AML.42 Last, in neurologic oncology, studies show that patients with high-grade glioma have higher levels of PE and PC than those with low-grade glioma.43,44 More recently, Viswanath et al45 observed that de novo synthesis of PE and PC and choline and ethanolamine kinase activity decreased significantly in patients with IDH-mutated glioma. They have established a link between this negative regulation and the oncometabolite 2-HG, which would be responsible of these phenomena through hypoxia inducible factor 1α stabilization. Our results confirm this particular link between 2-HG and phospholipid metabolism in de novo AML and provide additional results suggesting that IDH prognostic value could be mediated through phospholipid regulation by 2-HG.
Finally, the level of Ala was found to be higher in FLT3-ITD patients and chemoresistant patients, who can be considered a group of poor prognosis patients. Several publications highlight the fact that Ala is a poor prognostic biomarker, especially Chen et al,46 who claim that, in mitochondrial DNA mutant cells that harbor human disease–associated oxidative phosphorylation defects, the increase of cytosolic Ala contributes to the reoxidation of NADH, which is a source of nicotinamide adenine dinucleotide phosphate (NADPH) production, which leads to the glutathione and lipid biosynthesis. Indeed, as mentioned before, GSH and lipids synthesis is linked to a poor prognosis. Moreover, another study highlights the fact that there is more pyruvate consumption in aggressive bladder cancer stage, which leads to more Ala generation as a marker of aggressiveness.47 Our results thus appear concordant with the role of FLT3-ITD AML in the autophagic flux in leukemic stem cells, which make them resistant to chemotherapy.48 In fact, Ala secretion was described as a consequence of cancer cells autophagy.49 Altogether, targeting autophagy appears to be a promising lead, especially in FLT3-ITD patients.
Conclusions
Our study provides an overview of the metabolites and metabolic pathways involved in the intracellular metabolic reprogramming in AML blasts. It highlights that different mechanisms, depending on the genetic characteristics of leukemic progenitors, are activated in AML, particularly proven by the strong link between the modifications of the metabolism and the presence of the IDH mutation. Moreover, the study shows that leukemic progenitors activate different programs of the metabolism, depending on their levels of differentiation blockade. Finally, our data strongly suggest that, besides redox balance, phospholipid metabolism plays a critical role in the leukemic progression, and therefore, therapy targeting this pathway can potentially improve the prognosis of AML patients.
For original data and procedures, please contact florence.fauvelle@univ-grenoble-alpes.fr.
Authorship
Contribution: P.M. conducted the study design; C.L.P. pretreated the samples, performed the HRMAS-NMR, and conducted data analyses; F.F. supervised the metabolomics design of the study; M.-C.J. aided in immunophenotyping analyses; J.M. aided the experiments; and all authors read and approved the manuscript.
Conflict-of-interest disclosure: The authors declare no competing financial interests.
Correspondence: Pascal Mossuz, Institut de Biologie et Pathologie CHU Grenoble Alpes, CS 10217, 38043 Grenoble Cedex 9, France; e-mail: pmossuz@chu-grenoble.fr.

