Key Points
Bone marrow CD8+ T-cell differentiation states play a crucial role in patients with AML response to therapy.
Single-cell RNA sequencing analysis reveals developmental dichotomic programs and clonal expansion in relation to therapy response in AML.
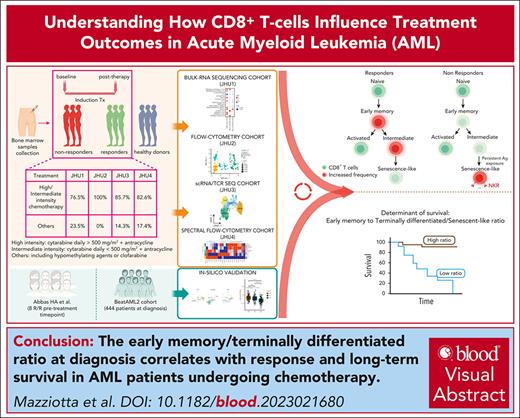
Visual Abstract
The interplay between T-cell states of differentiation, dysfunction, and treatment response in acute myeloid leukemia (AML) remains unclear. Here, we leveraged a multimodal approach encompassing high-dimensional flow cytometry and single-cell transcriptomics and found that early memory CD8+ T cells are associated with therapy response and exhibit a bifurcation into 2 distinct terminal end states. One state is enriched for markers of activation, whereas the other expresses natural killer (NK)-like and senescence markers. The skewed clonal differentiation trajectory toward CD8+ senescence was also a hallmark indicative of therapy resistance. We validated these findings by generating an AML CD8+ single-cell atlas integrating our data and other independent data sets. Finally, our analysis revealed that an imbalance between CD8+ early memory and senescent-like cells is linked to AML treatment refractoriness and poor survival. Our study provides crucial insights into the dynamics of CD8+ T-cell differentiation and advances our understanding of CD8+ T-cell dysfunction in AML.
Introduction
T cells play a pivotal role in controlling cancer by recognizing and eliminating early malignant clones, orchestrating immune responses against cancer cells, and dictating response to chemotherapeutic and immune-based treatments.1,2 Attempts to enhance T-cell–mediated tumor clearance in acute myeloid leukemia (AML) using immune checkpoint blockade (ICB) and effector cell–based therapies have shown limited success.3-7 Therefore, there is an unmet need to decipher T-cell responses and the immune contexture of AML after chemotherapy and immunotherapy.
T-cell differentiation states can provide insights into the relationship between T cells and therapy response.8 In solid tumors, ICB induces the differentiation of CD8+ stem-like T cells into intermediate exhausted subsets with cytotoxic potential,9,10 which ultimately differentiate into terminally exhausted CD8+ T cells that cannot proliferate and differentiate further.11 Consistent with this model, different proportions of CD8+ exhausted subsets have been associated with solid tumor responses to immunotherapies.8,12 In addition to exhausted subsets, infused chimeric antigen receptor T cells and endogenous T cells with a cytotoxic natural killer (NK)-like signature show dysfunction linked to unfavorable outcomes.13,14 Our prior studies have demonstrated that gene programs of T-cell exhaustion and senescence in patients with AML at diagnosis are associated with resistance to induction chemotherapy, and senescent-like T cells exhibit reduced AML blast killing.14,15 However, we still lack a comprehensive view of T-cell heterogeneity and dynamic changes, particularly related to dysfunctional and progenitor-like T-cell states at the single-cell level within the AML microenvironment.
Here, we show that reduced CD8+ early memory cells and a clonal differentiation trajectory skewed toward CD8+ senescence associate with resistance to induction therapy. We propose that an early to terminal memory CD8+ T-cell ratio could serve as a powerful metric to guide clinical exploration of novel therapies that modulate T-cell differentiation and promote effective antileukemia responses.
Methods
Patient cohorts
Bone marrow (BM) was collected from patients with AML at the time of diagnosis and after treatment, as well as from healthy donors (HDs). We used a multimodal approach encompassing bulk RNA sequencing (RNAseq), flow cytometry, single-cell RNAseq (scRNAseq), and spectral flow cytometry to analyze T-cell differentiation states in the context of AML.
Bulk-RNAseq of CD8+ T cells (Johns Hopkins University [JHU] 1)
CD8+ T cells were sorted into TRIzol (Thermo Fisher Scientific, Waltham, MA). Bulk-RNAseq was performed at Q2 solutions (Durham, NC) using Illumina HiSeq instrument and TrueSeq libraries with 50 bases paired end sequencing (∼40 million reads per sample). Gene-level count matrices were generated using featureCounts.
Flow cytometry (JHU2) and spectral flow cytometry (JHU4)
Antibodies used for flow cytometry (BD-Fortessa, Becton Dickinson) and spectral flow cytometry (Cytek Aurora) of BM mononuclear cells are listed in supplemental Tables 1 and 2, available on the Blood website. Data were transformed and compensated in FlowJo V10 (TreeStar) before the downstream analysis was performed using R.
Bulk-RNAseq of sorted CD57+KLRG1+ and CD57–KLRG1– CD8+ T cells
CD8+ CD57+KLRG1+ and CD57–KLRG1– T cells were sorted directly into TRIzol reagent (Thermo Fisher Scientific). Total RNA was extracted using the RNeasy Plus Micro Kit (Qiagen) according to the manufacturer’s protocol. RNAseq libraries were built using the NEBNext Ultra II Directional RNA Library Prep (New England Biolabs, Ipswich, MA) and sequenced on the Illumina NovaSeq 6000 with S1 flow cell (2 × 50 bp reads). Gene model counts were calculated using HTseq version 0.11.2. Antibodies used for cell sorting are listed in supplemental Table 3.
scRNAseq/T-cell receptor sequencing (TCRseq; JHU3)
Sorted CD3+ T/NK were washed and resuspended in phosphate buffered saline (PBS) + 0.04% bovine serum albumin (BSA; gating strategy in supplemental Figure 1). A total of 16 000 cells per sample were loaded on a 10× Chromium Controller based on the 5’ Chromium Single Cell V(D)J Reagent Kit manual (10x Genomics). After cell partitioning and gel bead-in-emulsion (GEM) generation, reverse transcription was performed, and complementary DNA (cDNA) was pooled and cleaned up by beads. cDNA was further amplified for 13 cycles and cleaned up by solid phase reversible immobilization (SPRI) beads (Beckman). The quality of cDNA was assessed by High Sensitivity D5000 Tapestation (Agilent Technologies Inc, Santa Clara, CA) and quantified by Qubit 2.0 DNA HS assay (Thermo Fisher Scientific). T-cell receptor (TCR) target enrichment, 5′ Gene Expression library, and TCR library were carried out according to the 5′ Chromium Single Cell V(D)J Reagent Kit manual (10x Genomics, Pleasanton, CA). Equimolar pooling of libraries was performed based on quality control values and sequenced on an Illumina NovaSeq (Illumina, CA) with a read length configuration of 150 PE for 600 M PE reads per sample (300 M in each direction). The 10x genomics software Cell Ranger (version 4.0) was used to process the raw data FASTQ files with default parameters. The filtered feature matrices generated by the CellRanger pipeline were used for downstream quality control and analyses (R and Python).
Primary specimens and associated clinical data were obtained with written informed consent from the patients, in accordance with the Declaration of Helsinki on research protocols approved by the Ethics Committee of Johns Hopkins University.
Results
CD8+ T-cell differentiation states correlate with response and survival in patients with AML undergoing induction therapy
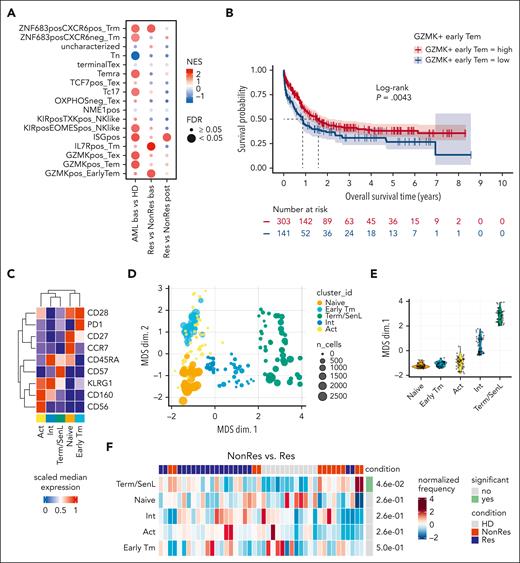
To explore BM T-cell heterogeneity, we analyzed longitudinally collected BM samples at disease onset and response assessment (Figure 1A). Using RNAseq, we examined sorted CD8+ T cells from complete responders (Res; n = 7) and nonresponders (NonRes; n = 10) at baseline and after induction therapy. HD (n = 3) CD8+ T-cell transcriptional profiles served as a comparator (JHU1 cohort; supplemental Table 4). Gene-set enrichment analysis of gene sets from a scRNAseq pan-cancer T-cell atlas16 identified distinct T-cell composition patterns among Res, NonRes, and HDs. We observed significant differences in CD8+ T-cell states between AML at baseline and HDs, with signatures of effector memory, terminally differentiated effector memory, and interferon–stimulated gene-positive T cells being enriched in AML. Consistent with prior studies,15 AML exhibited lower levels of the naïve T-cell signature than HDs (Figure 1A). At baseline, Res exhibited significant enrichment of GZMK+ early effector memory, IL7R+ memory, and CD8+ CXCR6+ZNF683+ T resident memory signatures compared with NonRes (Figure 1A). GZMK+ early effector memory cells are known to express high levels of CXCR5 or TCF7,16 whereas IL7R is a marker of stem-like memory states in CD8+ T cells.17
CD8+ T-cell states correlate with response in patients with AML. (A) Dot plot showing the enrichment of specific gene sets from pairwise GSEA comparisons (AML bas vs HD; Res vs NonRes bas; Res vs NonRes post) in bulk-RNAseq data (AML Res, n = 7, paired samples; AML NonRes, n = 10, paired samples; HD, n = 3). Size of dots indicates the statistical significance (large dot, FDR < 0.05; small dot, FDR ≥ 0.05); color scale shows the normalized enrichment score (NES). (B) Kaplan-Meier estimates of OS in patients (BeatAML2 cohort, n = 444 patients) with a GZMK+ early Tem signature above (n = 303) and below (n = 141) the optimal cut point, which was computed using the maxstat package in R. Survival curves were compared using a log-rank test. (C) Heatmap with the fluorescence intensity values of 9 markers across 5 CD8+ BM subsets from all samples annotated as naïve (CCR7+CD45RA+CD27+CD28+), Early Tm (CD28+, PD1+), Act (KLRG1+CD160+CD56+), and Term/SenL (CD45RA+CD57+KLRG1+). The median marker expression identifies the markers that characterize each cell subset. (D) MDS plot showing the distribution of flow cytometry CD8+ T-cell subsets. Each point represents a cluster-sample instance, colored by cluster to emphasize similarities between cell subpopulations. (E) Violin plot illustrating the distribution of flow cytometry CD8+ T-cell subsets along the MDS dim.1 axis. Each violin represents a different CD8+ T-cell subpopulation. (F) Heatmap showing relative cluster abundances by samples. Adjusted P values for the comparison NonRes vs Res are displayed, with significant comparisons (FDR < 0.05) highlighted in green. bas, baseline; GSEA, gene-set enrichment analysis; MDS dim.1, multidimensional scaling dimension 1; post, post-induction therapy.
CD8+ T-cell states correlate with response in patients with AML. (A) Dot plot showing the enrichment of specific gene sets from pairwise GSEA comparisons (AML bas vs HD; Res vs NonRes bas; Res vs NonRes post) in bulk-RNAseq data (AML Res, n = 7, paired samples; AML NonRes, n = 10, paired samples; HD, n = 3). Size of dots indicates the statistical significance (large dot, FDR < 0.05; small dot, FDR ≥ 0.05); color scale shows the normalized enrichment score (NES). (B) Kaplan-Meier estimates of OS in patients (BeatAML2 cohort, n = 444 patients) with a GZMK+ early Tem signature above (n = 303) and below (n = 141) the optimal cut point, which was computed using the maxstat package in R. Survival curves were compared using a log-rank test. (C) Heatmap with the fluorescence intensity values of 9 markers across 5 CD8+ BM subsets from all samples annotated as naïve (CCR7+CD45RA+CD27+CD28+), Early Tm (CD28+, PD1+), Act (KLRG1+CD160+CD56+), and Term/SenL (CD45RA+CD57+KLRG1+). The median marker expression identifies the markers that characterize each cell subset. (D) MDS plot showing the distribution of flow cytometry CD8+ T-cell subsets. Each point represents a cluster-sample instance, colored by cluster to emphasize similarities between cell subpopulations. (E) Violin plot illustrating the distribution of flow cytometry CD8+ T-cell subsets along the MDS dim.1 axis. Each violin represents a different CD8+ T-cell subpopulation. (F) Heatmap showing relative cluster abundances by samples. Adjusted P values for the comparison NonRes vs Res are displayed, with significant comparisons (FDR < 0.05) highlighted in green. bas, baseline; GSEA, gene-set enrichment analysis; MDS dim.1, multidimensional scaling dimension 1; post, post-induction therapy.
To assess the clinical relevance of these findings, we examined RNAseq data of newly diagnosed patients from the BeatAML2 cohort18 (n = 444). We observed a positive correlation between GZMK+ and IL7R+ T-cell signatures and overall survival (OS; Figure 1B; supplemental Figure 2A), whereas no survival advantage was associated with the ZNF683+CXCR6+ T resident memory signature (supplemental Figure 2B).
To further characterize the BM CD8+ T-cell landscape, we used high-dimensional flow cytometry to profile T cells from 16 patients with AML (10 Res and 6 NonRes) at baseline and after induction treatment, as well as 12 HDs (JHU2 cohort; supplemental Table 4). Unsupervised clustering identified 4 CD8+ T-cell states that were manually annotated based on previous work15,19-21 and flow-cytometric definitions19-22 as naïve, early T memory (Early Tm), activated (Act), and terminally differentiated/senescent-like (Term/SenL). A fifth subset, which expressed CD45RA and KLRG1 but lacked CD57, was categorized as intermediate (Int; Figure 1C). To assess phenotypical similarities among the identified cell states, we generated a 2-dimensional (2D) map using multidimensional scaling that positioned the Int state approximately equidistant between naïve and Term/SenL (Figure 1D-E). The segregation of the CD8+ T-cell subsets along the first dimension indicated that naïve, on the one end, and Term/SenL, on the other, represented 2 extremes of the CD8+ T-cell immunophenotypic spectrum, with Int capturing an intermediate differentiation state. Differential abundance (DA) analysis revealed a significant false discovery rate (FDR; < 0.05) increase of Term/SenL in NonRes vs Res, indicating a bias toward terminal differentiation in patients less likely to respond to treatment (Figure 1F). These data suggest that the heterogeneity of BM T-cell states in AML affect outcomes, prompting us to further characterize the AML T-cell landscape at single-cell resolution.
BM infiltrating CD8+ T cells in AML have distinct transcriptional states
We sorted “untouched” BM CD3+ T cells, excluding myeloid, B, and stromal cells (supplemental Figure 1). Paired scRNAseq and TCRseq were performed on 15 BM samples from 7 patients with AML and 3 BM samples from HDs (supplemental Table 4). This approach yielded a higher number of CD3+ T cells than in previous scRNAseq studies in AML.23,24 A total of 64 308 cells were annotated according to the signatures provided in supplemental Table 5 (supplemental Figure 3A-D).
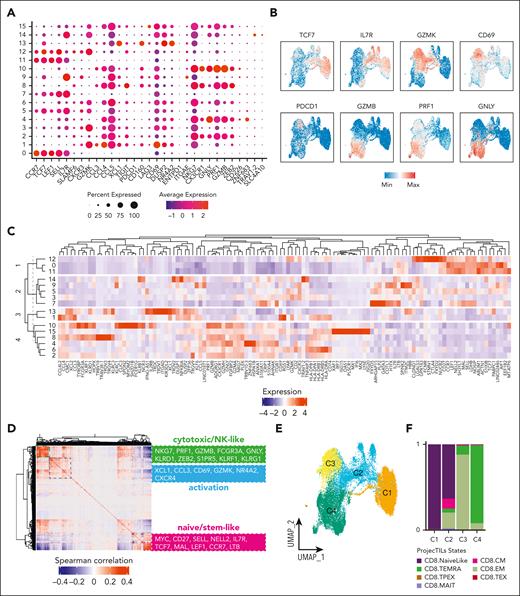
Focusing on CD8+ T cells, we identified 16 clusters (Figure 2A) and characterized their unique states by visualizing single-marker expression (Figure 2A-B). K-means clustering grouped these clusters into 4 larger groups (Figure 2C): group 1 (clusters 12, 0, and 11) expressing naïve T-cell genes (CCR7, MAL, SELL, and LEF1); group 2 (clusters 14, 9, 5, 3, and 7) exhibiting stem-like markers (TCF7, IL7R, and CD27) as well as GZMK and CXCR3, a marker involved in early tumor infiltration and ICB response in melanoma25; group 3 (clusters 13 and 1) expressing activation markers (CD69 and GMZK) and chemokine (C-C motif) ligands (CCL3 and CCL4); and group 4 (clusters 10, 15, 8, 4, 6, and 2) characterized by cytotoxic/NK-like markers (GNLY, NKG7, PRF1, GZMB, CX3CR1, KLRF1, and KLRD1). Consistent with this observation, Spearman correlation analysis revealed 3 subsets of highly correlated genes: cytotoxic/NK-like, activation, and naïve/stem-like markers (Figure 2D). To interpret the functional significance of these 4 groups, denoted as C1, C2, C3, and C4 (Figure 2E), we used the ProjecTILs computational framework.26 This analysis aligned with the previously identified differential gene expression patterns categorizing C1 as naïve-like, C2 as naïve-like/memory, resembling an early memory state, C3 as effector memory, and C4 as terminally differentiated (Figure 2F). Consistent with previous work in AML, none of the CD8+ T-cell states were classified as exhausted.27,28 Based on our previous findings on senescent CD8+ T cells expressing CD57 and NK-like markers (KLRG1, KLRC1, KLRC3, KLRD1, KLRF1, and CD158A)14 and the recently described NK-like signature of dysfunction in chimeric antigen receptor T cells (supplemental Table 6; Good et al13), we reasoned that C4 may represent a spectrum of dysfunctional T cells in patients with AML.
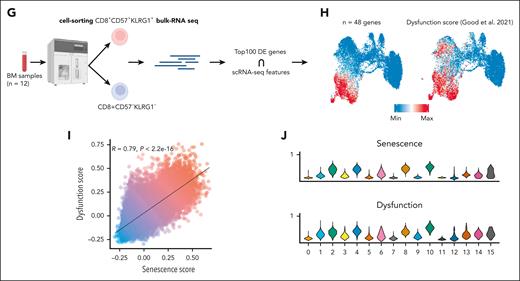
Characterization of CD8+ BM T cells in AML at the transcriptional level. (A) Dot plot of the average expression of selected genes across the CD8+ clusters. (B) Feature plots of selected CD8+ T-cell gene markers. (C) Heat map of DEGs showing the top 10 DEGs for each cluster. (D) Heatmap showing the Spearman correlation of log-normalized counts of the top 500 most variable genes determined by Seurat. Selected genes with a correlation coefficient above the 99th percentile threshold are highlighted on the right. (E) Uniform manifold approximation and projection (UMAP) plot of the distribution of CD8+ T cells colored by selected DEGs. (F) Barplot illustrating the relative frequencies of ProjecTILs states within each of the annotated subsets (C1, C2, C3, and C4). (G) Schematic pipeline used to identify Term/SenL signature using bulk-RNAseq. (H) Feature plot of CD8+ T-cell senescence (left) and dysfunction (right) scores. (I) Pearson correlation of the senescence (x-axis) and dysfunction (y-axis) scores. (J) Distribution of the averaged expression (y-axis) of senescence (top) and dysfunction (bottom) scores across the CD8+ clusters. DEGs, differentially expressed genes; Max, maximum; Min, minimum.
Characterization of CD8+ BM T cells in AML at the transcriptional level. (A) Dot plot of the average expression of selected genes across the CD8+ clusters. (B) Feature plots of selected CD8+ T-cell gene markers. (C) Heat map of DEGs showing the top 10 DEGs for each cluster. (D) Heatmap showing the Spearman correlation of log-normalized counts of the top 500 most variable genes determined by Seurat. Selected genes with a correlation coefficient above the 99th percentile threshold are highlighted on the right. (E) Uniform manifold approximation and projection (UMAP) plot of the distribution of CD8+ T cells colored by selected DEGs. (F) Barplot illustrating the relative frequencies of ProjecTILs states within each of the annotated subsets (C1, C2, C3, and C4). (G) Schematic pipeline used to identify Term/SenL signature using bulk-RNAseq. (H) Feature plot of CD8+ T-cell senescence (left) and dysfunction (right) scores. (I) Pearson correlation of the senescence (x-axis) and dysfunction (y-axis) scores. (J) Distribution of the averaged expression (y-axis) of senescence (top) and dysfunction (bottom) scores across the CD8+ clusters. DEGs, differentially expressed genes; Max, maximum; Min, minimum.
Because scRNAseq cannot detect CD57,29 to identify SenL cells, we performed bulk-RNAseq of sorted CD57+KLRG1+ and CD57–KLRG1– CD8+ T cells from AML BM samples (n = 12; Figure 2G). We computed a senescence score using genes at the intersection between the top 100 differentially expressed genes (DEGs) from bulk (supplemental Table 6) and scRNAseq (genes shared, n = 48) and mapped the SenL subset onto the 2D UMAP (Figure 2H). C4 expressed higher levels of SenL-related genes (Figure 2H) and overlapped with a published NK-like dysfunction signature13 (Figure 2H), suggesting that SenL cells may also be dysfunctional. The 2 scores were significantly correlated (R = 0.81; P < 2.2e−16; Figure 2I) and had a similar distribution across the clusters (Figure 2J), pointing to SenL as a prominent dysfunctional state in the AML microenvironment.
Single-cell transcriptomic analysis identifies CD8+ T-cell subsets associated with therapy response
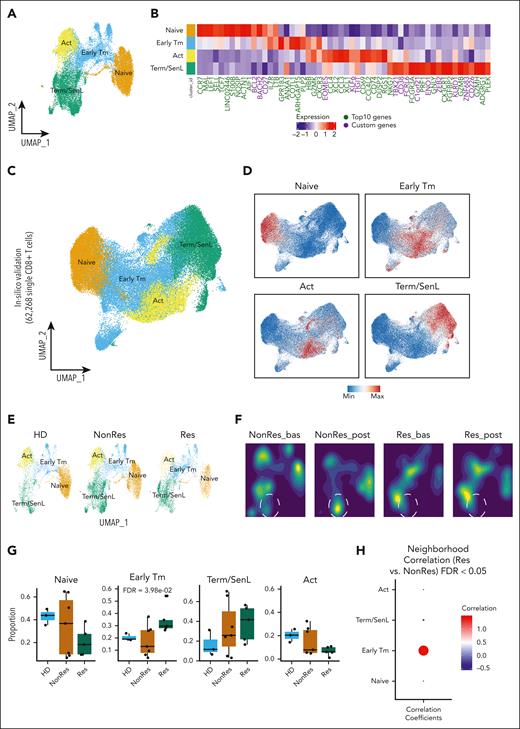
Based on marker expression, we annotated the CD8+ T-cell subsets as naïve, Early Tm, Act, and Term/SenL (Figure 3A). To validate our grouping, we used DEG and custom genes (Figure 3B) and verified that the 2D UMAP projection of the scores built from the gene modules in supplemental Table 7 overlapped with the 4 labeled subsets (supplemental Figure 4). We validated our grouping integrating our and already published data sets confirming the presence of the same transcriptional states4,23,27,30 (total of 62 268 CD8+ T cells; Figure 3C-D).
Identification of 4 main CD8+ T-cell subsets and their different proportions across different groups (HD, Res, and NonRes). (A) UMAP colored by the annotated CD8+ T-cell subsets. (B) Heatmap showing the top 10 DEGs (green) and custom markers (violet) across the 4 CD8+ T-cell subsets. (C) UMAP colored by the annotated CD8+ T-cell subsets (large scale scRNAseq data set). (D) Feature plots of CD8+ T-cell states signatures from B (large scale scRNAseq data set; Lasry et al,30 Penter et al,27 Abbas et al,4 and Dufva et al23). (E) UMAP colored by CD8+ T-cell subsets defined in A and split by group (HD, NonRes, and Res). (F) UMAP of CD8+ T cells colored by density and split by group (NonRes, and Res) and time points (bas and post). Dashed lines indicate a Term/SenL area that increases with blasts persistence (G) Boxplots showing the proportion (y-axis) of each CD8+ T-cell subset across the three groups (HD, NonRes, and Res). DA testing was performed using propeller.anova from the speckle R package. (H) Dot plot visualization of the CD8+ T-cell subsets correlated with either Res (red) or NonRes (blue) status. Correlation was computed with rcna R package. Size of dots indicates the statistical significance (large dot, FDR < 0.05; small dot, FDR ≥ 0.05). Bas, baseline; post, post-induction therapy.
Identification of 4 main CD8+ T-cell subsets and their different proportions across different groups (HD, Res, and NonRes). (A) UMAP colored by the annotated CD8+ T-cell subsets. (B) Heatmap showing the top 10 DEGs (green) and custom markers (violet) across the 4 CD8+ T-cell subsets. (C) UMAP colored by the annotated CD8+ T-cell subsets (large scale scRNAseq data set). (D) Feature plots of CD8+ T-cell states signatures from B (large scale scRNAseq data set; Lasry et al,30 Penter et al,27 Abbas et al,4 and Dufva et al23). (E) UMAP colored by CD8+ T-cell subsets defined in A and split by group (HD, NonRes, and Res). (F) UMAP of CD8+ T cells colored by density and split by group (NonRes, and Res) and time points (bas and post). Dashed lines indicate a Term/SenL area that increases with blasts persistence (G) Boxplots showing the proportion (y-axis) of each CD8+ T-cell subset across the three groups (HD, NonRes, and Res). DA testing was performed using propeller.anova from the speckle R package. (H) Dot plot visualization of the CD8+ T-cell subsets correlated with either Res (red) or NonRes (blue) status. Correlation was computed with rcna R package. Size of dots indicates the statistical significance (large dot, FDR < 0.05; small dot, FDR ≥ 0.05). Bas, baseline; post, post-induction therapy.
Next, we found that cluster composition and densities among Res, NonRes, and HDs (Figure 3E-F) aligned with flow cytometry findings showing an increased density of Term/SenL in patients with blasts persistence (Figure 3F). Furthermore, DA analysis using speckle31 (Figure 3G) and covarying neighborhood analysis32 (Figure 3H) revealed a significant (FDR < 0.05) association between Early Tm cells and Res status,31 supporting the hypothesis that increased Early Tm is linked to response to induction therapy in AML. This is strengthened by the increase of GZMK+IL7R+ (supplemental Figure 5) Early Tm cells in Res compared with NonRes and align consistently with our bulk-RNAseq data (Figure 1A).14,15
Early memory and senescent-like CD8+ T cells are associated with response and OS in independent AML cohorts
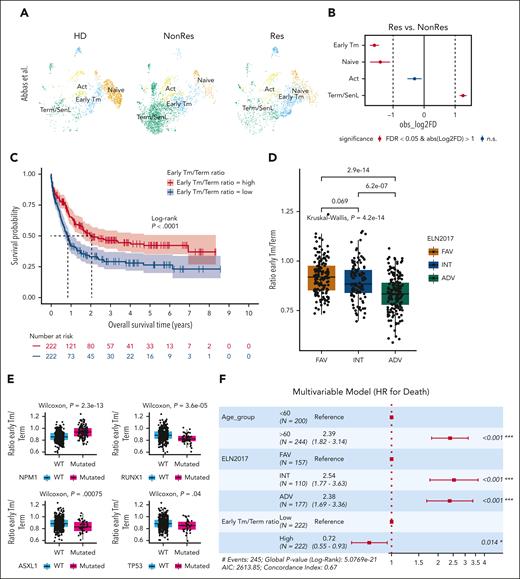
To substantiate the association between CD8+ T subset proportions and response to induction therapy, we analyzed an independent data set of 8 patients with AML treated with azacytidine plus nivolumab.4 We reannotated the clusters using single-marker expression, our bulk-RNAseq senescence score, and published gene signatures13,33,34 (Figure 4A; supplemental Figure 6A-D). Differential gene expression of custom genes showed a similar expression pattern to our scRNAseq cohort (supplemental Figure 6C). The independent data set confirmed significantly increased naïve and Early Tm in Res compared with NonRes and Term/SenL in NonRes compared with Res (Figure 4B), suggesting an imbalanced Early Tm/Term ratio with a higher proportion of Early Tm cells in patients likely to respond to therapy.
Early Tm/Term ratio as a prognosticator of OS. (A) UMAP from Abbas et al,4 colored by CD8+ T-cell subsets, and split by group (HD, NonRes, and Res). (B) Point-range plot from Abbas et al,4 showing the pairwise (Res vs NonRes) proportional difference (Monte Carlo/permutation test) for each CD8+ T-cell subset. The colors indicate the statistical significance (red, FDR < 0.05; blue, FDR ≥ 0.05); the vertical dashed lines mark the absolute value of log2 fold difference (FD) cutoff for significance. (C) Kaplan-Meier estimates of OS in patients (BeatAML2 cohort, n = 444 patients) with a Early Tm/Term ratio score above (n = 222) and below (n = 222) the median value. Survival curves were compared using a log-rank test. (D-E) Box plots showing the Early Tm/Term ratio (y-axis) in relation to ELN 2017 risk score (D) and the NPM1, RUNX1, ASXL1, and TP53 mutations (x-axis) (E) computed from patients in the BeatAML cohort. (F) Forest plot of diagnosis features (patient age and ELN 2017) and Early Tm/Term score associated with survival in multivariate Cox proportional hazard analyses. ADV, adverse; INT, intermediate; FAV, favorable; HR, hazard ratio for death; WT, wild type.
Early Tm/Term ratio as a prognosticator of OS. (A) UMAP from Abbas et al,4 colored by CD8+ T-cell subsets, and split by group (HD, NonRes, and Res). (B) Point-range plot from Abbas et al,4 showing the pairwise (Res vs NonRes) proportional difference (Monte Carlo/permutation test) for each CD8+ T-cell subset. The colors indicate the statistical significance (red, FDR < 0.05; blue, FDR ≥ 0.05); the vertical dashed lines mark the absolute value of log2 fold difference (FD) cutoff for significance. (C) Kaplan-Meier estimates of OS in patients (BeatAML2 cohort, n = 444 patients) with a Early Tm/Term ratio score above (n = 222) and below (n = 222) the median value. Survival curves were compared using a log-rank test. (D-E) Box plots showing the Early Tm/Term ratio (y-axis) in relation to ELN 2017 risk score (D) and the NPM1, RUNX1, ASXL1, and TP53 mutations (x-axis) (E) computed from patients in the BeatAML cohort. (F) Forest plot of diagnosis features (patient age and ELN 2017) and Early Tm/Term score associated with survival in multivariate Cox proportional hazard analyses. ADV, adverse; INT, intermediate; FAV, favorable; HR, hazard ratio for death; WT, wild type.
To assess the predictive value of the Early Tm/Term ratio, we turned to bulk-RNAseq data from the BeatAML2 cohort,18 including only diagnostic samples (n = 444) to enhance the comparability with our own cohort. We computed DEGs across the CD8+ T-cell subsets identified in our scRNAseq data set, used a Cox proportional hazard model with lasso penalty to select informative genes and conducted single-sample gene-set enrichment analysis to compute Early Tm/Term ratio scores. Patients with a ratio higher than the median experienced significantly longer OS (median, 2.06 years) than those with a low ratio (P < .0001; Figure 4C). Next, we assessed the interplay between AML-intrinsic features and CD8+ T-cell differentiation by correlating T-cell transcriptomic features with the European Leukemia Network (ELN) 2017 risk category.35 The Early Tm/Term ratio was significantly lower in the intermediate and adverse prognostic groups compared with the favorable group (Figure 4D), suggesting a contribution of molecular and cytogenetic features of leukemia blasts to T-cell dysregulation. Next, we investigated the impact of well-established individual prognostic mutations that contribute to the ELN 2017 classification. We found that patients with mutated NPM1 had significantly higher ratio levels, whereas patients with mutated TP53, ASXL1, and RUNX1 patients had significantly lower ratio levels (Figure 4E). These differences were not significant when considering FLT3-ITD status (supplemental Figure 7). Importantly, Early Tm/Term ratio proved to be a powerful predictor of survival in a multivariable model that also included age and ELN 2017 (Figure 4F).
Two developmental dichotomic programs lead to either senescence-like or activated end stages of differentiation
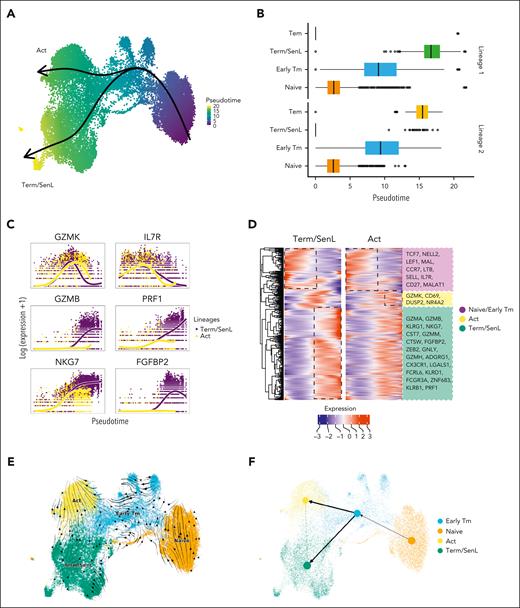
To analyze CD8+ T-cell dynamics we used Slingshot36 trajectory inference revealing 2 distinct “lineages” with Term/SenL (lineage 1: naïve -> Early Tm -> Term/SenL) or Act (lineage 2: naïve -> Early Tm -> Act) as end stages of differentiation (Figure 5A-B). The “Term/SenL lineage” had increased expression of NK-like/SenL genes, whereas cells of the “Act lineage” had increased expression of activation markers (Figure 5C-D). RNA velocity analysis37 supported the transition from naïve to Early Tm, with subsequent divergence to either SenL or Act states (Figure 5E). This differentiation pattern was confirmed using the computed latent time to identify individual cell transitions and the directionality of partition-based graph abstractions38 (Figure 5F). Validation in the large-scale CD8+ scRNAseq data set4,23,27,30 confirmed the coexistence of divergent trajectories along the T-cell differentiation: (1) naïve -> Early Tm -> Term/SenL; (2) naïve -> Early Tm -> Act (supplemental Figure 8). In sum, using 2 different approaches (trajectory and velocity inference), we found a divergent differentiation model, featuring 2 end stages of differentiation, one characterized by activation markers and the other by NK-like markers.
Divergent dynamic changes of CD8+ BM T cells. (A-B) UMAP (A) and box plots (B) depicting 2 predicted developmental trajectories inferred via Slingshot. In the UMAP plot cells are colored according to the pseudotime and the 2 trajectories are labeled based on the terminal cell state (Term/SenL and Act). (C) Line plots showing the smoothed gene expression of genes that are differentially expressed (patternTest) over the different pseudotime trajectories defined in panels A and B. (D) Heatmap of smoothed gene expression of the DEGs obtained using patternTest along the 2 pseudotime trajectories. Depicted on the right are selected genes among the differentially expressed. (E-F) UMAP colored by the annotated CD8+ subsets overlaid with the predicted RNA velocity stream (E) and with inferred latent time trajectories (F) obtained using partition-based graph abstractions (PAGA).
Divergent dynamic changes of CD8+ BM T cells. (A-B) UMAP (A) and box plots (B) depicting 2 predicted developmental trajectories inferred via Slingshot. In the UMAP plot cells are colored according to the pseudotime and the 2 trajectories are labeled based on the terminal cell state (Term/SenL and Act). (C) Line plots showing the smoothed gene expression of genes that are differentially expressed (patternTest) over the different pseudotime trajectories defined in panels A and B. (D) Heatmap of smoothed gene expression of the DEGs obtained using patternTest along the 2 pseudotime trajectories. Depicted on the right are selected genes among the differentially expressed. (E-F) UMAP colored by the annotated CD8+ subsets overlaid with the predicted RNA velocity stream (E) and with inferred latent time trajectories (F) obtained using partition-based graph abstractions (PAGA).
Clonotype analysis reveals the presence of a senescence-like skewed clonal expansion
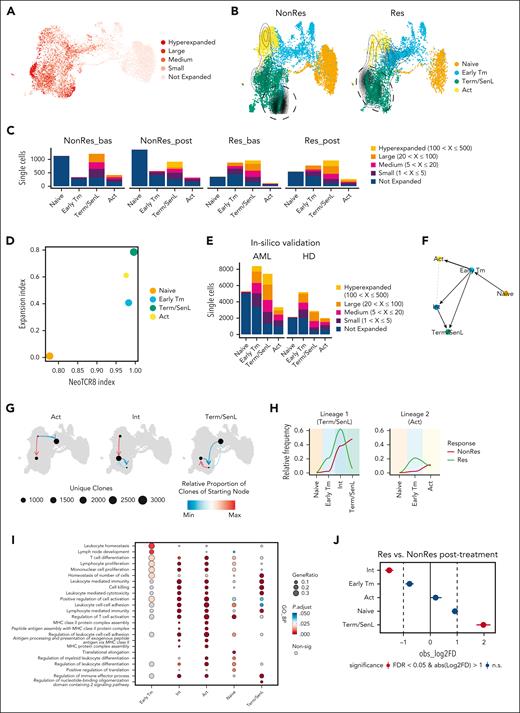
Next, analyzing our TCRseq data, we classified single cells according to the T-cell clone size (Figure 6A). Hyperexpanded cells overlapped with the Term/SenL subset (Figure 6A-C), with a different distribution between Res and NonRes (Figure 6B). To address whether the SenL state could be induced by blast exposure, we aimed to identify tumor-reactive CD8+ T cells using signatures of CD8+ neoantigen-reactive tumor-infiltrating lymphocytes known as NeoTCR8.39 Combining the NeoTCR8 and clonal expansion indexes, we found that Term/SenL cells exhibited the highest values for both indexes (Figure 6D). This observation persisted even after excluding known antigen specificities present in the VDJ database (VDJdb; supplemental Figure 9).40 Analysis of independent data sets27,30 confirmed a biased clonal expansion of Term/SenL cell states in patients with AML, contrasting with the uniform and less pronounced clonal expansion observed across CD8+ subsets in HDs (Figure 6E). Collectively, the results suggest the possibility that Term/SenL harbors AML–specific CD8+ T cells, but further work is needed to substantiate this interpretation of the data.
Term/SenL clonal expansion skewing associates with nonresponse to therapy. (A) UMAP color-coded by clonal frequency ranges: hyperexpanded (100 < X ≤ 500), large (20 < X ≤ 100), medium (5 < X ≤ 20), small (1 < X ≤ 5), not expanded (0 < X ≤ 1). (B) UMAP color-coded by CD8+ subsets, split by group (NonRes and Res); contours indicate clonally expanded cells (at least 30 cells with the same clonotype). Dashed lines show most clonally expanded cells in NonRes (left) and Res (right). (C) Stacked plot showing cell count for each cluster in specific clonal frequency ranges for NonRes/Res groups and time points (bas and post). Colors indicate the clonal frequencies. (D) Scatterplot showing the expansion index and the NeoTCR8 index of CD8+ T-cell subsets. Dot size represents cell count in log10 scale. (E) Stacked plot from published data sets (Lasry et al30 and Penter et al27; in-silico validation) showing cell counts for clusters assigned to specific clonal frequency ranges for AML and HD groups. (F) Latent time trajectories computed using PAGA, predicting transitions between the CD8+ subsets. (G) UMAP plots showing the clonotype network interactions for Act, Int, and Term/SenL, indicating relative proportion of clones from starting node to ending node. (H) Line plots showing clonal expansion of the largest T-cell clones (hyperexpanded and large) along the Slingshot-computed differentiation trajectories. (I) Dot plot showing gene ontology biological process (GO BP) enrichment analysis for Early Tm, Int, Act, naïve, and Term/SenL. (J) Point-range plot showing pairwise (Res vs NonRes after treatment) proportional difference (Monte Carlo/permutation test) for each CD8+ T-cell subset. The colors indicate the statistical significance (red, FDR < 0.05; blue, FDR ≥ 0.05); the vertical dashed lines mark the absolute value of log2FD cutoff for significance. bas, baseline; post, post-induction therapy.
Term/SenL clonal expansion skewing associates with nonresponse to therapy. (A) UMAP color-coded by clonal frequency ranges: hyperexpanded (100 < X ≤ 500), large (20 < X ≤ 100), medium (5 < X ≤ 20), small (1 < X ≤ 5), not expanded (0 < X ≤ 1). (B) UMAP color-coded by CD8+ subsets, split by group (NonRes and Res); contours indicate clonally expanded cells (at least 30 cells with the same clonotype). Dashed lines show most clonally expanded cells in NonRes (left) and Res (right). (C) Stacked plot showing cell count for each cluster in specific clonal frequency ranges for NonRes/Res groups and time points (bas and post). Colors indicate the clonal frequencies. (D) Scatterplot showing the expansion index and the NeoTCR8 index of CD8+ T-cell subsets. Dot size represents cell count in log10 scale. (E) Stacked plot from published data sets (Lasry et al30 and Penter et al27; in-silico validation) showing cell counts for clusters assigned to specific clonal frequency ranges for AML and HD groups. (F) Latent time trajectories computed using PAGA, predicting transitions between the CD8+ subsets. (G) UMAP plots showing the clonotype network interactions for Act, Int, and Term/SenL, indicating relative proportion of clones from starting node to ending node. (H) Line plots showing clonal expansion of the largest T-cell clones (hyperexpanded and large) along the Slingshot-computed differentiation trajectories. (I) Dot plot showing gene ontology biological process (GO BP) enrichment analysis for Early Tm, Int, Act, naïve, and Term/SenL. (J) Point-range plot showing pairwise (Res vs NonRes after treatment) proportional difference (Monte Carlo/permutation test) for each CD8+ T-cell subset. The colors indicate the statistical significance (red, FDR < 0.05; blue, FDR ≥ 0.05); the vertical dashed lines mark the absolute value of log2FD cutoff for significance. bas, baseline; post, post-induction therapy.
Given the presence of clonally expanded Term/SenL cells mapping in different UMAP coordinates in NonRes compared with Res (Figure 6B, dashed lines), we asked whether these 2 distinct subsets reflect different CD8+ T-cell differentiation states with unique transcriptional features. To explore this scenario, we used scVelo37 and partition-based graph abstractions38 that confirmed the bifurcated differentiation and unveiled a potential transitional Int state differentiating into Term/SenL cells (Figure 6F; supplemental Figure 10A). This finding was supported by the STARTRAC41 method, in which cells in the Int state displayed the highest transition score (supplemental Figure 10B).
Next, we investigated the network of clonotypes shared between the CD8+ T-cell states. Int exhibited interactions with both Act and Term/SenL, whereas Act and Term/SenL did not directly interact, suggesting the transitional nature of Int and corroborating Act and Term/SenL as 2 terminal states of a bifurcated trajectory (Figure 6G). To correlate clonal expansion with differentiation trajectories in Res and NonRes, we examined the largest T-cell clones (Large, Hyperexpanded) and traced clonal expansion along the 2 lineages (lineage 1: naïve -> Early Tm -> Int -> Term/SenL; lineage 2: naïve -> Early Tm -> Act). This analysis showed a preferential clonal expansion along lineage 1. In Res, Early Tm and Int were preferentially clonally expanded, whereas in NonRes, Term/SenL exhibited the highest degree of clonal expansion (Figure 6H).
To infer CD8+ T-cell subsets’ functionality, we used enrichment analysis that revealed significantly enriched signatures of proliferation in Act and Int compared with Term/SenL, reinforcing the notion that the latter represents the genuine terminal state, incapable of further transitioning into other T-cell states (Figure 6I). Furthermore, Int expressed increased levels of CX3CR1 compared with Term/SenL, a marker associated with transitional proliferating CD8+ T cells (supplemental Figure 10C).9 Finally, DA analysis showed that Term/SenL was increased in NonRes after treatment, whereas Int was significantly increased in Res after treatment (Figure 6J).
Overall, these findings suggest that blast persistence induces the differentiation of CD8+ T cells into a terminal nonproliferative state, whereas clonally expanded Early Tm and Int are associated with blast clearance.
Spectral flow cytometry validates phenotype, cell state dynamic transitions, and clinical relevance of BM CD8+ T-cell subsets
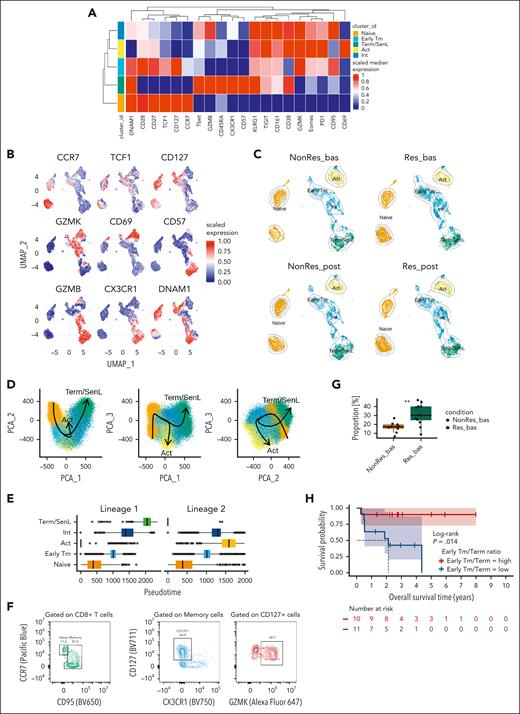
We designed a 26-color spectral flow cytometry panel to validate CD8+ T-cell phenotypes and analyzed 23 consecutive patients with AML at baseline and after treatment (supplemental Table 4). Flow self-organizing maps metaclustering identified 5 major CD8+ T-cell subsets (Figure 7A). naïve CD8+ T cells expressed canonical naïve markers (Figure 7A-C). The Early Tm subset, as in scRNAseq, coexpressed GZMK and CD127, along with other stem-like markers and inhibitory receptors (Figure 7A). The Act cluster expressed activation markers. Interestingly, the putative Int subpopulation shared some phenotypic features with Act but lacked CD69, while expressing GZMB and Tbet. It did not exhibit terminal differentiation/senescence markers (Figure 7A), suggesting that this subset was an Int state between Early Tm and Term/SenL cells, likely corresponding to the Int subset identified by scRNAseq. To formally prove this, we used the scaled median expression (Figure 7A) to classify Int markers as positive (scaled median expression, 0.5-1) and negative (scaled median expression <0.5; supplemental Table 8). With this spectral flow cytometry–defined set of markers, we built an Int gene signature score with scGate42 and finally mapped the subset of interest onto our CD8+ T-cell scRNAseq 2D UMAP. This approach demonstrated a correspondence between the Int subsets at the transcriptional and protein level (supplemental Figure 11A-B). The subset expressing GZMB, CX3CR1, KLRG1, and CD57 was labeled Term/SenL (Figure 7A). Next, Slingshot validated the trajectory divergence found in scRNAseq (Figure 7D-E; supplemental Figure 12): (1) naïve -> Early Tm -> Act; (2) naïve -> Early Tm -> Int -> Term/SenL.
Characterization of CD8+ BM T cells in AML at the protein level and importance of Early Tm/Term imbalance. (A) Heatmap with the fluorescence intensity values of 20 markers across 5 CD8+ BM subsets: naïve (CCR7, CD27, CD28, CD127, and TCF1), Early Tm (CD27, CD28, TCF1, GZMK, CD127, PD-1, and TIGIT), Act (CD38, CD69, GZMK, PD1, and TIGIT), Int (GZMB and Tbet), and Term/SenL (CD57, KLRG1, CX3CR1, and GZMB). Median marker expression identifies the markers that characterize each CD8+ T-cell subset. (B) UMAP plots color-coded by selected single markers’ expression. (C) UMAP plots color-coded by subsets defined in panel A, split by groups and time points. (D) PCA depicting 2 predicted developmental trajectories via Slingshot, colored by CD8+ subsets for the first 3 principal components. In each pairwise combination (PCA_1-PCA_2, PCA_1-PCA_3, and PCA_2-PCA_3), the CD8+ T-cell differentiation path originates from the naïve subset and diverges after the Early Tm subset. The trajectories lead to 2 terminal end states: Act and Term/SenL. (E) Box plot showing the distribution of the CD8+ T-cell subsets along the inferred trajectories. (F) Contour plots illustrating Early Tm subset gating and percentage among memory CD8+ T cells. (G) Box plot showing proportion of the Early Tm subset in Res and NonRes at bas. Statistical significance was examined using a 2-sample Student t test. (H) Kaplan-Meier estimates of OS by high vs low Early Tm/Term ratio calculated using the median split. Statistical significance was calculated using the log-rank test. PCA, principal component analysis.
Characterization of CD8+ BM T cells in AML at the protein level and importance of Early Tm/Term imbalance. (A) Heatmap with the fluorescence intensity values of 20 markers across 5 CD8+ BM subsets: naïve (CCR7, CD27, CD28, CD127, and TCF1), Early Tm (CD27, CD28, TCF1, GZMK, CD127, PD-1, and TIGIT), Act (CD38, CD69, GZMK, PD1, and TIGIT), Int (GZMB and Tbet), and Term/SenL (CD57, KLRG1, CX3CR1, and GZMB). Median marker expression identifies the markers that characterize each CD8+ T-cell subset. (B) UMAP plots color-coded by selected single markers’ expression. (C) UMAP plots color-coded by subsets defined in panel A, split by groups and time points. (D) PCA depicting 2 predicted developmental trajectories via Slingshot, colored by CD8+ subsets for the first 3 principal components. In each pairwise combination (PCA_1-PCA_2, PCA_1-PCA_3, and PCA_2-PCA_3), the CD8+ T-cell differentiation path originates from the naïve subset and diverges after the Early Tm subset. The trajectories lead to 2 terminal end states: Act and Term/SenL. (E) Box plot showing the distribution of the CD8+ T-cell subsets along the inferred trajectories. (F) Contour plots illustrating Early Tm subset gating and percentage among memory CD8+ T cells. (G) Box plot showing proportion of the Early Tm subset in Res and NonRes at bas. Statistical significance was examined using a 2-sample Student t test. (H) Kaplan-Meier estimates of OS by high vs low Early Tm/Term ratio calculated using the median split. Statistical significance was calculated using the log-rank test. PCA, principal component analysis.
Finally, we studied the association between Early Tm abundance and Early Tm/Term ratio at baseline and clinical outcomes. Because Early Tm was the only memory subset coexpressing GZMK and CD127 (Figure 7A), we leveraged these features to manually gate the Early Tm cells (Figure 7F) and calculate their percentage among the memory cells. Early Tm frequency was increased (P < .01) at baseline in Res compared with NonRes (Figure 7G). These findings confirm that Early Tm frequency at baseline is associated with response in patients with AML treated with curative intent. Given our scRNAseq and spectral flow cytometry findings, we tested the hypothesis that an increased Early Tm-to-Term ratio correlates with better outcomes and found that patients with a higher ratio (above the median) at baseline had a significantly improved OS (P = .014; Figure 7H).
Discussion
T-cell mechanisms influencing therapeutic response and resistance in AML are incompletely understood. Previous studies identified dysfunctional T-cell states in AML,3,14,15,43,44 however, an in-depth study of their gene expression, and relationships is lacking. Here, we fill this knowledge gap by presenting novel insights into BM T-cell differentiation in patients with newly diagnosed AML undergoing induction therapy.
Using a multimodal approach, we revealed 4 CD8+ T-cell subsets in patients with AML: naïve, Early Tm, Act, and Term/SenL. Early Tm cells, associated with induction response, bifurcate into Act and Term/SenL. Early Tm cells likely persist long term in Res but are reduced in favor of Term/SenL in NonRes, supporting previous evidence of early memory subsets with stem-like features associated with treatment response.8,12 Term/SenL cells exhibited dysfunction and NK-like signatures, suggesting chronic antigen exposure.13 Recent research described a terminally differentiated NK-like exhausted CD8+ subset.45,46 In solid tumors, T-cell exhaustion has been described as the main mechanism of T-cell dysfunction. However, exhausted CD8+ T cells were scarcely represented in our data sets, suggesting other potential mechanisms of dysfunction. These results mirror findings27 suggesting that BM T-cell exhaustion is less likely to occur in AML compared with solid tumors and point to CD8+ senescence-like skewing as a dominant mechanism of T-cell dysfunction in AML.
Recently, Daniel et al45 identified NK-like biased, terminally exhausted biased, and divergent TCR clones (present in both terminally exhausted and NK-like cells) in murine samples. Analyzing ours and large-scale paired scRNAseq/TCRseq data,4,23,27,30 we found a Term/SenL skewed clonal expansion in patients with AML compared with HDs. Additionally, cells with SenL signatures demonstrated the highest expansion and NeoTCR8 indexes, suggesting that chronic exposure to AML blasts potentially drives this dysfunctional phenotype. This is consistent with our previous findings of impaired killing abilities of AML–induced CD8+CD57+ T cells against autologous blasts.14 Herein, we discovered 2 main T-cell subsets expressing NK markers (Int and Term/SenL), with a previously unrecognized differentiation trajectory from Int to a terminally differentiated SenL state at both transcriptional and protein level.
After antigen exposure, naïve CD8+ T cells can differentiate into KLRG1+IL7Rlo short-lived effector cells (SLECs) that clonally expand, proliferate, and die as they clear the antigen.47 Conceivably, in chronic states such as infections or tumors, SLECs may persist due to repeated antigen exposure48 and differentiate into KLRG1+CD57+ senescent CD8+ T cells.47 The transcriptional similarity between Int and SLEC subsets (supplemental Figure 13) suggests that Int cells are a transitional state that can differentiate into Term/SenL after chronic antigen exposure. The Term/SenL subset was increased in NonRes compared with Res, indicating its likely involvement in the promotion of immune dysfunction. These findings support a model in which Early Tm in Res differentiate into Int cells that mediate immune-surveillance; conversely, in NonRes, a senescence differentiation skewing leads to ineffective immune control. A high Early Tm/Term ratio at diagnosis correlates with improved OS, suggesting that less differentiated CD8+ T cells are crucial for inducing and maintaining response. Furthermore, our data reveal a reduced ratio in ELN intermediate and adverse risk AML, indicating that the molecular and cytogenetic profile of AML blasts influence the composition of the immune microenvironment. Interestingly, the Early Tm/Term ratio maintains its predictive power independently of age and clinical risk classification in a multivariable model, suggesting its potential utility in prognostic models.
Our findings, although constrained by the sample size, are supported by robust evidence from larger cohorts, emphasizing the role of CD8+ T-cell subsets in AML induction response. Although we acknowledge that an inherent limitation of our study could be the exclusive focus on T cells, the adoption of a T-cell sorting strategy enabled a thorough evaluation of T-cell differentiation in the AML microenvironment.
In conclusion, CD8+ T-cell dysfunction plays a crucial role in dictating the outcomes of patients with AML, and a low Early Tm/Term ratio is a strong predictor of adverse outcomes. We propose that senescence could be a primary mechanism underpinning CD8+ T-cell dysfunction in AML, accounting for the unsatisfactory responses to ICB therapy observed thus far.3,5,14 Although advocating that targeting early memory functional T-cell expansion and overcoming T-cell senescence could lead to enduring AML remissions, we recognize that caution is needed for transformative clinical applications. Our study lays a critical foundation and may guide future rigorous clinical trials by offering a roadmap for immune-based interventions.
Acknowledgments
The authors thank all the patients who enrolled in this study. The authors also thank Hao Zhang for his help with fluorescence-activated cell sorting, Brian Lohman for his inputs on the bioinformatic analysis, and the research groups that shared their single-cell RNA sequencing data to validate our findings.
This research collaboration was supported through the Immunotherapy Centers of Research Excellence network on behalf of Genentech. Additional support was received from The Rotary Foundation through a Global Grant (F.M.). This work was funded by the National Institutes of Health/National Cancer Institute (P01CA225618 [L.L.]) and Genentech-imCORE (ML40354 [L.L.]).
Authorship
Contribution: F.M., I.G., and L.L. conceived and designed the study; R.M. and S.C. processed human BM samples; F.M., L.B., S.R., N.B., S.P., and H.H. performed computational and statistical analyses; F.M. analyzed the data; I.G. provided human BM samples; H.A.K., J.R., and I.G. provided clinical information on patients with acute myeloid leukemia; F.M. and L.L. wrote the manuscript with input from L.B., J.R., S.R., I.M.B., B.R.B., K.H., P.V., and I.G.
Conflict-of-interest disclosure: N.B. is an employee of Omniscope, Inc, and in the past 12 months has consulted for Santa Ana Bio and Starling Biosciences. K.H. is an employee of Genentech, Inc, and holds equity/stock in F. Hoffmann-La Roche Ltd/Genentech, Inc. The remaining authors declare no competing financial interests.
Correspondence: Leo Luznik, Johns Hopkins University School of Medicine, 1650 Orleans Street, Baltimore, MD 21287; email: luznile@jhmi.edu.
References
Author notes
Per Johns Hopkins University policies, anonymized data are available to approved researchers via the European Genome-Phenome Archive (EGAS50000000357) under a data use agreement.
For further information, please contact authors Francesco Mazziotta (fmazzio1@jh.edu) and Leo Luznik (luznile@jhmi.edu).
The online version of this article contains a data supplement.
There is a Blood Commentary on this article in this issue.
The publication costs of this article were defrayed in part by page charge payment. Therefore, and solely to indicate this fact, this article is hereby marked “advertisement” in accordance with 18 USC section 1734.

This feature is available to Subscribers Only
Sign In or Create an Account Close Modal