

Key Points
Patients with pES have shared broad immune anomalies irrespective of the underlying genetic etiology and functional status of B cells.
Expanded cTfh, low naïve CD4 and CSMB, and increased T-cell activation are unique features of pES and distinguish pES from cITP.

Abstract
Pediatric Evans syndrome (pES) is increasingly identified as the presenting manifestation of several inborn errors of immunity. Despite an improved understanding of genetic defects in pES, the underlying immunobiology of pES is poorly defined, and characteristic diagnostic immune parameters are lacking. We describe the immune characteristics of 24 patients with pES and compared them with 22 patients with chronic immune thrombocytopenia (cITP) and 24 healthy controls (HCs). Compared with patients with cITP and HC, patients with pES had increased circulating T-follicular helper cells (cTfh), increased T-cell activation, and decreased naïve CD4+ T cells for age. Despite normal or high immunoglobulin G (IgG) in most pES at presentation, class-switched memory B cells were decreased. Within the cTfh subset, we noted features of postactivation exhaustion with upregulation of several canonical checkpoint inhibitors. T-cell receptor β chain (TCR-β) repertoire analysis of cTfh cells revealed increased oligoclonality in patients with pES compared with HCs. Among patients with pES, those without a known gene defect had a similar characteristic immune abnormality as patients with defined genetic defects. Similarly, patients with pES with normal IgG had similar T-cell abnormalities as patients with low IgG. Because genetic defects have been identified in less than half of patients with pES, our findings of similar immune abnormalities across all patients with pES help establish a common characteristic immunopathology in pES, irrespective of the underlying genetic etiology.
Introduction
Evans syndrome (ES) is a rare hematologic disorder characterized by the co-occurrence of autoimmune hemolytic anemia and immune thrombocytopenia (ITP) either sequentially or simultaneously.1,2 Since its first description in 1951 by Evans et al,1 the classical definition has evolved to include autoimmune neutropenia.3 Currently, ES is broadly defined as evidence of immune cytopenia affecting any 2 lineages.3,4 Additionally, for making the diagnosis of ES, the evidence of positive Coombs test without obvious hemolysis is accepted as evidence of red cell lineage involvement.4,5
Increasingly, pediatric ES (pES) has been identified as the presenting manifestation of underlying inborn errors of immunity.6-8 The occurrence of significant immune deficiency, lymphoproliferation, and other autoimmune manifestations are reminiscent of ES as a broader immune disorder than an isolated hematologic disorder.9,10 Advances in sequencing technologies such as customized next-generation sequencing panels and whole-exome sequencing have greatly helped identify the underlying genetic defects associated with inborn errors of immunity and pES.7,11-14 In a recent study of 80 patients with pES, 40% were found to have monogenic defects in genes involved in the immune regulatory pathway, such as TNFRSF6, CTLA4, STAT3, PIK3CD, CBL, ADAR1, LRBA, RAG1, and KRAS genes.15 However, most patients with pES had no known genetic defect. Despite the advances in the genetic diagnosis of pES, it is unknown whether patients with pES without an identified genetic defect are at the same risk of immunodeficiency and immune dysregulation as those with known defects in the immune regulatory pathway. Additionally, the immune abnormalities that define pES, regardless of genetic mutation status, are poorly understood. Whereas other immune disorders are characterized by certain diagnostic immunologic features such as double-negative T cells in autoimmune lymphoproliferative syndrome, there are currently no defining immune markers for pES.16-18 Immunobiological understanding of pES is critical to define the underlying disease mechanism, predict the patient’s risk of immune complications, and guide treatment strategies.
We, therefore, evaluated various immune markers in patients with pES and compared them with patients with single-lineage cytopenia (ie, chronic immune thrombocytopenia [cITP] and healthy controls [HCs]). High-dimensional immunophenotyping, gene expression analysis, cytokine profile, and TCR-β repertoire studies were used to identify a unique immune signature in pES that distinguishes it from cITP and HCs.
Methods
Human subjects
A total of 24 patients with pES (age, 1-19 years; median, 12 years), 22 patients with cITP (age, 2-20 years; median, 13.5 years), and 24 HCs (age, 1-30; median, 16 years) were evaluated over a 3-year period from 2017 to 2020. Patients were enrolled from Children’s Healthcare of Atlanta, Cincinnati Children’s Hospital Medical Center, and Children's Hospitals and Clinics of Minnesota. The clinical and laboratory tests performed as part of the standard of care for patients with pES and cITP are provided in supplemental Tables 1 and 2, available on the Blood Web site.
Patients with pES and cITP were enrolled either at disease onset or during follow-up with active disease. Patients were excluded if they had previously received rituximab or on systemic immune suppression (steroids, sirolimus, or mycophenolate) in the 3 months before enrollment. Patients with pES and ITP with clinical diagnosis of systemic lupus erythematosus19 or underlying malignancy were excluded. Among patients with pES enrolled in the study, 14 of the 24 were enrolled at disease onset (1-6 weeks), and 10 were enrolled at follow-up with active disease/flare of immune cytopenia (1-6 years from initial diagnosis). Lymphoproliferation (lymphadenopathy or splenomegaly) was noted in 17 of the 24 patients with pES, and 3 patients with pES had pulmonary and gastrointestinal manifestations.
Immunoglobulin profile (immunoglobulin A [IgA], IgG, and IgM) and measurement of the percentage of CD4−CD8− (double-negative) T-cell receptor-αβ+ (TCRαβ+) (DNTCs) cells, T-regulatory (Treg) cells (CD4+CD25+ CD127lowFOXP3), and class-switched memory B cells (CD19+CD27+IgM−IgD−) were performed in Clinical Laboratory Improvement Amendments-certified laboratories at Children’s Healthcare of Atlanta and Diagnostic Immunology Laboratory at Cincinnati Children’s Hospital Medical Center.
As per the Declaration of Helsinki, informed consent was obtained from all subjects.
Genetic evaluation
Genetic testing was performed in all 24 patients with pES (supplemental Table1). Targeted next-generation sequencing was performed in most of the patients with pES (n = 20). In a limited number of patients, whole-exome sequencing (n = 4) was performed.
Flow cytometry
Peripheral blood mononuclear cells from patients were used for immunophenotyping. Antibodies and reagents used are listed in supplemental Table 3. Research flow cytometry data were acquired on BD FACSymphony A5 and analyzed using FlowJo software v10. Definitions of different cell populations used in this study were summarized in supplemental Table 4. Total circulating T-follicular helper cells (cTfh) cells were defined as CD4+CD45RA−CXCR5+. PD-1+ cTfh or cTfh cell populations were used interchangeably and defined as CD4+CD45RA−CXCR5+PD-1+. Because of the broad age range of our patient and control group, age-specific lower limit of the normal was used to normalize CD4+ naïve and class-switched memory B (CSMB) populations in all samples. Absolute percentage of CD4+ naïve and CSMB and cutoffs are provided in supplemental Table 5. FItSNE plots were generated using FItSNE plugin in FlowJo v10.20 Down-sampling was performed by the DownSample V3 plugin in FlowJo v10.
Cell sorting and NanoString assay
CD4+CD127+CD25lowCXCR5+ T cells were sorted using FACSAria II. Total RNA was extracted using Quick-RNA Microprep kit (Zymo Research) per the manufacturer’s protocol. The gene expression profile was determined using the nCounter CAR-T Characterization Panel (NanoString). NanoString assay was performed using 10 ng RNA. Data analysis was performed using NanoString nSolver software v4.0.
TCR-β repertoire and data analysis
RNA extracted from sorted CD4+CD127+CD25lowCXCR5+ T cells was used as starting material for TCR-β sequencing with 20 ng RNA for library preparation. CDR3 regions of the TCR-β chain were amplified using iRepertoire (Huntsville, AL) multiplex polymerase chain reaction primer sets for library preparation. Libraries were sequenced using the Illumina MiSeq reagent v2 (500-cycle) kit. Data were analyzed using iRweb software (iRepertoire). TCR repertoire diversity of cTfh was examined by calculating Shannon's entropy, which accounts for sample richness and degree of unevenness in the clonal frequency. Shannon’s entropy and the diversity index were calculated using iRweb software. Gini index was calculated using “Ineq” package in R. Cytokine profiling and statistical analysis are listed in the supplemental Methods.
Results
cTfh are expanded and activated in pES
pES and cITP are both autoantibody-driven disorders.2 Tfh cells play a critical role in helping B cells regulate the antibody response.21 Dysregulation of cTfh is identified in several autoantibody-driven disorders.22-24 Because of their critical role in regulating B-cell responses, we evaluated cTfh in patients with pES. We noted pES had more than a twofold increase in the percentage of total cTfh (35.11 ± 1.99) compared with patients with cITP (14.61 ± 1.63, P < .0001) and HCs (16.47 ± 0.60, P < .0001; Figure 1A-B). Similarly, a fourfold increase in PD-1+ cTfhs was seen in patients with pES (17.54 ± 1.31) compared with patients with cITP (3.64 ± 0.49, P < .0001) and HCs (3.79 ± 0.43, P < .0001; Figure 1A-C). Analysis of PD-1+ vs PD-1− cTfhs showed a high ratio of PD-1+/PD-1− cTfhs in patients with pES compared with patients with cITP and HCs (Figure 1D). Evaluation of total cTfh for markers of activation (HLA-DR), exhaustion (Tim3), and senescence (CD57) showed increased expression of HLA-DR+, Tim3+, and CD57+ in patients with pES compared with patients with cITP and HCs (Figure 1E-G).
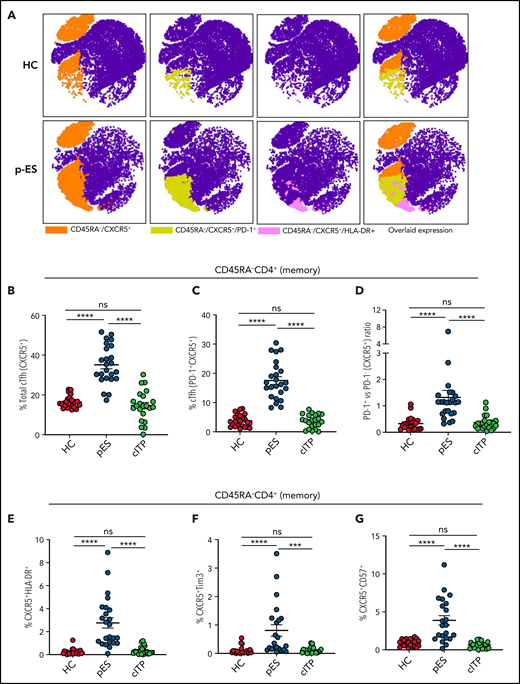
Expansion and activation of cTfh in patients with pES. (A) Representative FItSNE plots showing frequency and activation status of cTfh cells in patient with pES and HC where CD4+ T cells were first manually gated for total memory cells (CD45RA−) and then down-sampled to equal number of cells. CXCR5+ cells were gated on CD45RA−CD4+ T cells and subsequently gated for HLA-DR+ or PD-1+ cells. Expression of cTfh and activation markers on cTfh (ie, PD-1+ and HLA-DR+) are shown in different colors. Overlaid expression of PD-1+, HLA-DR+, and CXCR5+ markers are shown at the extreme right for both HC and pES. (B-C) Plots showing percentage of cTfh as CXCR5+CD45RA−CD4+ T and CXCR5+PD-1+CD45RA−CD4+ T subsets in HCs (n = 24), patients with pES (n = 24), and patients with cITP (n = 22). (D) Plot showing ratio of PD-1+ cTfh vs PD-1− cTfh in HCs, patients with pES, and patients with cITP. (E-G) Percentage of CXCR5+HLA-DR+, CXCR5+Tim3+, and CXCR5+CD57+ expression on total memory CD4+ T cells in different patient groups. Data represent mean ± standard error of the mean (SEM) values for each group. Kruskal-Wallis 1-way analysis of variance (ANOVA) followed by Dunn’s multiple comparison test for nonnormally distributed samples and ordinary 1-way ANOVA followed by Tukey’s multiple comparison test for normally distributed samples were used for statistical comparison. ***P < .001; ****P < .0001; ns, not significant.
Expansion and activation of cTfh in patients with pES. (A) Representative FItSNE plots showing frequency and activation status of cTfh cells in patient with pES and HC where CD4+ T cells were first manually gated for total memory cells (CD45RA−) and then down-sampled to equal number of cells. CXCR5+ cells were gated on CD45RA−CD4+ T cells and subsequently gated for HLA-DR+ or PD-1+ cells. Expression of cTfh and activation markers on cTfh (ie, PD-1+ and HLA-DR+) are shown in different colors. Overlaid expression of PD-1+, HLA-DR+, and CXCR5+ markers are shown at the extreme right for both HC and pES. (B-C) Plots showing percentage of cTfh as CXCR5+CD45RA−CD4+ T and CXCR5+PD-1+CD45RA−CD4+ T subsets in HCs (n = 24), patients with pES (n = 24), and patients with cITP (n = 22). (D) Plot showing ratio of PD-1+ cTfh vs PD-1− cTfh in HCs, patients with pES, and patients with cITP. (E-G) Percentage of CXCR5+HLA-DR+, CXCR5+Tim3+, and CXCR5+CD57+ expression on total memory CD4+ T cells in different patient groups. Data represent mean ± standard error of the mean (SEM) values for each group. Kruskal-Wallis 1-way analysis of variance (ANOVA) followed by Dunn’s multiple comparison test for nonnormally distributed samples and ordinary 1-way ANOVA followed by Tukey’s multiple comparison test for normally distributed samples were used for statistical comparison. ***P < .001; ****P < .0001; ns, not significant.
pES is characterized by decreased naïve CD4+ T cells, increased overall T-cell activation, and decreased class-switched memory B cells
A decrease in CD4+ naïve T cells is a marker of decreased thymic output or perturbation in T-cell development and is noted in immune dysregulation disorders with late-onset combined immune defect or common variable immunodeficiency phenotype.25-29 Similarly, T-cell activation from defective T cell–intrinsic or –extrinsic regulation has been reported in some of these disorders.25-29 Although significant immune deficiency or dysregulation may not be apparent at the onset of pES, we postulated that subclinical immune activation with decreased naïve CD4+ T cells might be present in patients with pES but not in patients with cITP. As hypothesized, we found that CD4+ naïve T cells were decreased in patients with pES compared with HCs and patients with cITP (Figure 2A). A significant increase in activation of effector memory CD4 and CD8 compartments was noted in pES but not in cITP (Figure 2B-C). Despite this significant increase, the overall level of T-cell activation was moderate in pES. Modest elevation of soluble interleukin-2 receptor levels was observed in 6 of 7 tested patients with pES, which further validates T-cell activation state in pES (supplemental Table 1).
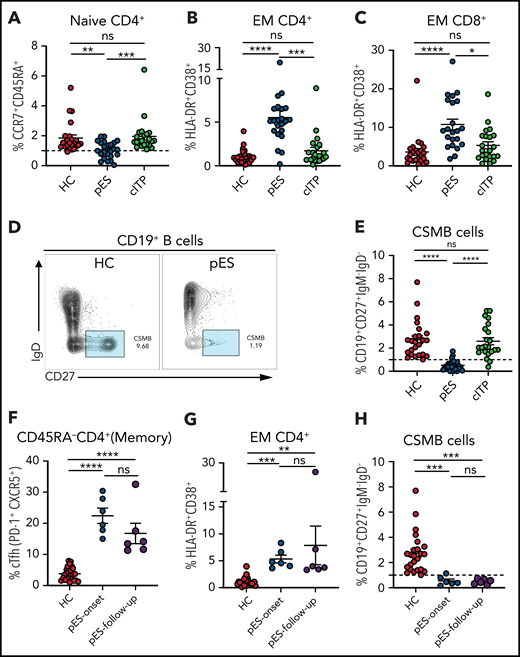
Patients with pES show alterations in different immune compartments of T and B cells. (A) Age-normalized percentage of CD4+ naïve T-cell population in different patient groups. (B-C) Percentage of HLA-DR+CD38+ expression on effector memory compartment of CD4+ and CD8+ T cells in different patient groups. (D) Flow cytometry plots showing expression of CSMB (CD19+CD27+IgM−IgD−) on CD19+ B cells in HC and patient with pES. (E) Percentage of CSMB in HCs (n = 24), patients with pES (n = 24), and patients with cITP (n = 22). (F-H) Plots showing frequency of cTfh, CD4+ T‐cell activation, and CSMB in the longitudinal follow-up of patients with pES (n = 6). Data represent mean ± SEM values for each group. Kruskal-Wallis 1-way ANOVA followed by Dunn’s multiple comparison test for nonnormally distributed samples and ordinary 1-way ANOVA followed by Tukey’s multiple comparison test for normally distributed samples were used for statistical comparison. *P < .05; **P < .01; ***P < .001; ****P < .0001; ns, not significant.
Patients with pES show alterations in different immune compartments of T and B cells. (A) Age-normalized percentage of CD4+ naïve T-cell population in different patient groups. (B-C) Percentage of HLA-DR+CD38+ expression on effector memory compartment of CD4+ and CD8+ T cells in different patient groups. (D) Flow cytometry plots showing expression of CSMB (CD19+CD27+IgM−IgD−) on CD19+ B cells in HC and patient with pES. (E) Percentage of CSMB in HCs (n = 24), patients with pES (n = 24), and patients with cITP (n = 22). (F-H) Plots showing frequency of cTfh, CD4+ T‐cell activation, and CSMB in the longitudinal follow-up of patients with pES (n = 6). Data represent mean ± SEM values for each group. Kruskal-Wallis 1-way ANOVA followed by Dunn’s multiple comparison test for nonnormally distributed samples and ordinary 1-way ANOVA followed by Tukey’s multiple comparison test for normally distributed samples were used for statistical comparison. *P < .05; **P < .01; ***P < .001; ****P < .0001; ns, not significant.
Additionally, we found pES had significantly increased PD-1+Tim3+ expression, suggesting CD4+ and CD8+ T cells display states of activation and exhaustion (supplemental Figure 1A-B). Although there was increased CD57+ expression on effector memory CD4+ and CD8+ T cells in patients with pES compared with HCs, we did not find a significant difference between cITP and pES (supplemental Figure 1C-D). Similarly, we did not find a difference in CD57+ expression on CD4+ and CD8+ T cells (supplemental Figure 1E-F). CD4+/CD8+ ratio was also not different between the groups (supplemental Figure 1G). DNTCs and FOXP3+ Tregs were assessed in some patients. Most patients with pES showed normal frequencies of DNTCs (n = 12 of 15). Decreased absolute numbers of FOXP3+ Tregs (CD4+CD25hiCD127lowFOXP3+) were observed in 4 of 8 patients with pES (supplemental Table 1).
At presentation, most patients with pES had normal or increased IgG and IgA levels for age (63% and 54%, respectively; supplemental Table 1). However, the proportion of CSMB cells was significantly decreased in most patients with pES compared with HCs or patients with cITP (Figure 2D-E).
Longitudinal immune evaluation revealed persistent cTfh expansion and T-cell activation
Six patients with pES who were not on systemic immune suppression were followed longitudinally for 3 to 18 months (median, 8 months) from time of diagnosis. cTfh expansion, CD4+ T‐cell activation , and low CSMB proportions observed at diagnosis were persistent at follow-up evaluation (Figure 2F-H).
T-cell abnormalities in pES are similar irrespective of underlying genetics or humoral immune functional status
Of the 24 patients with pES who underwent genetic testing, 12 were found to have pathogenic or likely pathogenic gene variants and were categorized as pESgene+. The remainder were categorized as pESgene−. cTfh expansion, naïve CD4+, CD4+ T‐cell activation, and CSMB proportions were comparable between patients with pESgene+ and pESgene− (Figure 3A-D).
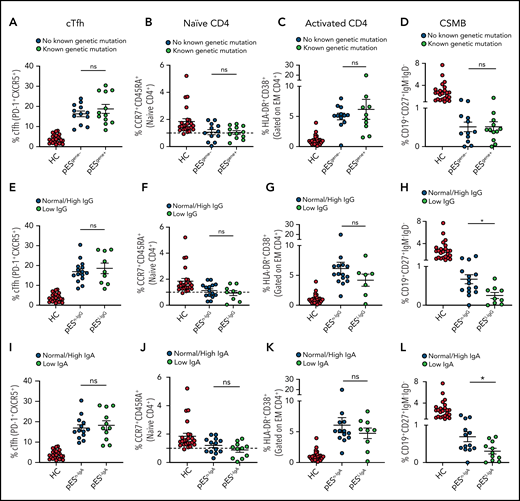
Patients with pES share similar immunophenotype irrespective of genetic and immunoglobulins status. Patients with pES were categorized based on the presence or absence of genetic abnormalities. Plots showing percentage of cTfh (A), CD4+ naïve (B), CD4+ T‐cell activation (C), and CSMB (D) in 2 pES groups based on underlying genetics. Plots showing percentage of cTfh (E), CD4+ naïve (F), CD4+ T‐cell activation (G), and CSMB (H) in patients with pES with normal/high and low IgG levels. Patients with pES were also categorized based on serum IgA levels. Plots showing frequency of cTfh (I), CD4+ naïve (J), CD4+ T-cell activation (K), and CSMB (L) in patients with pES with low serum IgA or normal/high IgA levels. Data represent mean ± SEM values for each group. Mann-Whitney test for nonparametric samples and Student t test for parametric samples were performed for significance. *P < .05; ns, not significant.
Patients with pES share similar immunophenotype irrespective of genetic and immunoglobulins status. Patients with pES were categorized based on the presence or absence of genetic abnormalities. Plots showing percentage of cTfh (A), CD4+ naïve (B), CD4+ T‐cell activation (C), and CSMB (D) in 2 pES groups based on underlying genetics. Plots showing percentage of cTfh (E), CD4+ naïve (F), CD4+ T‐cell activation (G), and CSMB (H) in patients with pES with normal/high and low IgG levels. Patients with pES were also categorized based on serum IgA levels. Plots showing frequency of cTfh (I), CD4+ naïve (J), CD4+ T-cell activation (K), and CSMB (L) in patients with pES with low serum IgA or normal/high IgA levels. Data represent mean ± SEM values for each group. Mann-Whitney test for nonparametric samples and Student t test for parametric samples were performed for significance. *P < .05; ns, not significant.
Based on serum IgG levels, patients with pES were also categorized as having normal/high IgG (pESn-IgG) or low IgG (pESl-IgG) levels. The percentage of cTfh, naïve CD4+, and CD4+ T-cell activation were also similar in both groups. Both groups showed low proportions of CSMB cells compared with HCs. However, the percentage of CSMB was lower for pESl-IgG compared with pESn-IgG (Figure 3E-H). Similarly, patients were categorized based on levels of serum IgA (pESn-IgA and pESl-IgA). The frequency of cTfh, naïve CD4+, and CD4+ T-cell activation was comparable between the 2 groups, but patients with pESl-IgA showed a more pronounced decrease in CSMB than patients with pESn-IgA (Figure 3I-L).
pES and cITP have a distinct immune profile, and a scoring system could identify broad immune abnormalities in pES
To further validate the overlap of immune profiles among patient groups, we performed principal component analysis (PCA) of immune phenotypic markers on different populations. PCA revealed that patients with cITP overlap with HCs, but patients with pES were clearly distinct from cITP and HCs, suggesting that the immunophenotype of pES is different from cITP (Figure 4A). Also, heatmap analysis of immune parameters discussed above further confirmed that pES is immunologically distinct from cITP (Figure 4B).
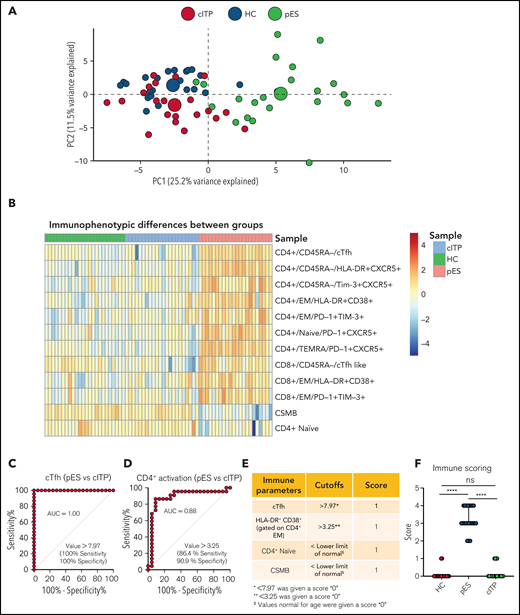
Multidimensional immunophenotyping distinguishes patients with pES from patients with cITP. (A) PCA analysis depicting the clustering of patients based on the gated populations used in this study. Individuals are represented by small colored circles for each group, whereas overall group is represented by large colored circles. (B) Heat map showing relative similarities and differences of different patient groups based on defined flow parameters. (C-D) ROC curves showing percentage sensitivity and specificity for frequencies of cTfh and HLA-DR+CD38+ on effector memory CD4+ T cells between pES and cITP. (E) Table showing 4 immune parameters, their cutoffs, and scoring information. (F) Scoring of different patient groups based on the sum of 4 immune parameters in HCs (n = 24), patients with pES (n = 22), and patients with cITP (n = 22). Data represent median and 95% confidence interval for each group. Kruskal-Wallis 1-way ANOVA followed by Dunn’s multiple comparison test was used for statistical comparison. *P < .05; **P < .01; ***P < .001; ****P < .0001; ns, not significant.
Multidimensional immunophenotyping distinguishes patients with pES from patients with cITP. (A) PCA analysis depicting the clustering of patients based on the gated populations used in this study. Individuals are represented by small colored circles for each group, whereas overall group is represented by large colored circles. (B) Heat map showing relative similarities and differences of different patient groups based on defined flow parameters. (C-D) ROC curves showing percentage sensitivity and specificity for frequencies of cTfh and HLA-DR+CD38+ on effector memory CD4+ T cells between pES and cITP. (E) Table showing 4 immune parameters, their cutoffs, and scoring information. (F) Scoring of different patient groups based on the sum of 4 immune parameters in HCs (n = 24), patients with pES (n = 22), and patients with cITP (n = 22). Data represent median and 95% confidence interval for each group. Kruskal-Wallis 1-way ANOVA followed by Dunn’s multiple comparison test was used for statistical comparison. *P < .05; **P < .01; ***P < .001; ****P < .0001; ns, not significant.
Receiver operating characteristic (ROC) statistics were used to calculate the area under the ROC curve, sensitivity, specificity, and optimum cutoff thresholds for 20 different immunophenotype parameters (supplemental Table 6). We selected 4 parameters based on the area under the ROC curve, sensitivity, and specificity, and representation of immunologically nonoverlapping phenotypes that could potentially distinguish cITP from pES. Based on these criteria, frequency of cTfh, activated CD4+ T, naïve CD4+ T, and CSMB were selected for scoring. For the percentage of cTfh and activated CD4+ effector memory, values greater than the thresholds were assigned a score of 1, with lower values assigned a score of 0 (Figure 4C-D). Age-specific reference ranges were used for scoring naïve CD4+ T and CSMB populations, values below the lower limit of different age-specific reference ranges were given a score of 1, and otherwise they were assigned a score of 0. Finally, a sum of all 4 parameters was calculated for each subject. Using a scoring system based on these parameters, patients with pES had a median score of 3 (range, 2-4), whereas patients with cITP and HCs had a median score of 0 (range, 0-1 for patients with cITP and HCs; Figure 4E-F).
Early commitment for cTfh differentiation, preferential expansion of cTfh, and nonlineage restriction are characteristic of pES
Because cTfh was noted to be a distinguishing feature of pES, further analysis of cTfh differentiation was done. To assess whether increased cTfhs are because of early lineage commitment and preferential expansion leading to accelerated senescence, we evaluated cTfhs in CD4+ naïve and T effector memory re-expresses CD45RA (TEMRA) compartments . We observed significant expansion of cTfh in both naïve and TEMRA subsets in pES but not in cITP (Figure 5A-D). Comparing cTfh frequencies in naïve, memory, and TEMRA compartments of CD4+ T cells showed a progressive increase in percentages of cTfhs from naïve to memory and from memory to TEMRA in patients with pES but not in patients with cITP or HCs (Figure 5E). We also observed cTfh-like cells in the CD8+ T-cell compartment. The percentage of cTfh-like cells in different CD8+ T-cell compartments was significantly higher in pES (Figure 5F).
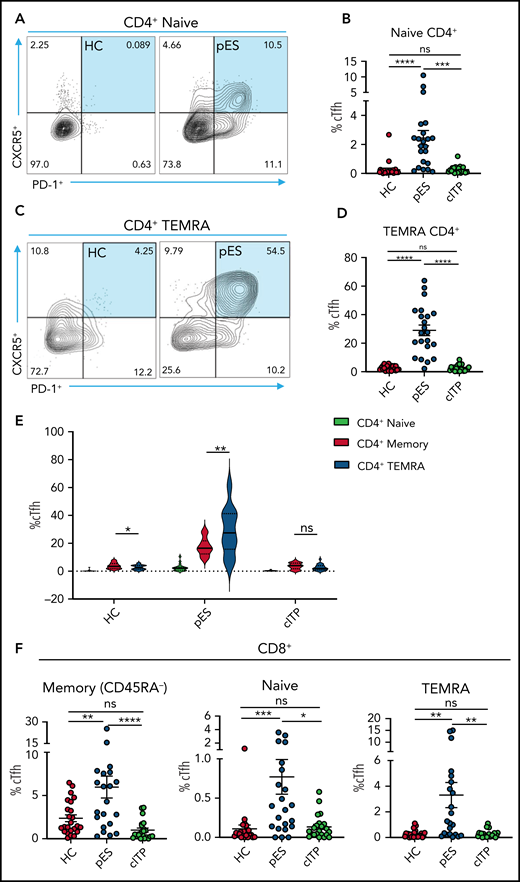
Increased cTfh percentage in naïve and TEMRA compartments of CD4+ T cells and cTfh-like cells in CD8+ T cells. (A) Flow cytometry plots showing expression of cTfh (CXCR5+PD-1+) on naïve CD4+ T cells in 1 HC and 1 patient with pES. (B) Percentage of cTfh cells in naïve CD4+ T cells in HCs (n = 24), patients with pES (n = 22), and patients with cITP (n = 22). (C) Flow cytometry plots showing expression of cTfh (CXCR5+PD-1+) on TEMRA CD4+ T cells in 1 HC and 1 patient with pES. (D) Percentage of cTfh cells in TEMRA CD4+ T cells in HCs (n = 24), patients with pES (n = 22), and patients with cITP (n = 22). (E) Violin plot showing percentage of cTfh in naïve, memory, and TEMRA compartments of CD4+ T cells in different patient groups. (F) Percentage of cTfh (CXCR5+PD-1+) gated on naïve, memory, and TEMRA CD8+ T cells in HCs (n = 24), patients with pES (n = 22), and patients with cITP (n = 22). Data represent mean ± SEM values for each group. Kruskal-Wallis 1-way ANOVA followed by Dunn’s multiple comparison test for nonnormally distributed samples and ordinary 1-way ANOVA followed by Tukey’s multiple comparison test for normally distributed samples were used for statistical comparison. *P < .05; **P < .01; ***P < .001; ****P < .0001; ns, not significant.
Increased cTfh percentage in naïve and TEMRA compartments of CD4+ T cells and cTfh-like cells in CD8+ T cells. (A) Flow cytometry plots showing expression of cTfh (CXCR5+PD-1+) on naïve CD4+ T cells in 1 HC and 1 patient with pES. (B) Percentage of cTfh cells in naïve CD4+ T cells in HCs (n = 24), patients with pES (n = 22), and patients with cITP (n = 22). (C) Flow cytometry plots showing expression of cTfh (CXCR5+PD-1+) on TEMRA CD4+ T cells in 1 HC and 1 patient with pES. (D) Percentage of cTfh cells in TEMRA CD4+ T cells in HCs (n = 24), patients with pES (n = 22), and patients with cITP (n = 22). (E) Violin plot showing percentage of cTfh in naïve, memory, and TEMRA compartments of CD4+ T cells in different patient groups. (F) Percentage of cTfh (CXCR5+PD-1+) gated on naïve, memory, and TEMRA CD8+ T cells in HCs (n = 24), patients with pES (n = 22), and patients with cITP (n = 22). Data represent mean ± SEM values for each group. Kruskal-Wallis 1-way ANOVA followed by Dunn’s multiple comparison test for nonnormally distributed samples and ordinary 1-way ANOVA followed by Tukey’s multiple comparison test for normally distributed samples were used for statistical comparison. *P < .05; **P < .01; ***P < .001; ****P < .0001; ns, not significant.
Based on CXCR3 and CCR6 expression, cTfh was subdivided into 4 groups: cTfh1 (CXCR3+CCR6−), cTfh2 (CXCR3−CCR6−), cTfh1/17 (CXCR3+CCR6+), and cTfh17 (CXCR3−CCR6+). cTfh1 was significantly increased in patients with pES, whereas cTfh17 was significantly decreased in patients with pES compared with patients with cITP and HCs. Conversely, the proportion of cTfh2 cells was similar among these groups (supplemental Figure 2).
Gene expression profiling of cTfh in pES shows dysregulation characterized by upregulation of activation, proliferation, and exhaustion
To gain further insights into the molecular mechanisms leading to highly activated and exhausted states of cTfh in pES, we analyzed gene expression changes between 4 randomly selected patients with pES and HCs. Of 780 mRNA transcripts evaluated, there were several differentially expressed genes (77 upregulated and 32 downregulated; fold change > or <1.2; P < .05) between patients with pES and HCs (Figure 6A-C). Similar to flow cytometry data, several activation marker transcripts such as ICOS, HLA-DRA, HLA-DRB1, TNFRSF4, TNFRSF18, and NFKBIA were upregulated. In addition to activation markers, upregulation of proliferation marker MKI67 was also observed. Several exhaustion markers, including LAG3, CTLA4, TOX, and TNFRSF9, were also upregulated in pES. We observed that cTfh in pES showed upregulation of important effector molecules such as IFNG, GZMK, GZMA, interleukin 10 (IL-10 ), and IL-12A. These data suggest that cTfh cells are not only activated in these patients but also express markers of effector function. However, despite several markers of activation, the expression of CD40 and CD40LG was downregulated in pES. In addition, chemokines CCL7 and CCL2 were increased, whereas chemokine receptors CCR7 and CCR6 were decreased in pES.
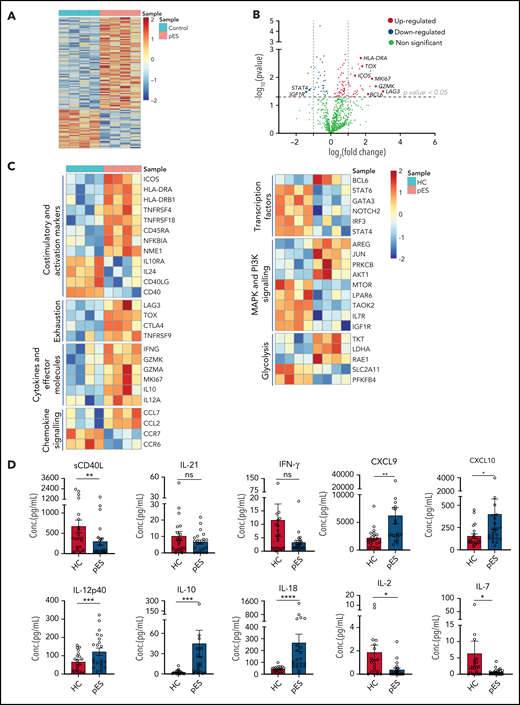
Gene expression analysis of cTfh population shows upregulation of activation, effector, and exhaustion markers in patients with pES. (A) Heat map showing differentially expressed genes in patients with pES (n = 4) compared with HCs (n = 4). (B) Volcano plot showing few upregulated and downregulated genes with fold change either >2 or <0.5 and P < .05 in patients with pES. (C) Heatmaps showing gene expression changes categorized based on gene annotation categories of T cells in patients with pES compared with control samples. (D) Bar plots showing plasma concentration of sCD40L, IL-21, IFN-γ, CXCL9, CXCL10, IL-12p40, IL-10, IL-18, IL-2, and IL-7 in healthy (n = 20) and pES (n = 22) samples. Data represent mean ± SEM values for each group. Mann-Whitney test for nonparametric samples and Student t test for parametric samples were performed for significance. *P < .05; **P < .01; ns, not significant.
Gene expression analysis of cTfh population shows upregulation of activation, effector, and exhaustion markers in patients with pES. (A) Heat map showing differentially expressed genes in patients with pES (n = 4) compared with HCs (n = 4). (B) Volcano plot showing few upregulated and downregulated genes with fold change either >2 or <0.5 and P < .05 in patients with pES. (C) Heatmaps showing gene expression changes categorized based on gene annotation categories of T cells in patients with pES compared with control samples. (D) Bar plots showing plasma concentration of sCD40L, IL-21, IFN-γ, CXCL9, CXCL10, IL-12p40, IL-10, IL-18, IL-2, and IL-7 in healthy (n = 20) and pES (n = 22) samples. Data represent mean ± SEM values for each group. Mann-Whitney test for nonparametric samples and Student t test for parametric samples were performed for significance. *P < .05; **P < .01; ns, not significant.
Bcl6 is an important transcription factor that promotes the differentiation of CD4+ T into cTfh30,31 was upregulated in patients with pES. Interestingly, several other transcription factors such as Signal transducer and activator of transcription 4 (STAT4), Signal transducer and activator of transcription 6 (STAT6), GATA binding protein 3 (GATA3), Neurogenic locus notch homolog protein 2 (NOTCH2), and Interferon regulatory factor 3 (IRF3) were downregulated in pES. Differential transcripts were also noted in MAPK and PI3K signaling and glycolysis (Figure 6C).
To validate some of these findings, we measured levels of critical soluble ligand, cytokines, and chemokines in plasma samples (Figure 6D). Similar to CD40L gene expression in cTfh, we found sCD40L in plasma was significantly low in pES. IL-21 is a known regulator for Tfh differentiation and humoral responses.32 However, we did not find any difference in the levels of IL-21 between patients with pES and HCs. Although serum levels of interferon γ (IFN-γ) were similar between the groups, chemokines induced by IFN-γ (ie, CXCL9 and CXCL10) were significantly increased in patients with pES compared with HCs. In concordance with the gene expression data, IL-12p40, a critical inducer of Th1 differentiation of T cells, was significantly increased. Similar concordance was noted with elevated IL-10 levels in pES. IL-18, a marker of inflammasome activation,33,34 was significantly elevated in pES. Conversely, critical cytokines for Treg and naïve T-cell development, including IL-2 and IL-7,35 were significantly low in patients with pES compared with HCs.
Immune repertoire in pES shows oligoclonal expansion of cTfh
To address whether the expansion of cTfh in pES also leads to changes in the diversity of T-cell repertoire, we performed next-generation sequencing of TCR-β genes of total cTfh cells in 4 randomly selected patients with pES and 4 HCs. Analysis of the TCR-β repertoire showed a significantly higher proportion of the top 50 clones in patients with pES compared with HCs (Figure 7A-B), where the top 50 clones contributed to 65% of the repertoire in patients with pES vs only 38% in HCs. Shannon’s entropy was significantly lower in pES, suggesting the cTfh repertoire is less diverse in pES (Figure 7C). TCR repertoire diversity was further confirmed by the diversity index, which was significantly higher in HCs compared with patients with pES (Figure 7D). Inequality in size of clonotypes across samples was assessed by the Gini coefficient (Figure 7E). As expected, the Gini coefficient was significantly higher in pES, again suggesting that cTfh cells in pES are more oligoclonal. Among different TRBV genes, use of TRBV29-1 was found significantly higher (P < .01) in patients with pES than HCs (Figure 7F). TCR repertoire overlap was analyzed between samples and between groups. We found a greater overlap of CDR3 amino acid sequences within pES samples compared with HCs. Overall, 29 clones were shared in at least 2 of 4 pES samples, whereas only 3 clones were shared in HCs (Figure 7G-H). One clone (SVDRGTGSPEAF) was shared in 3 of 4 patients with pES.
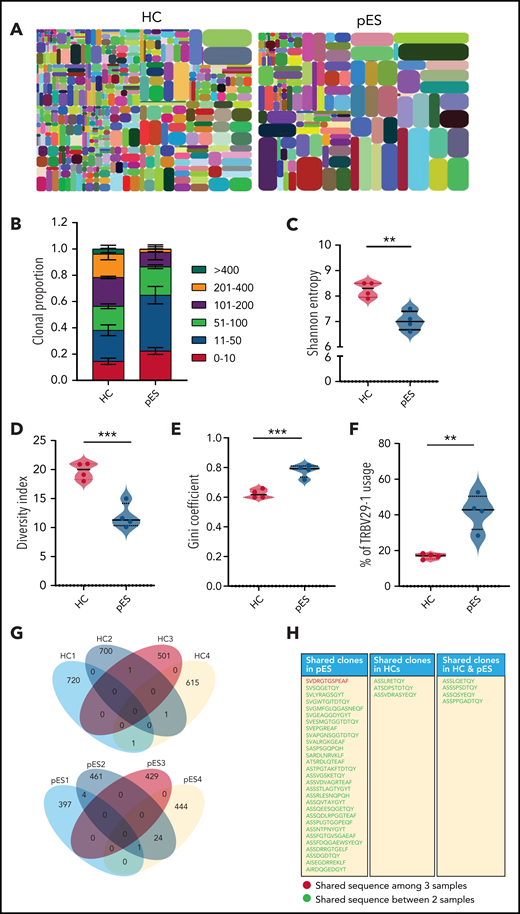
Comparison of TCR-β repertoire of cTfh population in patients with pES and HCs. (A) Representative images of tree maps showing diversity of TCR repertoire in patient with pES and HC. (B) Bar graph showing clonal proportion of TCR-β for top 0 to 10, 11 to 50, 51 to 100, 101 to 200, 201 to 400, and >400 clones. (C-E) Violin plots showing TCR repertoire diversity in terms of Shannon’s entropy, diversity index, and Gini coefficient in samples from patients with pES (n = 4) and HCs (n = 4). (F) Plots showing percentage use of TRBV29-1 in samples from patient with pES (n = 4) and HCs (n = 4). (G) Venn diagram of unique TCR-β aa sequences in samples from patients with pES (n = 4) and HCs (n = 4) showing overlap of TCR repertoire among samples. (H) List showing CDR3 aa sequences shared within patients with pES and HCs, as well as between patients with pES and HCs.
Comparison of TCR-β repertoire of cTfh population in patients with pES and HCs. (A) Representative images of tree maps showing diversity of TCR repertoire in patient with pES and HC. (B) Bar graph showing clonal proportion of TCR-β for top 0 to 10, 11 to 50, 51 to 100, 101 to 200, 201 to 400, and >400 clones. (C-E) Violin plots showing TCR repertoire diversity in terms of Shannon’s entropy, diversity index, and Gini coefficient in samples from patients with pES (n = 4) and HCs (n = 4). (F) Plots showing percentage use of TRBV29-1 in samples from patient with pES (n = 4) and HCs (n = 4). (G) Venn diagram of unique TCR-β aa sequences in samples from patients with pES (n = 4) and HCs (n = 4) showing overlap of TCR repertoire among samples. (H) List showing CDR3 aa sequences shared within patients with pES and HCs, as well as between patients with pES and HCs.
Discussion
Advanced sequencing technologies and increased accessibility to genetic testing have helped to identify the genetic defect in up to 40% of patients with ES.15 Despite rapid strides in our understanding of the genetic basis of pES, the current understanding of the immunobiology and broader immune abnormalities of pES remains limited, and systematic immune studies addressing these questions are lacking. In this study, we describe characteristic immune abnormalities of cTfh expansion, chronic T cell activation, and a decrease in naïve CD4+ and CSMB in patients with pES. Moreover, these characteristic immune anomalies were noted irrespective of an identified genetic etiology or hypogammaglobulinemia at presentation. These findings offer critical insight into the T cell immune dysregulation and B cell maturation defects common to all patients with pES. While, at presentation, immune dysregulation and deficiency may be clinically apparent in some patients with pES, it may not be clinically evident in many others. Immune abnormalities identified in this study highlight the fact that broader immune abnormalities are noted even in patients with gene-negative pES and those presenting with normal or high immunoglobulin levels.
Among the immune abnormalities noted, we identified cTfh expansion as a characteristic immune abnormality present in patients with pES. An increase in cTfh frequency in immune regulatory disorders has been previously attributed to quantitative and qualitative defects in Tregs or T-follicular regulatory cells.36-39 A similar mechanism might be at play in pES as a high proportion of these patients had low Tregs. Recently, low IgA levels in patients with common variable immunodeficiency leading to increased bacterial load in gut and ensuing endotoxemia was proposed as the driver for cTfh expansion.36,40 However, we found characteristic high cTfh in pES even in the presence of normal IgA levels. This suggests that low IgA levels and endotoxemia may not be the critical driver of cTfh expansion in pES. In addition, cTfhs in pES have a characteristic early lineage commitment and preferential acquisition of the senescence phenotype. High Ki67 transcripts and increased cTfhs in the TEMRA compartment suggest proliferative stress in cTfhs compared with the rest of the memory CD4 compartment. Excess cTfh cells is postulated to cause positive selection defect in the germinal center resulting in autoantibodies generation.41,42 Increased CD8 Tfh-like cells have been shown to result in the breakdown of B-cell tolerance and autoantibody production.43 Low Treg numbers and an increase in CD4 cTfh and CD8 cTfh-like cells in pES could facilitate autoantibody generation in pES. Additional mechanistic studies are needed to understand how, despite apparent cTfh expansion, there is decreased B-cell class-switching and risk of hypogammaglobulinemia. CD40L is critical for cTfh and B-cell interaction and resulting class-switch recombination and germinal center reaction.44 Decreased CD40L expression despite increased overall activation could suggest functional cTfh defect in patients with pES.
We show that cTfh in pES has an immunophenotype and transcriptome signature of immune activation and exhaustion. We also found upregulation of a canonical coinhibitory transcript, TOX gene, a transcription factor with a role in T-cell exhaustion in upregulated in pES.45-47 Interestingly, the mammalian target of rapamycin (mTOR) transcript was downregulated in patients with pES with upregulation of AKT, PRKCB, and other transcripts involved in the MAP kinase pathway. Because the mTOR inhibitor sirolimus is one of the first-line treatments of pES,48 the finding of the decreased mTOR transcript is intriguing. It is possible that an increase in pS6 and mTOR activity in cells may have resulted in the downregulation of the mTOR transcript. Alternatively, the beneficial effects of sirolimus in pES could also be mediated through its known inhibitory activity of protein kinase C,49,50 which was upregulated in pES.
Currently, semitargeted therapy with sirolimus in patients with pES results in excellent response.48,51 However, there is still a significant proportion of patients with pES who either do not tolerate sirolimus or do not respond to it. Therefore, there is a need to identify additional targeted therapies like sirolimus that have efficacy across different drivers of pES. Identification of genetic defects in pES has helped develop targeted therapies such as phosphatidylinositol 3-kinase δ (PI3Kδ) inhibitor for activated PI3Kδ syndrome,52,53 abatacept for CTLA-4 haploinsufficiency,54,55 and Lipopolysaccharide-responsive beige-like anchor protein (LRBA) defects,56 and the JAK-STAT pathway inhibitor ruxolitinib for STAT1 and STAT3 gain of function defects.57-59 However, further functional studies of MAP kinase, protein kinase C, JAK-STAT, AKT, and PI3K pathways are needed to help in understanding if some the abovementioned therapies and new therapies targeting these pathways can work across different genetic drivers and in pES without known genetic defects.
Chronic persistent viral infection is reported to redirect CD4+ T-cell differentiation toward Tfh.60 However, no obvious viral infection was identified in our patients with pES. The findings of increased oligoclonality, decreased diversity, and greater frequency of shared clones in the cTfh compartment of patients with pES than in HCs suggest there might be either an antigen-driven expansion or an impairment in generation of broad cTfh repertoire. Previous reports in mice and HLA disparate humans suggest that shared and public TCR sequences are enriched in autoimmune diseases irrespective of HLA haplotypes.61-63 Similarly, a higher overlap of TCR-β repertoire sequences was noted in our cohort of unrelated patients with pES.
In addition to cTfh changes, we found several other immunopathologic findings in pES. Patients with pES had an overall increase in activated T cells, leading to a chronic inflammatory state. Elevated levels of plasma CXCL9 and CXCL10 supports IFN-γ–driven inflammation.64-66 Additionally, IL-18, a known inducer of IFN-γ, was also elevated, suggesting ongoing innate inflammation.67 Persistently elevated IFN-γ has been previously shown in transgenic mice to result in a reduction of T and B cells.68,69 Similarly, a decrease in naïve CD4+ T cells was also noticed in pES. Other cytokines abnormalities such as low IL-2 and IL-7, both critical cytokines for Treg development70 and thymopoeisis,35,71 could also contribute to a decrease in Tregs and naïve CD4 T cells in patients with pES. Progressive loss of naïve CD4+ T cells in pES could eventually lead to combined immunodeficiency.72 Early attrition of CSMB cells could suggest an evolving B-cell defect even in patients with pES with normal IgG levels. It would of interest to evaluate whether the attenuation of the chronic T-cells activation state through several targeted early interventions48,52,73 could preserve immune function and delay progression to clinical immune deficiency and broader immune dysregulation states in pES.
Based on our findings, we propose a 4-point scoring system based on cTfh frequency, CD4 effector memory T-cell activation, frequency of naïve CD4+ T cells, and CSMB cells. A simple 8-color flow cytometry–based immunophenotyping including CD3, CD4, CCR7, CD45RA, CXCR5, PD-1, HLA-DR, and CD38 can identify the broad T-cell dysregulation and is feasible for most clinical flow cytometry laboratories. Adding CD19, CD27, and IgD to this panel may help identify problems in B-cell maturation and class-switching. Because of increased access to genetic testing and availability of targeted therapies for specific genotypes, upfront genetic testing is performed and recommended for all patients with pES.15,52,59,73 The role of this immune profile-based scoring is not to replace genetic testing but to help in the identification of broader immune abnormalities in patients with pES without a known genetic etiology or apparent immune deficiency. Another potential utility of immune profiling is in disease monitoring. Currently, response to therapies in pES is assessed by improvement in cytopenia. Improvement in cytopenia may be a sign of overall improvement in immune dysregulation. Apart from enumeration of total CD3, CD4, and CD8, limited longitudinal studies have been done to evaluate the changes in T-cell dysregulation and B-cell maturation defects following different therapies in patients with pES.48,52 Ideal therapies for pES are the ones that, in addition to improving cytopenia, treat the underlying board immune dysregulation and potentially decrease the risk of other autoimmune and lymphoproliferation complications and the development of humoral and/or combined immune deficiency. Appreciation and identification of broad immune dysregulation could help in the longitudinal assessment of these parameters in response to therapy, enabling the development of holistic monitoring and improved management approaches that could help both the cytopenia and address underlying immune dysregulation.
ES is a clinical diagnosis, and the proposed scoring system is not intended as a diagnostic tool. However, if validated, it could potentially help screen for broader immune dysregulation when presenting with single lineage cytopenia such as autoimmune hemolytic anemia. To support this argument, in our cohort of pES, single-lineage cytopenia or lymphoproliferation was the presenting manifestation in 4 patients before evolving to ES. Thus, immune evaluation using the parameters from the proposed scoring system could potentially identify patients like these before evolution to more classical ES or immune defect. However, we have not validated the utility of this scoring system for this indication. Further prospective studies could help define the role of this immune parameters-based scoring system in patients presenting with single lineage cytopenia.
Conclusion
In our study, we characterize the broad immune abnormalities in patients with pES. Expansion of cTfh, decrease in naïve CD4+ T cells, increase in T-cell activation, and decrease in class-switched memory B cells are among the most characteristic immune abnormalities in pES. These abnormalities are found in most patients with pES, irrespective of underlying genetic etiology and immunoglobulin levels. If validated, these findings could lead to identification of patients with immune cytopenia with a risk of developing broader immune complications. These immune abnormalities in pES were clearly different from cITP, suggesting distinct differences in immunopathology for these clinical entities.
Acknowledgments
This work was supported by National Institutes of Health, National Heart, Lung and Blood Institute grant 1K08HL141635-01A1, the Atlanta Pediatric Scholars Program K12 Scholar, supported by grants K12HD072245 and U54AI082973 (S. Chandrakasan), and the Henagan Foundation (S. Chandrakasan). S. Prahalad is supported, in part, by the Marcus Foundation Inc (Atlanta, GA).
Authorship
Contribution: D.K. was involved in the collection of the data, data analysis, creation of all figures, and manuscript writing; C.P. and A.R. were involved in collection of the data and analysis; C.M.B., M.B., L.L., K.P., S. Chonat, S.G., H.E., M.H.W., L.K., M.A., S. Parikh, S. Chandra, J.B., R.M., and S. Park were involved in clinical care and manuscript writing; E.K.W. and S. Prahalad were involved in manuscript writing and critical inputs; and S. Chandrakasan was responsible for project concept, design, analysis, manuscript writing, and project oversight.
Conflict-of-interest disclosure: S. Chandrakasan serves on the advisory committee of SOBI. S. Prahalad serves on a macrophage activation syndrome adjudication committee for Novartis Pharmaceuticals. All remaining authors declare no competing financial interests .
Correspondence: Shanmuganathan Chandrakasan, Immune Dysregulation and Immunohematology Program, Aflac Cancer and Blood Disorders Center, Children’s Healthcare of Atlanta, Emory University School of Medicine, 2015 Uppergate Dr, ECC Rm 434A, Atlanta, GA 30030; e-mail: shanmuganathan.chandrakasan@emory.edu.
Additional data related to this article are available by e-mail request to the corresponding author (shanmuganathan.chandrakasan@emory.edu).
The online version of this article contains a data supplement.
There is a Blood Commentary on this article in this issue.
The publication costs of this article were defrayed in part by page charge payment. Therefore, and solely to indicate this fact, this article is hereby marked “advertisement” in accordance with 18 USC section 1734.

This feature is available to Subscribers Only
Sign In or Create an Account Close Modal