

Key Points
RelB activation defines a new subset of DLBCL patients with a dismal outcome and peculiar gene expression and mutational profiles.
RelB activation confers DLBCL cell resistance to DNA damage—induced apoptosis and is associated with high cIAP2 expression.

Abstract
Diffuse large B-cell lymphoma (DLBCL) is the most frequent lymphoid malignancy affecting adults. The NF-κB transcription factor family is activated by 2 main pathways, the canonical and the alternative NF-κB activation pathway, with different functions. The alternative NF-κB pathway leads to activation of the transcriptionally active RelB NF-κB subunit. Alternative NF-κB activation status and its role in DLBCL pathogenesis remain undefined. Here, we reveal a frequent activation of RelB in a large cohort of DLBCL patients and cell lines, independently of their activated B-cell–like or germinal center B-cell–like subtype. RelB activity defines a new subset of patients with DLBCL and a peculiar gene expression profile and mutational pattern. Importantly, RelB activation does not correlate with the MCD genetic subtype, enriched for activated B-cell–like tumors carrying MYD88L265P and CD79B mutations that cooperatively activate canonical NF-κB, thus indicating that current genetic tools to evaluate NF-κB activity in DLBCL do not provide information on the alternative NF-κB activation. Furthermore, the newly defined RelB-positive subgroup of patients with DLBCL exhibits a dismal outcome after immunochemotherapy. Functional studies revealed that RelB confers DLBCL cell resistance to DNA damage–induced apoptosis in response to doxorubicin, a genotoxic agent used in the front-line treatment of DLBCL. We also show that RelB positivity is associated with high expression of cellular inhibitor of apoptosis protein 2 (cIAP2). Altogether, RelB activation can be used to refine the prognostic stratification of DLBCL and may contribute to subvert the therapeutic DNA damage response in a segment of patients with DLBCL.
Introduction
Diffuse large B-cell lymphoma (DLBCL) is the most common lymphoma in adults.1,2 Even though cure rates have improved significantly since the introduction of the immunochemotherapy R-CHOP (rituximab plus cyclophosphamide, doxorubicin, vincristine, and prednisone), refractory/relapse cases reach up to 40%.3 DLBCL is a highly heterogeneous disease and additional complexity remains to be defined for deeper DLBCL stratification and tailored therapies.
NF-κB transcription factors are major players in the control of cell proliferation and survival, as well as in the pathophysiology of numerous cancers.4-9 The NF-κB transcription factor family is composed of 5 members in mammals: RelA (p65), RelB, cRel (Rel), NF-κB1 (p50 and its precursor p105), and NF-κB2 (p52 and its precursor p100).10 These proteins form various homodimeric and heterodimeric complexes, the activity of which is regulated by 2 main pathways. The first one, known as the canonical NF-κB activation pathway, mainly applies to RelA- and/or cRel-containing complexes.11 The second one, the alternative NF-κB activation pathway, leads to the activation of RelB-containing dimers.6,12,13
Gene expression profiling (GEP) identified 2 prominent cell-of-origin (COO) DLBCL subtypes, germinal center B-cell–like (GCB) and activated B-cell–like (ABC), the latter being associated with worse outcome among patients treated with immunochemotherapy.14-16 More recently, major advances were made to capture the genetic heterogeneity of DLBCL17-23 and have elucidated oncogenic mechanisms in DLBCL. Frequent mutations in regulators of the classical NF-κB pathway (MYD88, TNFAIP3, CD79A/B, and CARD11) are recognized as a hallmark of patients with ABC DLBCL,24-28 and inhibition of the classical NF-κB pathway induces cell death in ABC DLBCL cell lines.29 In contrast, involvement of the alternative RelB NF-κB subunit in DLBCL pathogenesis and how it may impact DLBCL cell survival remain a central unanswered question.
In the study presented here, we reveal frequent RelB DNA-binding activity in patients newly diagnosed with DLBCL, regardless of their ABC or GCB subtypes, that predicted worse overall survival. Furthermore, we found that RelB activation defines a new subset of DLBCL patients with a distinct gene expression profile and genetic characteristics from that of the B-cell receptor (BCR)-dependent classical NF-κB signaling. Functional studies showed that RelB confers resistance to DNA damage–induced apoptosis in DLBCL cells, both ABC and GCB subtypes. Altogether, our data highlight a previously unrecognized function for the alternative NF-κB RelB subunit in DLBCL and provide the framework for the development of new drugs targeting RelB to overcome chemoresistance in DLBCL.
Materials and methods
Electrophoretic mobility shift assays for NF-κB
Whole cell extracts were prepared and analyzed for DNA-binding activity by using the HIV long terminal repeat tandem κB oligonucleotide as a κB probe, as previously described.30 Use of whole cell extracts to analyze NF-κB DNA-binding status by electrophoretic mobility shift assay (EMSA) in DLBCL patients and cell lines was validated by comparing nuclear and total NF-κB DNA-binding profiles in three DLBCL cell lines (MD901, K231, and OCI-Ly8) and the observation of highly similar NF-κB DNA-binding activity, indicating that NF-κB–binding activity emanates from nuclear proteins (supplemental Figure 1A, available on the Blood Web site). For supershift assays, total protein extracts were incubated with specific antibodies for 30 minutes on ice before incubation with the labeled probe. Beyond the RelB DNA-binding status described earlier, an analysis of DNA-binding activity of the 2 canonical NF-κB subunits RelA and cRel was performed. RelA-binding activity was observed in almost all cases; RelA vs cRel scoring was established according to the NF-κB subunit that presented the strongest DNA-binding activity.
Human patients with DLBCL and RelB DNA-binding status
Sixty-six patients with DLBCL (41 ABC and 25 GCB), who were enrolled in the prospective, multicenter, and randomized LNH-03B LYSA (Lymphoma Study Association) trials with available frozen tumor samples31 and centralized histopathologic review, were selected. The COO molecular classification was obtained with HGU133 + 2.0 Affymetrix GeneChip arrays (Affymetrix). Tumor purity was at least 80% (range, 80%-95%) based on pathologic review of hematoxylin-and-eosin–stained slides. EMSA study was performed as described earlier using whole cell extracts prepared from frozen biopsy samples from patients with DLBCL. Cases were considered “RelB positive” when they presented detectable RelB DNA-binding activity regardless of intensity combined with supershift. Cases were “RelB negative” when this activity was not detected. Cases were analyzed and classified independently by 3 senior researchers. A consensus was achieved for the discordant cases.
Determination of RelB gene expression signature
Differential gene expression analysis of the 66 patients with DLBCL included in the RelB DNA-binding study by EMSA was performed according to RelB-positive vs RelB-negative status using LIMMA; it identified a set of 140 probe sets corresponding to 118 genes differentially expressed with a fold change of two and a P value <.05 (supplemental Figure 2; supplemental Table 1). A hierarchical clustering established on the EMSA-based RelB gene expression signature was then performed by using 202 patients with DLBCL from the GSE87371 cohort defining 2 distinct subgroups corresponding to RelB-positive and RelB-negative DLBCL patients. Following the same approach, a hierarchical clustering was performed on the published cohort GSE98588,17 used as the “validation cohort,” with available clinical and transcriptomic data.
LymphGen genetic subtype classification
The genetic subtypes of DLBCL were established by using the LymphGen probabilistic classifier with the publicly accessible server (https://explore.openaire.eu).19 No CGH data were available in our data set; thus, only the MCD, EZB, and N1 subgroups could be properly classified according to the required sensitivity and specificity of the LymphGen assignment (supplemental Table 2).
Statistical analysis
Kaplan-Meier estimates of overall survival were performed by using the log-rank test (Mantel-Cox). Multivariate overall survival analyses were performed by using a Cox proportional hazards model. Overall survival was evaluated from the date of enrollment to the date of death. Cases were censored on the date the patient was last known to be alive or, for patients in complete response, dying as a result of causes unrelated to the lymphoma or treatment. Annexin V/4′,6-diamidino-2-phenylindole (DAPI) was assessed by using unpaired Student t tests (Prism 5.0c, GraphPad Software). A P value of .05 was considered as statistically significant with the following degrees: *P < .05, **P < .01, and ***P < .001. Statistical differences between all other parameters were determined by using Pearson correlation or Fisher’s exact tests when appropriate. P values or false discovery rates (FDR) <0.05 were considered statistically significant. Adjustments for multiple hypothesis testing were performed by using the method of Benjamini and Hochberg, and q-value thresholds for significance were set at 0.1.
Human DLBCL cell lines
ABC cell lines (OCI-ly3, U2932, MD901, RIVA, RCK8, HBL1, HLY1, and NUDUL1) and GCB cell lines (K422, DB, PFEIFFER, RL, WSUDLCL2, WSUNHL, FARAGE, OCI-Ly1, OCI-Ly7, 380, K231, OCI-Ly19, OZ, VAL, SUDHL6, TOLEDO, OCI-Ly8, and SUDHL5) derived from DLBCL patient samples were grown in RPMI 1640 medium (GlutaMAX; Gibco) supplemented with 10% heat-inactivated fetal bovine serum (HyClone), 100 U/mL penicillin, and 100 mg/mL streptomycin (Invitrogen).32 EMSA study combined with supershift was performed as described earlier.
Antibodies
The antibodies were purchased from Santa Cruz Biotechnology (RelB, RelA, cRel, PLC-γ, PARP1, and GAPDH), MilliporeSigma (β-actin), Abcam (γ-H2AX), and Cell Signaling Technology (cleaved caspase 3 [Asp175], and cellular inhibitor of apoptosis protein 2 [cIAP2], Phospho-Chk2 [Thr68], and Phospho-ATM [Ser1981]).
Immunoblotting
Immunoblotting was performed as previously described.33
Lentiviral production and transduction
Production of infectious recombinant lentiviruses was performed by transient transfection of 293T cells as previously described.34 For infections, cells were incubated overnight with recombinant lentiviruses. An equal amount of fresh culture medium was added 24 hours later, and after 48 hours, cells were washed and seeded in fresh culture medium. Green fluorescent protein–positive cells were sorted with a FACSAria sorter (Becton Dickinson).
Annexin V–binding assay
Cells were harvested and washed twice with cold phosphate-buffered saline. Cells were resuspended in 1X binding buffer containing annexin V/APC (BD Biosciences Pharmingen) and DAPI (Molecular Probes) following the manufacturers’ instructions. The samples were subjected to cytometric analysis with a MACSQuant cytometer (Miltenyi Biotec), and the data were statistically evaluated by using FlowJo version 10.2 software.
Quantitative reverse transcription polymerase chain reaction
Total RNA extraction and reverse transcription were performed as previously described.30 Real-time polymerase chain reaction analysis was performed with a LightCycler FastStart DNA Master plus SYBR Green I on a Light Cycler 1.5 (Roche Applied Science). All values were normalized to the level of hypoxanthine-guanine phosphoribosyltransferase (HPRT) messenger RNA (mRNA). Primers were as follows: cIAP2 sense, 5'-ACTAATACCGGGAACA-3'; cIAP2 antisense, 5'-ACTCCTGGGCTCAAGTAATTC-3'; Bcl-xL sense, 5'-CCCGACCTGTGATACAA-3'; Bcl-xL antisense, 5'-ATCCAAAGCCAAGATAAGATT-3'; Bcl-2 sense, 5'-GTCTGGGAATCGATCTGGAA-3'; Bcl-2 antisense, 5'-GCAACGATCCCATCAATCTT-3'; XIAP sense, 5'-GCAAGAGCTCAAGGAGACCA-3'; XIAP antisense, 5'-AAGGGTATTAGGATGGGAGTTCA-3'; TRAF2 sense, 5'- GCATACCCGCCATCTTCTC-3'; TRAF2 antisense, 5'-CGTTCAGGTAGATACGCAGACA-3' and HPRT sense, 5'-GGCGTCGTGATTAGTGATG-3'; and HPRT antisense, 5'-GCACACAGAGGGCTACAATGT-3'.
Results
RelB is frequently activated in patients with DLBCL irrespective of their ABC or GCB subtype and is associated with worse overall survival
To directly assess the activation status of RelB alternative NF-κB subunit in patients with DLBCL, we performed EMSA combined with supershift analysis using an anti-RelB antibody to evaluate RelB DNA-binding activity in 66 patients with de novo DLBCL (41 ABC and 25 GCB) (Table 1) included in clinical trials from the LYSA (clinical trial LNH03, tumor purity of at least 80%).31 A constitutive binding of RelB was observed in 44 patients with DLBCL (66.6%) (Figure 1A-B; supplemental Figure 1A-B). Importantly, the RelB-positive subset includes both ABC and GCB cases (Figure 1C), indicating that RelB is capturing largely different aspects than the DLBCL COO. Stronger RelA activity compared with the other NF-κB subunits tended to be preferentially present in ABC cases (30 of 37 [81%]; P = .0003). Inversely, those with stronger cRel activity tended to be of GCB type (10 of 13 [77%]; P = .0012) (Figure 1D). Antibody against p50 supershifted RelB complexes almost completely (Figure 1E; supplemental Figure 1C). Similarly, the RelA-containing complex was also very efficiently supershifted by antibodies directed against p50. Antibody against p52 had very little effect on NF-κB complexes. Furthermore, we characterized the DLBCL samples by immunohistochemistry for detection of nuclear NF-κB2/p52 and NF-κB1/p50 (Figure 1F-G). In line with the EMSA study, nuclear p52 does not correlate with RelB activity. Similarly, nuclear p50 does not correlate with RelB activity (Figure 1G), most probably because p50 heterodimerizes with both RelA and RelB subunits (Figure 1E). In a next step, it was important to assess how RelB activation affected outcome. Remarkably, RelB activation as evaluated by EMSA was significantly associated with worse overall survival (P = .0276) (Figure 1H).
RelB EMSA status and characteristics of the 66 de novo DLBCL patients
| Patient no. | COO | Age, y | Sex | IPI | RelB EMSA status |
|---|---|---|---|---|---|
| 1 | GCB | 43 | Male | 0 | NEG |
| 2 | ABC | 55 | Female | 1 | POS |
| 3 | ABC | 66 | Male | 4 | POS |
| 4 | ABC | 61 | Female | 3 | POS |
| 5 | ABC | 65 | Female | 5 | POS |
| 6 | GCB | 52 | Male | 2 | POS |
| 7 | ABC | 76 | Female | 4 | POS |
| 8 | ABC | 61 | Male | 3 | POS |
| 9 | ABC | 66 | Male | 3 | POS |
| 10 | ABC | 83 | Female | 4 | NEG |
| 11 | ABC | 43 | Female | 4 | NEG |
| 12 | ABC | 58 | Male | 3 | POS |
| 13 | ABC | 66 | Female | 3 | NEG |
| 14 | ABC | 68 | Female | 4 | POS |
| 15 | GCB | 60 | Male | 4 | POS |
| 16 | ABC | 76 | Female | 3 | POS |
| 17 | ABC | 76 | Female | 5 | POS |
| 18 | ABC | 87 | Male | 5 | POS |
| 19 | ABC | 56 | Male | 1 | NEG |
| 20 | GCB | 70 | Male | 2 | POS |
| 21 | ABC | 66 | Male | 3 | NEG |
| 22 | GCB | 49 | Female | 3 | POS |
| 23 | ABC | 26 | Female | 1 | POS |
| 24 | ABC | 38 | Male | 1 | POS |
| 25 | ABC | 78 | Female | 4 | NEG |
| 26 | GCB | 46 | Female | 0 | NEG |
| 27 | GCB | 38 | Male | 0 | POS |
| 28 | GCB | 53 | Female | 3 | NEG |
| 29 | ABC | 54 | Female | 0 | NEG |
| 30 | ABC | 50 | Female | 2 | NEG |
| 31 | ABC | 72 | Male | 4 | NEG |
| 32 | ABC | 76 | Female | 2 | POS |
| 33 | ABC | 53 | Female | 1 | POS |
| 34 | GCB | 20 | Male | 1 | POS |
| 35 | GCB | 61 | Male | 1 | POS |
| 36 | GCB | 72 | Male | 2 | NEG |
| 37 | ABC | 55 | Female | 1 | NEG |
| 38 | ABC | 55 | Male | 3 | NEG |
| 39 | ABC | 67 | Male | 2 | POS |
| 40 | ABC | 61 | Female | 5 | POS |
| 41 | ABC | 80 | Male | 5 | POS |
| 42 | ABC | 65 | Female | 4 | POS |
| 43 | GCB | 24 | Female | 0 | POS |
| 44 | GCB | 26 | Male | 2 | NEG |
| 45 | GCB | 39 | Female | 4 | POS |
| 46 | ABC | 75 | Male | 5 | POS |
| 47 | ABC | 63 | Female | 5 | POS |
| 48 | ABC | 24 | Male | 1 | POS |
| 49 | GCB | 48 | Female | 4 | POS |
| 50 | GCB | 68 | Female | 3 | NEG |
| 51 | ABC | 81 | Female | 5 | POS |
| 52 | ABC | 81 | Male | 3 | NEG |
| 53 | ABC | 52 | Female | 1 | POS |
| 54 | ABC | 59 | Female | 1 | POS |
| 55 | ABC | 52 | Female | 1 | NEG |
| 56 | GCB | 44 | Female | 3 | POS |
| 57 | GCB | 77 | Female | 3 | POS |
| 58 | ABC | 58 | Female | 0 | POS |
| 59 | GCB | 51 | Female | 3 | POS |
| 60 | GCB | 52 | Female | 2 | NEG |
| 61 | GCB | 62 | Male | 3 | POS |
| 62 | ABC | 83 | Male | 4 | POS |
| 63 | GCB | 50 | Male | 2 | POS |
| 64 | GCB | 61 | Male | 1 | NEG |
| 65 | GCB | 53 | Male | 1 | NEG |
| 66 | GCB | 32 | Female | 1 | POS |
PI, International Prognostic Index.

Activation of RelB is frequent in patients with de novo DLBCL irrespectively of their ABC or GCB subtype and is associated with worse overall survival. (A) Whole cell extracts from frozen samples of 66 cases of de novo DLBCL (from the LYSA LNH03 trial) were analyzed by using EMSA for alternative RelB NF-κB subunit DNA-binding activity. Four representative RelB- positive cases (2 ABC and 2 GCB) and one RelB-negative case are presented. For supershifts, extracts were incubated with either anti-RelB or anti-RelA antibodies before incubation with the labeled probe. RelA- and RelB-containing complexes are indicated. (B) Distribution of RelB DNA- binding activity as defined by EMSA among the GCB and ABC patients with DLBCL (n = 66). (C) Top: prevalence of RelB activation as defined by EMSA in ABC and GCB DLBCLs (n = 66). Bottom: prevalence of ABC and GCB DLBCLs within the positive RelB-binding activity subgroup. (D) Top: prevalence of dominant activation of the 2 canonical NF-κB subunits RelA and cRel as defined by EMSA in ABC and GCB DLBCLs (n = 66). Bottom: prevalence of ABC and GCB DLBCLs within the 2 dominant canonical NF-κB subunit RelA and cRel activation subgroups. (E) Subunit composition of the RelA- and RelB-containing complexes as determined by supershift analysis with the indicated antibodies. (F) Immunohistologic staining of DLBCL biopsy specimens with anti–NF-κB2/p52 and anti–NF-κB1/p50 antibodies, n = 54 of the 66 EMSA cases. A representative image showing nuclear localization of NF-κB2/p52 (top left) and NF-κB1/p50 (top right) is presented. Magnification, ×200. The cutoff used to score cases as nuclear positive for p52 and p50 was ≥30%. (G) Correlation analysis of RelB DNA-binding activity with nuclear p52 and p50 as evaluated in panel F; n = 54 patients. P value by Fisher’s exact test. Color codes indicate the presence or absence of the corresponding feature. (H) Kaplan-Meier plot of overall survival according to RelB DNA-binding status (LYSA LNH03 trial, EMSA cases, n = 66). P value by log-rank (Mantel-Cox) test. IHC, immunohistochemistry.
Activation of RelB is frequent in patients with de novo DLBCL irrespectively of their ABC or GCB subtype and is associated with worse overall survival. (A) Whole cell extracts from frozen samples of 66 cases of de novo DLBCL (from the LYSA LNH03 trial) were analyzed by using EMSA for alternative RelB NF-κB subunit DNA-binding activity. Four representative RelB- positive cases (2 ABC and 2 GCB) and one RelB-negative case are presented. For supershifts, extracts were incubated with either anti-RelB or anti-RelA antibodies before incubation with the labeled probe. RelA- and RelB-containing complexes are indicated. (B) Distribution of RelB DNA- binding activity as defined by EMSA among the GCB and ABC patients with DLBCL (n = 66). (C) Top: prevalence of RelB activation as defined by EMSA in ABC and GCB DLBCLs (n = 66). Bottom: prevalence of ABC and GCB DLBCLs within the positive RelB-binding activity subgroup. (D) Top: prevalence of dominant activation of the 2 canonical NF-κB subunits RelA and cRel as defined by EMSA in ABC and GCB DLBCLs (n = 66). Bottom: prevalence of ABC and GCB DLBCLs within the 2 dominant canonical NF-κB subunit RelA and cRel activation subgroups. (E) Subunit composition of the RelA- and RelB-containing complexes as determined by supershift analysis with the indicated antibodies. (F) Immunohistologic staining of DLBCL biopsy specimens with anti–NF-κB2/p52 and anti–NF-κB1/p50 antibodies, n = 54 of the 66 EMSA cases. A representative image showing nuclear localization of NF-κB2/p52 (top left) and NF-κB1/p50 (top right) is presented. Magnification, ×200. The cutoff used to score cases as nuclear positive for p52 and p50 was ≥30%. (G) Correlation analysis of RelB DNA-binding activity with nuclear p52 and p50 as evaluated in panel F; n = 54 patients. P value by Fisher’s exact test. Color codes indicate the presence or absence of the corresponding feature. (H) Kaplan-Meier plot of overall survival according to RelB DNA-binding status (LYSA LNH03 trial, EMSA cases, n = 66). P value by log-rank (Mantel-Cox) test. IHC, immunohistochemistry.
Identification of a RelB gene expression signature in patients with DLBCL
To go one step further and generate a molecular portrait of RelB activation in patients with DLBCL, we further explored whether GEP could subdivide these patients based on their status of RelB activation. A hierarchical clustering algorithm was used to group genes on the basis of RelB-positive cases vs RelB-negative cases as evaluated by EMSA. We identified a set of 140 probe sets corresponding to 118 genes associated with RelB-binding activity (supplemental Figure 2; supplemental Table 1). Next, the RelB gene expression signature was used to cluster the data from the GSE87371 cohort of 202 patients with de novo DLBCL (83 ABC, 85 GCB, and 34 unclassified). 56% of DLBCL cases exhibited a RelB gene expression profile (Figure 2A). Just as was seen for RelB-positive cases evaluated by EMSA, the frequency of RelB cases evaluated by GEP was not significantly different between the ABC and GCB subtypes (Figure 2B-C). Most importantly, we confirmed that this RelB gene signature predicted RelB activation with high confidence among the patients with DLBCL evaluated by using EMSA (97.14% positive predictive value, 95.45% specificity, 77.27% sensitivity), indicating that the follow-up of this gene mRNA expression constitutes a new tool for the evaluation of RelB activity. A more detailed analysis of the RelB signature revealed increased expression of genes linked to cell death and survival, metabolism, immune cell trafficking, inflammation, and proliferation (Figure 2D).

Identification of a RelB gene expression signature associated with worse outcome of patients with DLBCL treated by R-CHOP. (A) Hierarchical clustering of 202 patients with DLBCL from the GSE87371 cohort with the 140 differentially expressed probe sets identified based on RelB DNA-binding gene expression signature (supplemental Figure 2). Lines and columns of the heatmap correspond to probe sets and patients, respectively. Upregulated genes are coded in green, and downregulated genes are coded in red. COO classification of each case is represented on top of the heatmap. (B) Distribution of RelB activity as defined by GEP among patients with GCB and ABC DLBCL from the GSE 87371 cohort (n = 202). (C) Top: prevalence of RelB activation as defined by using GEP in ABC and GCB DLBCLs (n = 202). Bottom: prevalence of ABC and GCB DLBCLs within the RelB-positive cluster as defined by using GEP (n = 202). (D) RelB signature analysis by the Ingenuity Pathway Analysis software (www.ingenuity.com). (E) Volcano plot depicting the absence of enrichment of ten NF-κB signatures involved in regulatory processes in normal and malignant blood (https://lymphochip.nih.gov/signaturedb/) within the RelB-positive subset (x-axis, log2 enrichment; y-axis, log10 P value <1). P value by Fisher’s exact test. (F) Absence of correlation between Myc (cutoff ≥40%, n = 114 patients), Bcl2 (cutoff ≥50%, n = 95 patients), Myc/Bcl2 coexpression (n = 87 patients), and Bcl6 (cutoff ≥30%, n = 108 patients) as evaluated by immunohistochemistry (IHC) with the RelB gene expression signature. P value by Fisher’s exact test. (G) Kaplan-Meier plot of overall survival of the GSE87371 cohort (R-CHOP–treated patients with ABC and GCB DLBCL, n = 98), according to RelB GEP clusters. P value by log-rank (Mantel-Cox) test. (H) Multivariate analysis of the indicated risk factors for overall survival (GSE87371 cohort, R-CHOP–treated patients, n = 98) using Cox regression. IPI: International Prognostic Index. (I) Patient outcome according to RelB GEP clusters in an independent validation cohort (GSE98588, R-CHOP–treated patients with ABC and GCB DLBCL, n = 58; Chapuy et al,17 patients with available transcriptomic and clinical data). P value by log-rank (Mantel-Cox) test.
Identification of a RelB gene expression signature associated with worse outcome of patients with DLBCL treated by R-CHOP. (A) Hierarchical clustering of 202 patients with DLBCL from the GSE87371 cohort with the 140 differentially expressed probe sets identified based on RelB DNA-binding gene expression signature (supplemental Figure 2). Lines and columns of the heatmap correspond to probe sets and patients, respectively. Upregulated genes are coded in green, and downregulated genes are coded in red. COO classification of each case is represented on top of the heatmap. (B) Distribution of RelB activity as defined by GEP among patients with GCB and ABC DLBCL from the GSE 87371 cohort (n = 202). (C) Top: prevalence of RelB activation as defined by using GEP in ABC and GCB DLBCLs (n = 202). Bottom: prevalence of ABC and GCB DLBCLs within the RelB-positive cluster as defined by using GEP (n = 202). (D) RelB signature analysis by the Ingenuity Pathway Analysis software (www.ingenuity.com). (E) Volcano plot depicting the absence of enrichment of ten NF-κB signatures involved in regulatory processes in normal and malignant blood (https://lymphochip.nih.gov/signaturedb/) within the RelB-positive subset (x-axis, log2 enrichment; y-axis, log10 P value <1). P value by Fisher’s exact test. (F) Absence of correlation between Myc (cutoff ≥40%, n = 114 patients), Bcl2 (cutoff ≥50%, n = 95 patients), Myc/Bcl2 coexpression (n = 87 patients), and Bcl6 (cutoff ≥30%, n = 108 patients) as evaluated by immunohistochemistry (IHC) with the RelB gene expression signature. P value by Fisher’s exact test. (G) Kaplan-Meier plot of overall survival of the GSE87371 cohort (R-CHOP–treated patients with ABC and GCB DLBCL, n = 98), according to RelB GEP clusters. P value by log-rank (Mantel-Cox) test. (H) Multivariate analysis of the indicated risk factors for overall survival (GSE87371 cohort, R-CHOP–treated patients, n = 98) using Cox regression. IPI: International Prognostic Index. (I) Patient outcome according to RelB GEP clusters in an independent validation cohort (GSE98588, R-CHOP–treated patients with ABC and GCB DLBCL, n = 58; Chapuy et al,17 patients with available transcriptomic and clinical data). P value by log-rank (Mantel-Cox) test.
It was also important to examine whether the previously reported NF-κB characteristics in DLBCL gene expression signatures reflect the activation status of the alternative RelB NF-κB subunit. Remarkably, RelB activation was not associated with any reported NF-κB signatures in normal and malignant lymphoid cells, including DLBCL35 (Figure 2E); this finding indicates that RelB activity did not correlate with classical NF-κB gene expression features of DLBCL. There was no association between RelB activation and either BCL2, MYC, or double expression BCL2/MYC as evaluated by immunohistochemistry (Figure 2F). Next, we assessed the impact of RelB activation, as determined by its newly identified gene expression signature, on the survival of R-CHOP–treated patients from the GSE87371 cohort (n = 98) (Figure 2G). RelB-positive cases had a significantly inferior overall survival (P = .0320). Multivariate analysis, including IPI low-/high-risk group and COO classification, showed that RelB activation was an independent predictor for worse overall survival (P = .004; hazard ratio, 2.95) (Figure 2H). Most importantly, the worse overall survival associated with RelB activation was validated in an independent cohort of R-CHOP–treated patients with DLBCL17 (GSE98588, n = 58 for which transcriptomic and clinical data are available from the “Harvard cohort” used previously to identify DLBCL genetic subtypes) (Figure 2I).
In conclusion, we have developed a gene expression signature that accurately predicts RelB activation status in DLBCL patients. Moreover, our study brings up RelB as a potential new independent marker of worse prognosis among patients with DLBCL treated with R-CHOP.
Genetic attributes of RelB activation in DLBCL
Because RelB activation in ABC and GCB DLBCL patient samples was thus far overlooked, we next examined the genetic composition associated with RelB activation. We cataloged genetic alterations associated with the newly defined RelB signature using Lymphopanel Next-Generation Sequencing to identify mutations in 34 genes important for lymphomagenesis. RelB-positive DLBCLs were characterized by an enrichment of genetic alterations of ITPKB, a regulator of B-cell survival and response to antigen presentation, as well as with those of B2M, a gene whose loss mediates immune escape (Figure 3A-B). We also identified that mutation of IRF4, a gene involved in B-cell terminal differentiation, was significantly associated with RelB activation (Figure 3A-B). In contrast, RelB-positive DLBCLs rarely exhibited mutations in GNA13, an indirect modifier of BCR/PI3K frequently found mutated in germinal center–derived B-cell lymphomas (Figure 3A-B). There was no association between the RelB-positive subgroup and either BCL2 or MYC breaks, whereas there was a coexclusion tendency of RelB activation with Bcl6 genetic alterations (8 of 52 RelB positive vs 21 of 55 RelB negative), as evaluated by fluorescence in situ hybridization (FISH) (Figure 3C).
![Genetic features associated with RelB activation in DLBCL. (A) The mutational heatmap indicates 26 recurrently altered genes in ABC and GCB DLBCL cases (GSE87371, n = 156) with frequency >5%. To the right of the mutational heatmap is shown the prevalence of the indicated mutated genes in RelB-positive vs RelB-negative DLBCL cases as defined by using GEP. P value by Fisher’s exact test, significance thresholds, P < .05, false discovery rate [FDR] (q value) < 0.1. Color codes indicate the presence or absence of the corresponding feature. RelB activation status and ABC vs GCB DLBCL subtypes are indicated above the mutational map. (B) Volcano plot depicting the differences of gene mutations between RelB-positive and RelB-negative DLBCLs as defined by GEP (x-axis, log2 odds ratio; y-axis, –log10P value >1). P value by Fisher’s exact test; significance thresholds, P < .05, FDR (q value) < 0.1. (C) Correlation of Bcl6, Bcl2, or Myc fusion as evaluated by fluorescence in situ hybridization with RelB gene expression signature, n = 107 patients. P value by Fisher’s exact test; significance thresholds, P < .05, FDR (q value) < 0.1. Color codes indicate the presence or absence of the corresponding feature. (D) Top: prevalence of the indicated genetic subtypes defined according to the LymphGen algorithm (https://explore.openaire.eu) within the RelB-positive and RelB-negative clusters as defined by using GEP (n = 168). Bottom: prevalence of RelB-binding activity as evaluated by using GEP within the indicated LymphGen genetic subtypes (n = 168). (E) Top: prevalence of the indicated genetic subtypes defined by the LymphGen algorithm within each canonical NF-κB DNA-binding subgroup (RelA and cRel). Bottom: prevalence of canonical NF-κB DNA-binding subgroups (RelA and cRel) within the indicated LymphGen genetic subtype. (F) Mutational heatmap for TRAF3, TRAF2, MAP3K14, NFKBIA, and NFKBIZ, 5 important regulators of NF-κB activation. To the right of the mutational heatmap is shown the prevalence of the indicated mutated genes in RelB-positive vs RelB-negative DLBCL cases as defined by EMSA (n = 64). P value by Fisher’s exact test; significance thresholds, P < .05, FDR (q value) < 0.1. Color codes indicate the presence or absence of the corresponding feature. RelB activation status is indicated above the mutational map.](https://ash.silverchair-cdn.com/ash/content_public/journal/blood/139/3/10.1182_blood.2020010039/4/m_bloodbld2020010039f3.png?Expires=1769097870&Signature=EsCaBMEKPBeNheXo3dgp5DBHMnBrCvTG00ftDlr2jrYLr6mdnhanyvdGt407ixkqoyh3FYYQYrr28f5bUU2LYPCiB0cr0h5J~hdTSpZRpW9BcuJHbOoACI~uVe1cbqg3RrJ-M9Aig-X1g9V9kCSc4XXwWf9O44Wyo3Vg23Ss0xPu-gKGs6VPoA2NbB0DEAQ-18W0k5x7z6ZYWfJqEqgj8bVxXT5sX4StTgvpOdpJ3jW8GUMA0sL9Rng6zrvIsUbEAQ7drCrNo03xniPC62Gk15nw5BuvciPm4hkl3GxS2r~Syf9iHtGXKki6vZ~RDApsvsgNnNL9XvpWskGeaYNYeA__&Key-Pair-Id=APKAIE5G5CRDK6RD3PGA)
Genetic features associated with RelB activation in DLBCL. (A) The mutational heatmap indicates 26 recurrently altered genes in ABC and GCB DLBCL cases (GSE87371, n = 156) with frequency >5%. To the right of the mutational heatmap is shown the prevalence of the indicated mutated genes in RelB-positive vs RelB-negative DLBCL cases as defined by using GEP. P value by Fisher’s exact test, significance thresholds, P < .05, false discovery rate [FDR] (q value) < 0.1. Color codes indicate the presence or absence of the corresponding feature. RelB activation status and ABC vs GCB DLBCL subtypes are indicated above the mutational map. (B) Volcano plot depicting the differences of gene mutations between RelB-positive and RelB-negative DLBCLs as defined by GEP (x-axis, log2 odds ratio; y-axis, –log10P value >1). P value by Fisher’s exact test; significance thresholds, P < .05, FDR (q value) < 0.1. (C) Correlation of Bcl6, Bcl2, or Myc fusion as evaluated by fluorescence in situ hybridization with RelB gene expression signature, n = 107 patients. P value by Fisher’s exact test; significance thresholds, P < .05, FDR (q value) < 0.1. Color codes indicate the presence or absence of the corresponding feature. (D) Top: prevalence of the indicated genetic subtypes defined according to the LymphGen algorithm (https://explore.openaire.eu) within the RelB-positive and RelB-negative clusters as defined by using GEP (n = 168). Bottom: prevalence of RelB-binding activity as evaluated by using GEP within the indicated LymphGen genetic subtypes (n = 168). (E) Top: prevalence of the indicated genetic subtypes defined by the LymphGen algorithm within each canonical NF-κB DNA-binding subgroup (RelA and cRel). Bottom: prevalence of canonical NF-κB DNA-binding subgroups (RelA and cRel) within the indicated LymphGen genetic subtype. (F) Mutational heatmap for TRAF3, TRAF2, MAP3K14, NFKBIA, and NFKBIZ, 5 important regulators of NF-κB activation. To the right of the mutational heatmap is shown the prevalence of the indicated mutated genes in RelB-positive vs RelB-negative DLBCL cases as defined by EMSA (n = 64). P value by Fisher’s exact test; significance thresholds, P < .05, FDR (q value) < 0.1. Color codes indicate the presence or absence of the corresponding feature. RelB activation status is indicated above the mutational map.
Genetic features associated with RelB activation in DLBCL. (A) The mutational heatmap indicates 26 recurrently altered genes in ABC and GCB DLBCL cases (GSE87371, n = 156) with frequency >5%. To the right of the mutational heatmap is shown the prevalence of the indicated mutated genes in RelB-positive vs RelB-negative DLBCL cases as defined by using GEP. P value by Fisher’s exact test, significance thresholds, P < .05, false discovery rate [FDR] (q value) < 0.1. Color codes indicate the presence or absence of the corresponding feature. RelB activation status and ABC vs GCB DLBCL subtypes are indicated above the mutational map. (B) Volcano plot depicting the differences of gene mutations between RelB-positive and RelB-negative DLBCLs as defined by GEP (x-axis, log2 odds ratio; y-axis, –log10P value >1). P value by Fisher’s exact test; significance thresholds, P < .05, FDR (q value) < 0.1. (C) Correlation of Bcl6, Bcl2, or Myc fusion as evaluated by fluorescence in situ hybridization with RelB gene expression signature, n = 107 patients. P value by Fisher’s exact test; significance thresholds, P < .05, FDR (q value) < 0.1. Color codes indicate the presence or absence of the corresponding feature. (D) Top: prevalence of the indicated genetic subtypes defined according to the LymphGen algorithm (https://explore.openaire.eu) within the RelB-positive and RelB-negative clusters as defined by using GEP (n = 168). Bottom: prevalence of RelB-binding activity as evaluated by using GEP within the indicated LymphGen genetic subtypes (n = 168). (E) Top: prevalence of the indicated genetic subtypes defined by the LymphGen algorithm within each canonical NF-κB DNA-binding subgroup (RelA and cRel). Bottom: prevalence of canonical NF-κB DNA-binding subgroups (RelA and cRel) within the indicated LymphGen genetic subtype. (F) Mutational heatmap for TRAF3, TRAF2, MAP3K14, NFKBIA, and NFKBIZ, 5 important regulators of NF-κB activation. To the right of the mutational heatmap is shown the prevalence of the indicated mutated genes in RelB-positive vs RelB-negative DLBCL cases as defined by EMSA (n = 64). P value by Fisher’s exact test; significance thresholds, P < .05, FDR (q value) < 0.1. Color codes indicate the presence or absence of the corresponding feature. RelB activation status is indicated above the mutational map.
Next, it was important to examine whether the reported NF-κB–linked genetic alterations in DLBCL reflect the activation status of the alternative RelB NF-κB subunit. First, we analyzed the concurrent mutations of MYD88L265P and CD79B that cooperatively activate classical NF-κB via the My-T-BCR supercomplex involving MYD88, TLR9, and the BCR.36 Remarkably, the RelB-positive subset seemed to be significantly coexclusive with MYD88L265P and CD79B double mutations (Figure 3A-B). Similarly, there was no significant enrichment in mutations targeting CARD11, reported to be associated with the BCR-dependent NF-κB pathway (Figure 3A). Furthermore, we examined how RelB activation segregates with the genetic subtypes that the publicly accessible LymphGen probabilistic classification tool classifies19 (Figure 3D). No CGH data were available in our data set, and thus only the MCD, EZB, and N1 subgroups could be properly classified according to the required sensitivity and specificity of the LymphGen assignment (supplemental Table 2). As a mark of proper assignment, ABC and GCB tumors from our cohort are enriched for MCD and EZB, respectively (supplemental Figure 3A). Interestingly, RelB activation did not correlate with the MCD genetic subtype (enriched for ABC tumors carrying MYD88L265P and CD79B mutations that cooperatively activate NF-κB), nor with the EZB subtype (enriched for GCB tumors carrying EZH2 mutations, BCL2 translocation, and REL amplification) (Figure 3D). Strong RelA binding as evaluated by EMSA correlates with MCD and strong cRel correlates with EZB (Figure 3E). Furthermore, we used the independent validation cohort GSE98588 (Figure 2I) for which LymphGen labels are available for all 6 genetic subgroups, including the BN2 subgroup that is associated with NF-κB–linked genetic alterations (enriched for mutations in TNFAIP3 and its partner TNIP1). RelB activation did not correlate with the BN2 genetic subtype (supplemental Figure 3B). Similarly, RelB positive DLBCLs from the GSE87371 cohort are not significantly associated with TNFAIP3 mutations (Figure 3A). These observations indicate that the current genetic tools to evaluate NF-κB activity do not provide information on the alternative NF-κB RelB activation status.
We next examined 5 other genes encoding important regulators of NF-κB activation6,21,27,37,38; namely, TRAF3 (the most common abnormality identified in the alternative NF-κB pathway), TRAF2, MAP3K14, NFKBIZ, and NFKBIA (Figure 3F). Interestingly, TRAF3 deletions/mutations significantly correlated with RelB activation. There is a correlation tendency with TRAF2 mutations and a coexclusion tendency with NFKBIZ mutations. We identified no association between the RelB-positive subgroup and either MAP3K14 or NFKBIA mutations.
RelB protects ABC and GCB DLBCL cells from induction of apoptosis upon genotoxic treatment
Because our RelB-associated signature was enriched in genes linked to cell survival in patients with DLBCL, we next assessed the impact of RelB activation on DLBCL cell survival. We first performed an evaluation of RelB DNA-binding activity by EMSA combined with supershift on a large panel of 26 human DLBCL cell lines whose COO phenotypic subtype was known (Figure 4A-B). Sixteen DLBCL cell lines exhibited a constitutive RelB DNA-binding activity (61%), both in the ABC and the GCB subtype (Figure 4C), just as was seen in patients with DLBCL. Because TRAF3 was the most common abnormality identified in the alternative NF-κB pathway, we then analyzed whether RelB-binding activity was linked to TRAF3 inactivating gene lesions (deletions and frameshift mutations). TRAF3 deletions/mutations significantly correlated with RelB activation (Figure 4D-E). Taken together, these data show a frequent RelB-binding activation in DLBCL cell lines, both ABC and GCB, similar to what we have seen in patients with DLBCL, and that RelB activation often coexists with TRAF3 genetic alterations, just as was noted in patients with DLBCL (Figure 3F).
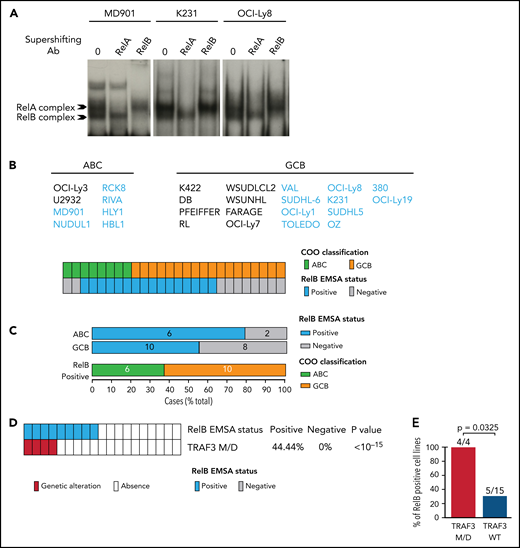
Frequent RelB DNA-binding activity in ABC and GCB DLBCL cell lines. (A) Whole cell extracts from 26 DLBCL cell lines were analyzed for NF-κB activity by using EMSA. Three representative cell lines are presented (1 ABC, MD901; 2 GCB, K231 and OCI-Ly8). For supershifts, extracts were incubated with the indicated antibodies before incubation with the labeled probe. RelB- and RelA-containing complexes are indicated. (B) Distribution of RelB DNA-binding activity as defined by using EMSA among GCB and ABC DLBCL cell lines (n = 26). (C) Top: prevalence of RelB activation as defined by using EMSA within ABC and GCB DLBCL cell lines (n = 26). Bottom: prevalence of ABC and GCB DLBCL cell lines within the positive RelB DNA-binding subgroup (n = 16). (D) Correlation between TRAF3 inactivating mutation/deletion (M/D) with RelB DNA-binding status (n = 19). P value by Fisher’s exact test. Color codes indicate the presence or absence of TRAF3 inactivating genetic alterations. (E) Percentage of TRAF3 M/D vs TRAF3 wild-type (WT) DLBCL cell lines showing a positive RelB DNA-binding status (n = 19). P value by Fisher’s exact test.
Frequent RelB DNA-binding activity in ABC and GCB DLBCL cell lines. (A) Whole cell extracts from 26 DLBCL cell lines were analyzed for NF-κB activity by using EMSA. Three representative cell lines are presented (1 ABC, MD901; 2 GCB, K231 and OCI-Ly8). For supershifts, extracts were incubated with the indicated antibodies before incubation with the labeled probe. RelB- and RelA-containing complexes are indicated. (B) Distribution of RelB DNA-binding activity as defined by using EMSA among GCB and ABC DLBCL cell lines (n = 26). (C) Top: prevalence of RelB activation as defined by using EMSA within ABC and GCB DLBCL cell lines (n = 26). Bottom: prevalence of ABC and GCB DLBCL cell lines within the positive RelB DNA-binding subgroup (n = 16). (D) Correlation between TRAF3 inactivating mutation/deletion (M/D) with RelB DNA-binding status (n = 19). P value by Fisher’s exact test. Color codes indicate the presence or absence of TRAF3 inactivating genetic alterations. (E) Percentage of TRAF3 M/D vs TRAF3 wild-type (WT) DLBCL cell lines showing a positive RelB DNA-binding status (n = 19). P value by Fisher’s exact test.
Next, we developed a stable RelB knockdown approach by RNA interference in three DLBCL cell lines presenting constitutive RelB activation (at least equal or superior to RelA DNA binding), namely MD901, Ocy-Ly8, and K231, corresponding to one ABC and two GCB DLBCL cell lines. RelB protein levels were efficiently and significantly decreased in all three DLBCL cell lines (Figure 5A). Importantly, RelB knockdown also resulted in a marked decrease in constitutive RelB-binding activity without affecting RelA-binding activity. Contrary to what we have observed in multiple myeloma cells,39 RelB knockdown in RelB-positive DLBCL cell lines did not induce significant spontaneous cell death. This finding probably reflects more complex cell death regulatory mechanisms in DLBCL compared with multiple myeloma. To go one step further, we then evaluated the contribution of RelB in DLBCL cell survival upon doxorubicin treatment, the main genotoxic drug in the conventional anthracycline-based CHOP (cyclophosphamide, doxorubicin, vincristine, and prednisone) chemotherapy in patients with DLBCL.3 Remarkably, doxorubicin-induced apoptosis, evaluated by annexin V/DAPI staining, was markedly increased upon knockdown of RelB expression in all three DLBCL cell lines (Figure 5B, top panels; supplemental Figure 4 for validation with a second RelB short hairpin RNA). This effect was associated with greater cleavage of caspase 3 (Figure 5C; supplemental Figure 5A). Importantly, RelB also protects DLBCL cells from etoposide and camptothecin-induced apoptosis, 2 other genotoxic agents frequently used in chemotherapy (Figure 5B, middle and bottom panels). Upon doxorubicin treatment, RelB expression knockdown greatly increased γH2AX protein expression levels (Figure 5D; supplemental Figure 5B) and γH2AX foci (Figure 5E). Furthermore, we evaluated the impact of RelB on the DNA damage response (DDR) upon doxorubicin treatment by monitoring the 2 DDR markers phospho-Ser1981-ATM (P-ATM) and phospho-Thr68-CHK2 (P-CHK2). RelB expression knockdown induced a more robust DDR activation upon doxorubicin treatment (supplemental Figure 5C).
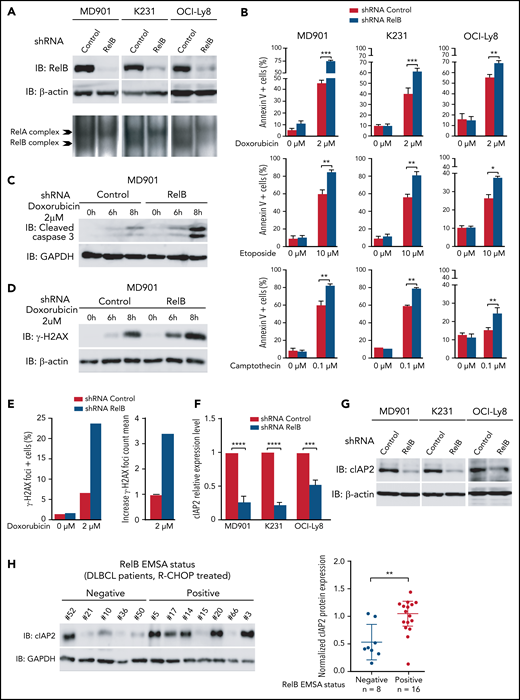
RelB protects ABC and GCB DLBCL cells from induction of apoptosis upon genotoxic treatment. (A) RelB protein levels (top) and RelB DNA-binding activity (bottom) are efficiently knocked down by stable RNA interference in ABC and GCB DLBCL cell lines. Whole cell extracts from MD901 (ABC), K231 (GCB), and OCI-Ly8 (GCB) cell lines transduced with lentiviruses encoding either a short hairpin RNA (shRNA) targeting RelB (shRNA RelB) or a scrambled control (shRNA control) were analyzed by using immunoblotting (top) and by EMSA (bottom) for the indicated proteins. (B) RelB knockdown induces ABC and GCB DLBCL cell apoptosis upon doxorubicin (top), etoposide (middle), and camptothecin (bottom) treatment. MD901, K231, and OCI-Ly8 cell lines transduced as in panel A were treated with the indicated genotoxic agent for 16 hours and monitored for apoptosis by annexin V/Allophycocyanin (APC) and DAPI staining followed by FACS analysis. Error bars are means ± standard deviation of 3 independent experiments. P values by unpaired Student t test , *P < .05, **P < .01, ***P < .001. Whole cell extracts of MD901 cells transduced as in panel A were treated with doxorubicin 2 µM for the indicated periods of time and analyzed by using immunoblotting for cleaved caspase 3 (C) and γ-H2AX (D). Glyceraldehyde-3-phosphate dehydrogenase (GAPDH) (panel C) and β-actin (panel D) were also analyzed, n = 3. (E) RelB knockdown induces γ-H2AX foci in DLBCL cells upon doxorubicin treatment. Left: percentage of γH2AX foci-positive MD901 cells. Right: γH2AX foci count mean in response to doxorubicin normalized to foci count mean of untreated MD901 cells. Data of a representative experiment are shown. (F) RelB knockdown decreases cIAP2 expression at mRNA level in ABC and GCB DLBCL cell lines. Quantitative reverse transcription polymerase chain reaction was performed with specific primer pairs for cIAP2 using total RNAs prepared from three DLBCL cell lines (1 ABC and 2 GCB) upon RelB knockdown as in panel A. Results are means ± standard error of the mean of 3 independent experiments for each cell line normalized to the level of HPRT mRNA. P values by unpaired Student t test, ***P < .001, ****P < .0001. (G) RelB knockdown decreases cIAP2 protein expression levels in ABC and GCB DLBCL cell lines. Whole cell extracts prepared as in panel A were analyzed according to the immunoblotting for the indicated proteins, n = 2. (H) RelB activation as evaluated by EMSA is associated with increased cIAP2 protein expression in patients with DLBCL. Whole cell extracts from 24 R-CHOP–treated patients with DLBCL of the EMSA study were analyzed for cIAP2 protein expression levels by immunoblotting. Left: 1 representative immunoblot is presented. Right: cIAP2 protein expression levels normalized to β-actin, n = 24. P values by Pearson correlation test, **P < .01.
RelB protects ABC and GCB DLBCL cells from induction of apoptosis upon genotoxic treatment. (A) RelB protein levels (top) and RelB DNA-binding activity (bottom) are efficiently knocked down by stable RNA interference in ABC and GCB DLBCL cell lines. Whole cell extracts from MD901 (ABC), K231 (GCB), and OCI-Ly8 (GCB) cell lines transduced with lentiviruses encoding either a short hairpin RNA (shRNA) targeting RelB (shRNA RelB) or a scrambled control (shRNA control) were analyzed by using immunoblotting (top) and by EMSA (bottom) for the indicated proteins. (B) RelB knockdown induces ABC and GCB DLBCL cell apoptosis upon doxorubicin (top), etoposide (middle), and camptothecin (bottom) treatment. MD901, K231, and OCI-Ly8 cell lines transduced as in panel A were treated with the indicated genotoxic agent for 16 hours and monitored for apoptosis by annexin V/Allophycocyanin (APC) and DAPI staining followed by FACS analysis. Error bars are means ± standard deviation of 3 independent experiments. P values by unpaired Student t test , *P < .05, **P < .01, ***P < .001. Whole cell extracts of MD901 cells transduced as in panel A were treated with doxorubicin 2 µM for the indicated periods of time and analyzed by using immunoblotting for cleaved caspase 3 (C) and γ-H2AX (D). Glyceraldehyde-3-phosphate dehydrogenase (GAPDH) (panel C) and β-actin (panel D) were also analyzed, n = 3. (E) RelB knockdown induces γ-H2AX foci in DLBCL cells upon doxorubicin treatment. Left: percentage of γH2AX foci-positive MD901 cells. Right: γH2AX foci count mean in response to doxorubicin normalized to foci count mean of untreated MD901 cells. Data of a representative experiment are shown. (F) RelB knockdown decreases cIAP2 expression at mRNA level in ABC and GCB DLBCL cell lines. Quantitative reverse transcription polymerase chain reaction was performed with specific primer pairs for cIAP2 using total RNAs prepared from three DLBCL cell lines (1 ABC and 2 GCB) upon RelB knockdown as in panel A. Results are means ± standard error of the mean of 3 independent experiments for each cell line normalized to the level of HPRT mRNA. P values by unpaired Student t test, ***P < .001, ****P < .0001. (G) RelB knockdown decreases cIAP2 protein expression levels in ABC and GCB DLBCL cell lines. Whole cell extracts prepared as in panel A were analyzed according to the immunoblotting for the indicated proteins, n = 2. (H) RelB activation as evaluated by EMSA is associated with increased cIAP2 protein expression in patients with DLBCL. Whole cell extracts from 24 R-CHOP–treated patients with DLBCL of the EMSA study were analyzed for cIAP2 protein expression levels by immunoblotting. Left: 1 representative immunoblot is presented. Right: cIAP2 protein expression levels normalized to β-actin, n = 24. P values by Pearson correlation test, **P < .01.
Altogether, these data indicate that RelB exerts a critical prosurvival function to protect DLBCL cells from DNA damage–induced apoptosis. To further assess underlying mechanisms, we determined whether RelB constitutive activation in DLBCL cells upregulates the expression of endogenous antiapoptotic NF-κB responsive genes, such as cIAP2, Bcl-xL, Bcl2, XIAP, and TRAF2. Knockdown of RelB expression markedly and significantly decreased cIAP2 mRNA levels (Figure 5F). In contrast, no differences in Bcl-xL, Bcl2, XIAP, or TRAF2 mRNA levels were observed upon RelB knockdown (supplemental Figure 5D). In concert with these results, the amount of cIAP2 protein was markedly and significantly decreased upon RelB knockdown in DLBCL cells (Figure 5G). Most importantly, a significant accumulation of cIAP2 protein was observed in patients with DLBCL with constitutive activation of RelB (Figure 5H). Collectively, we have uncovered that RelB protects DLBCL cells (both ABC and GCB) from DNA damage accumulation and subsequent apoptosis upon genotoxic treatment.
Discussion
Although recurrent genetic lesions were associated with activation of the canonical NF-κB pathway in human DLBCL (predominantly the ABC subtype),21,25-27 whether the alternative NF-κB pathway is functionally activated in patients with DLBCL is still debatable. In the study presented here, we conducted the first comprehensive analysis of the alternative NF-κB DNA-binding activity (ie, RelB) by EMSA, the gold standard method to evaluate NF-κB DNA-binding activity, on a large cohort of DLBCL patient samples and cell lines. We found that constitutive activation of RelB is frequent (∼66%) in patients newly diagnosed with DLBCL, almost equally distributed among ABC and GCB, indicating that it represents a major event in DLBCL independent of the COO. Moreover, we uncovered an important role for RelB in promoting DLBCL cell survival upon DNA damage. These results have important implications for the role of RelB in DLBCL pathogenesis and therapy.
Loss-of-function genetic alterations in genes of the alternative NF-κB pathway have been reported in a subset of human DLBCLs. Inactivating genetic alterations of TRAF3 occur in ∼15% of human cases of DLBCL, irrespective of their ABC or GCB subtype.37 Loss-of-function genetic alterations in TRAF2 and BIRC2/3, two other negative regulators of the alternative NF-κB pathway (but also positive regulators of the canonical NF-κB), have been reported in ∼12% and 10% of DLBCL cases, respectively.21,27,40,41 TRAF2 mutations are preferentially associated with GCB and BIRC2/3 with ABC. Here, we observe that genetic alterations of TRAF3 (and to a lesser extent TRAF2) are significantly associated with RelB-positive DLBCLs. Nonetheless, regarding the frequency of RelB activation in human DLBCL that we report here, one can hypothesize that important regulators of the alternative NF-κB pathway remain to be identified in the context of DLBCL pathogenesis, and thereby their putative mutations are being overlooked. The present work shows that RelB-positive DLBCLs are also significantly associated with ITPKB, B2M, and IRF4. Whether mutations affecting these genes could be functionally involved in RelB activation is currently unknown but worth further investigation. Alternatively, additional mechanisms might contribute to the regulation of RelB activity in DLBCL cells independently of intrinsic mutations, including stimuli originating from the tumor microenvironment such as BAFF and CD40L, 2 ligands known to activate the noncanonical NF-κB pathway in B cells,42,43 and loss of nuclear inhibitory mechanisms such as trapping in RelA/RelB and p100/RelB complexes.30,44,45
Evasion of cell death is a characteristic feature of DLBCL and represents a key cause of resistance to current treatment approaches. Therefore, reactivation of cell death programs in DLBCL cells is a promising strategy to overcome treatment resistance. Our study clearly shows that RelB protects DLBCL cells from DNA damage induced by doxorubicin, a genotoxic agent used in front-line treatment of DLBCL, thereby leading to increased resistance of DLBCL cells to doxorubicin. First, we observed an increase in γH2AX expression and foci induced by doxorubicin upon inhibition of RelB expression. Second, RelB knockdown induces a marked increase in DLBCL cell apoptosis upon doxorubicin treatment. Third, RelB activity is required for optimal expression of the antiapoptotic gene cIAP2 in DLBCL cells, although it remains unknown if the pro-survival activity of RelB is exerted through the control of cIAP2 expression. Indeed, although cIAP2 was originally characterized by its ability to inhibit cell death through suppression of caspase activity,46 cIAP2 is also involved in many aspects of innate and adaptive immune cell function through the ubiquitin-mediated regulation of the NF-κB pathways.47,48 Altogether, our data point to RelB as a promising target to sensitize DLBCL cells to proapoptotic stimuli to circumvent resistance to treatment.
In summary, we established that RelB is a crucial positive regulator of DLBCL cell survival upon genotoxic agent exposure which is frequently activated in patients with both ABC and GCB DLBCL. Our data are of great functional importance because they constitute a significant advance in the understanding of RelB function in DLBCL and provide a strong rationale for the development of new molecules targeting RelB for therapeutic intervention in DLBCL.
Acknowledgments
The authors thank the Centre d’Histologie, d’Imagerie Cellulaire et de Cytométrie, Centre de Recherche des Cordeliers UMRS 1138, Paris, France, for cell sorting and FACS analysis. They are grateful to Laura Pasqualucci for valuable genetic data in DLBCL cell lines.
This work was supported by grants from Institut National du Cancer, Agence Nationale pour la Recherche, the European Union’s Horizon 2020 Research and Innovation Programme under the Marie Skłodowska-Curie grant agreement no. 766214, Université de Paris (V.B.), Instituto de Salud Carlos III–FIS–CIBERONC (CB16/12/00489) (J.A.M.-C.), 12 Rounds contre le Cancer, and doctoral funding from IDEX Doctoral International Program (D.C.), Prolific (B.E.), Fondation Nelia et Amadeo Barletta, Switzerland (S.N.A.), the European Union’s Horizon 2020 Research and Innovation Programme under the Marie Skłodowska-Curie grant agreement no. 766214, Université de Paris (L.L.), and Societé Française d’Hémathologie (D.C.), and Fondation ARC pour la Recherche sur le Cancer (B.E.).
Authorship
Contribution: T.J.M. and J.F. critically read the manuscript; V.B., J.F., and T.J.M. conceived and designed the experiments; D.C., S.N.-A., B.E., N.F., D.B., A.M., I.M., O.T., J.L.-C., and M.C. performed the experiments; V.B., B.E., D.C., J.F., T.J.M., S.N.-A., L.L., N.C., J.P.J., K.L., B.T., B.B., and A.V.-S. analyzed the data; J.A.M.-C., F.J., C.C.-B., M.C.M., C.H., H.T., and G.K. contributed reagents, materials, and analysis tools; and V.B., B.E., and D.C. wrote the paper.
Conflict-of-interest disclosure: The authors declare no competing financial interests.
Correspondence: Véronique Baud, Université de Paris, NF-kappaB, Différenciation et Cancer, 4 Avenue de l’Observatoire, 75006, Paris, France; e-mail: veronique.baud@inserm.fr; Jean Feuillard, CNRS UMR 7276, Université de Limoges, 2 rue du Pr Bernard Descottes, 87025, Limoges, France, and CHU Dupuytren, laboratoire d’Hématologie, 2 Avenue Martin Luther King, 87000, Limoges, France; e-mail: jean.feuillard@unilim.fr; and Thierry Molina, Université de Paris, NF-κB, Différenciation et Cancer, 4 Avenue de l’Observatoire, 75006, Paris, France, and Pathology, AP-HP, Necker-Enfants Malades, 149 rue de Sèvres, 75015, Paris, France; e-mail: thierry.molina@aphp.fr.
The online version of this article contains a data supplement.
The publication costs of this article were defrayed in part by page charge payment. Therefore, and solely to indicate this fact, this article is hereby marked “advertisement” in accordance with 18 USC section 1734.

This feature is available to Subscribers Only
Sign In or Create an Account Close Modal