

Key Points
Single-cell multiomics analysis reveals higher plasticity and stem-cell-like blasts in younger KMT2A-r ALL patients with worse prognosis.
The most immature leukemic cells exhibit steroid resistance and stem-cell–like cells contribute to immune evasion in younger patients.

Abstract
KMT2A-rearranged (KMT2A-r) infant acute lymphoblastic leukemia (ALL) is a devastating malignancy with a dismal outcome, and younger age at diagnosis is associated with increased risk of relapse. To discover age-specific differences and critical drivers that mediate poor outcome in KMT2A-r ALL, we subjected KMT2A-r leukemias and normal hematopoietic cells from patients of different ages to single-cell multiomics analyses. We uncovered the following critical new insights: leukemia cells from patients <6 months have significantly increased lineage plasticity. Steroid response pathways are downregulated in the most immature blasts from younger patients. We identify a hematopoietic stem and progenitor-like (HSPC-like) population in the blood of younger patients that contains leukemic blasts and form an immunosuppressive signaling circuit with cytotoxic lymphocytes. These observations offer a compelling explanation for the ability of leukemias in young patients to evade chemotherapy and immune-mediated control. Our analysis also revealed preexisting lymphomyeloid primed progenitors and myeloid blasts at initial diagnosis of B-ALL. Tracking of leukemic clones in 2 patients whose leukemia underwent a lineage switch documented the evolution of such clones into frank acute myeloid leukemia (AML). These findings provide critical insights into KMT2A-r ALL and have clinical implications for molecularly targeted and immunotherapy approaches. Beyond infant ALL, our study demonstrates the power of single-cell multiomics to detect tumor intrinsic and extrinsic factors affecting rare but critical subpopulations within a malignant population that ultimately determines patient outcome.
Introduction
The mixed-lineage leukemia 1 (MLL1) gene (or lysine methyltransferase 2A, KMT2A) encodes a nuclear protein involved in epigenetic and transcriptional regulation. Rearrangements of the KMT2A gene (KMT2A-r) occur with over 130 different translocation partners1 and are found in multiple types of leukemias. KMT2A-r leukemias account for approximately 70% of acute leukemias in infants and 10% in all other age groups.2
Advances in risk-adapted chemotherapy and the introduction of novel agents have increased the survival for children with ALL >1 year to over 90%.3 In contrast, the event-free survival (EFS) for KMT2A-r infant ALL is 36% and has not changed in decades.4,5 The age at diagnosis is one of the strongest predictors of outcome, regardless of therapeutic approach.4,6 EFS rates vary dramatically between infants <3 months of age (<20%) and those >12 months of age (∼65%). Several strategies have been explored to improve the survival of children with KMT2A-r ALL. However, neither the incorporation of intensive, myeloid-type chemotherapy (Interfant-064), hematopoietic stem cell transplantation (HSCT),4 nor targeted therapies such as FLT3 inhibition have improved outcomes in multicenter trials.7
In this study, we leverage single-cell multiomic profiling to gain insights into the cellular and molecular factors that drive the unique features of KMT2A-r ALL. In particular, we focus on understanding the developmental origin and heterogeneity of leukemic cells, interactions between leukemic cells and immune cells, and plasticity of leukemic cells following chemotherapy and/or immunotherapy.
Methods
Human biospecimens
Peripheral blood (PB) or bone marrow (BM) samples were from patients with infant ALL enrolled in the Children’s Oncology Group (COG) clinical trial AALL15P1, or they were collected under the Children’s Hospital of Philadelphia (CHOP) Institutional Review Board (IRB) Protocol 10-007767 (CHOP Center for Childhood Cancer Research [CCCR] Biorepository), or under CHOP IRB Protocol 94-000771. All samples were obtained with parental informed consent according to the Declaration of Helsinki with IRB approval from all participating centers. Patient and healthy donor sample information is listed in supplemental Table 1 available on the Blood Web site.
Single-cell RNA sequencing (scRNA-Seq)
Sorted cells were immediately processed using the 10x Genomics Chromium controller and the Single Cell 3′ Reagent Kits V3 protocol. Libraries were sequenced on a Nova-Seq 6000 with 28:8:0:87 paired-end format.
Single-cell assay for transposase-accessible chromatin using sequencing (scATAC-Seq)
Sorted cells were subjected to nuclei isolation protocol. Nuclei were processed using 10x Genomics Chromium controller and the Single Cell ATAC Reagent Kits V1 protocol. Libraries were sequenced on a Nova-Seq 6000 with 49:8:16:49 paired-end format.
See supplemental Data for additional description of methods and materials.
Results
Single-cell multiomics characterization of KMT2A-r leukemia in children
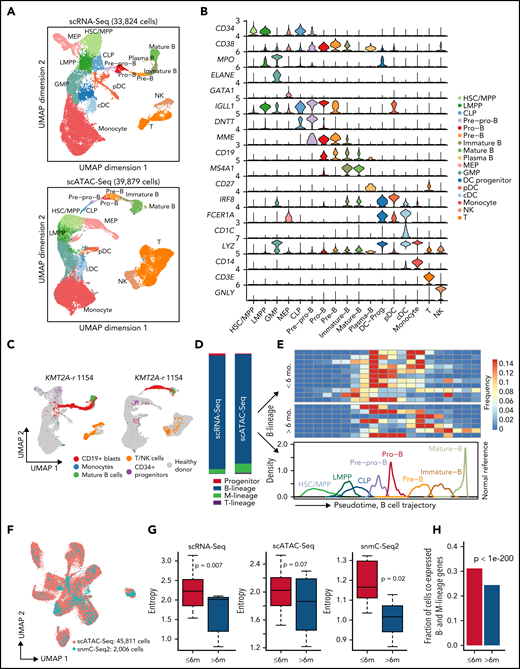
To investigate the transcriptomic and epigenetic heterogeneity in KMT2A-r leukemia, we performed scRNA-Seq and scATAC-Seq on sorted leukemic blasts (CD19+) and normal hematopoietic cells (CD45+CD19−), as well as single-nucleus methylcytosine sequencing (snmC-Seq2)8 on sorted leukemic blasts (CD19+) from 25 KMT2A-r ALL patients, including 18 infants diagnosed <1 year (infant cohort), and 7 patients >1 year at diagnosis (pediatric cohort) (Figure 1A-C; supplemental Table 1; supplemental Methods). The frequency of KMT2A translocation partners in our patient cohort is representative of the reported frequencies,1 with AFF1, MLLT1, MLLT3, and MLLT10 being the most frequent fusion partners (supplemental Figure 1A). We sequenced a total of 200 756, 154 779, and 2006 high-quality cells using scRNA-Seq, scATAC-Seq, and snmC-Seq2 protocols, respectively (supplemental Figure 1; supplemental Methods). On average, 2008 genes were detected per cell in scRNA-Seq data, and 17 828 unique chromatin accessible fragments were mapped per cell in scATAC-Seq data (supplemental Figure 1C-D). For snmC-Seq2 data, we sequenced an average of 6.35 million reads per cell, giving an average of 5.97% genome coverage, 99.6% conversion rate, 4.34 million CpG sites recovered, and 80.8% CpG methylation rate per cell (supplemental Figure 1E).
![Single-cell multiomics profiling of pediatric KMT2A-r leukemia. (A) Experimental design of multiomics profiling of KMT2A-r leukemia and healthy donor samples. (B) Sorting strategy for capturing blasts and nonmalignant cells from B-ALL patients. (C) Number of assays/samples performed for each single-cell omics protocol. (D) Overall UMAP of all scRNA-Seq cells (left panel) and all scATAC-Seq cells (right panel) of 18 infant ALL samples, colored by assigned cell populations. Total numbers of sequenced cells are indicated. (E) Cell type compositions based on the scRNA-Seq and scATAC-Seq data in panel D. (F) Heatmap of differentially expressed genes for each cell population compared with the rest of populations [abs(Log2[FC]) >0.5 and FDR <0.05]. Values in the heatmap are row-wise Z-scores. Color code for each cell population is the same as in panel D. (G) Heatmap of enriched TFs at ATAC-Seq peaks. Enrichment is represented by the normalized deviation scores (z-score) calculated by chromVAR. (H) Genome browser tracks and gene expression violin plots for representative cell-type-specific marker genes. Left panels, aggregated scATAC-Seq signals for each assigned cell type. Right panels, normalized scRNA-Seq expression values for the corresponding cell type. (I) Schematic of scTLR-Seq for detecting fusion transcripts in single cells. (J) Fraction of cells with KMT2A fusion and wild-type reads for each cell population, including blasts, mature B cells, monocytes, NK/T cells from patients, and hematopoietic cells from healthy donors, defined as the ratio of the number of cells with KMT2A reads vs the total number of sequenced cells of a given population.](https://ash.silverchair-cdn.com/ash/content_public/journal/blood/139/14/10.1182_blood.2021013442/8/m_bloodbld2021013442f1.png?Expires=1765891545&Signature=ceC0fKs8KquxNSKB1Q2H6Jm6XfMMjKrVF384N1VtKVgmEAutFSWlc~PYfimDAuytiOXY8e81tyvPrKMgqJvdHwTTdlqT8TdKD9~-OETzknquRV5hKVe5iYDVRxMMKkG1bCbOFvSKkVECdYGjMJUX8txKIQEfbGJvEmAYrEMwCYJcptEsUZ0Ensbk1KMPPrJM78vFaSKX9NsvqrHXsFaLuyxP8Klhn0-dnsYRagixuJEoyFom7ozFfucGNj~pBR0Q-yB~X19s1ZNfyntuQtWXJgj-wkMoPfIKWSj55xRkixG4kXom3WpbLI0qYTSExhGcd8ZavwGPPTI~K~se2digzg__&Key-Pair-Id=APKAIE5G5CRDK6RD3PGA)
Single-cell multiomics profiling of pediatric KMT2A-r leukemia. (A) Experimental design of multiomics profiling of KMT2A-r leukemia and healthy donor samples. (B) Sorting strategy for capturing blasts and nonmalignant cells from B-ALL patients. (C) Number of assays/samples performed for each single-cell omics protocol. (D) Overall UMAP of all scRNA-Seq cells (left panel) and all scATAC-Seq cells (right panel) of 18 infant ALL samples, colored by assigned cell populations. Total numbers of sequenced cells are indicated. (E) Cell type compositions based on the scRNA-Seq and scATAC-Seq data in panel D. (F) Heatmap of differentially expressed genes for each cell population compared with the rest of populations [abs(Log2[FC]) >0.5 and FDR <0.05]. Values in the heatmap are row-wise Z-scores. Color code for each cell population is the same as in panel D. (G) Heatmap of enriched TFs at ATAC-Seq peaks. Enrichment is represented by the normalized deviation scores (z-score) calculated by chromVAR. (H) Genome browser tracks and gene expression violin plots for representative cell-type-specific marker genes. Left panels, aggregated scATAC-Seq signals for each assigned cell type. Right panels, normalized scRNA-Seq expression values for the corresponding cell type. (I) Schematic of scTLR-Seq for detecting fusion transcripts in single cells. (J) Fraction of cells with KMT2A fusion and wild-type reads for each cell population, including blasts, mature B cells, monocytes, NK/T cells from patients, and hematopoietic cells from healthy donors, defined as the ratio of the number of cells with KMT2A reads vs the total number of sequenced cells of a given population.
Single-cell multiomics profiling of pediatric KMT2A-r leukemia. (A) Experimental design of multiomics profiling of KMT2A-r leukemia and healthy donor samples. (B) Sorting strategy for capturing blasts and nonmalignant cells from B-ALL patients. (C) Number of assays/samples performed for each single-cell omics protocol. (D) Overall UMAP of all scRNA-Seq cells (left panel) and all scATAC-Seq cells (right panel) of 18 infant ALL samples, colored by assigned cell populations. Total numbers of sequenced cells are indicated. (E) Cell type compositions based on the scRNA-Seq and scATAC-Seq data in panel D. (F) Heatmap of differentially expressed genes for each cell population compared with the rest of populations [abs(Log2[FC]) >0.5 and FDR <0.05]. Values in the heatmap are row-wise Z-scores. Color code for each cell population is the same as in panel D. (G) Heatmap of enriched TFs at ATAC-Seq peaks. Enrichment is represented by the normalized deviation scores (z-score) calculated by chromVAR. (H) Genome browser tracks and gene expression violin plots for representative cell-type-specific marker genes. Left panels, aggregated scATAC-Seq signals for each assigned cell type. Right panels, normalized scRNA-Seq expression values for the corresponding cell type. (I) Schematic of scTLR-Seq for detecting fusion transcripts in single cells. (J) Fraction of cells with KMT2A fusion and wild-type reads for each cell population, including blasts, mature B cells, monocytes, NK/T cells from patients, and hematopoietic cells from healthy donors, defined as the ratio of the number of cells with KMT2A reads vs the total number of sequenced cells of a given population.
We identified 6 major groups of cell types (Figure 1D,H) in both scRNA-Seq and scATAC-Seq data using marker genes (supplemental Table 2), including CD19+ blasts, T and NK cells, monocytes, mature B cells, CD34+ hematopoietic stem and progenitor cells (HSPCs), and plasmacytoid dendritic cells (pDCs). The cell type compositions are highly concordant between scRNA-Seq and scATAC-Seq data (Figure 1E).
Differential gene expression and transcription factor (TF) motif chromatin accessibility analyses showed distinct transcriptional and epigenetic programs between CD19+ blasts and other cell types. Expectedly, B-cell developmental genes such as VPREB1, IGLL1, and CD24 were expressed significantly higher in CD19+ blasts (Figure 1F). Similarly, motifs of early B-lineage TFs were enriched at open chromatin regions specific to CD19+ blasts, including PAX5, EBF1, and TCF12 (Figure 1G). In contrast, key lineage-specific TFs were enriched in other cell types, such as GATA2 in hematopoietic progenitors, CEBPA and CEBPB in monocytes,9 LEF1 in T cells, and POU2F2 and SPIB in mature B cells.10,11
The blast population was defined as clusters of cells expressing CD19, HOXA9, MEIS1, and MEF2C (CD19+ blasts) (supplemental Table 2). To confirm that these cells are indeed leukemic blasts, we developed the single-cell targeted long-read sequencing (scTLR-Seq) protocol that directly sequences cDNA of fusion transcripts from individual cells (supplemental Methods; Figure 1I). scTLR-Seq data confirmed that blasts identified based on marker gene expression indeed contain an above background fraction of fusion transcript reads, suggesting that these cells are malignant cells (Figure 1J).
Increased developmental heterogeneity of leukemic blasts in younger patients
Previous studies suggested that different B-ALL subtypes have distinct developmental origins and are arrested at distinct stages of B-cell differentiation.12,13 However, the landscape of perturbed developmental stages remains unknown for pediatric KMT2A-r leukemia. Therefore, we generated reference scRNA-Seq and scATAC-Seq data using BM samples from 5 healthy pediatric donors (Figure 1A,C; supplemental Figure 1B; supplemental Table 1). In total, we sequenced 33 824 and 21 573 high-quality cells, respectively (supplemental Figure 1C-D). We then generated reference trajectories based on the scRNA-Seq and scATAC-Seq data separately and annotated cell populations using manually curated marker genes that cover the entire hematopoietic trajectory (Figure 2A-B; supplemental Table 2; supplemental Methods). Both RNA- and chromatin-based trajectories identified all major hematopoietic cell types and are highly concordant (Figure 2A; supplemental Figure 2A-B).
Projection of KMT2A-r leukemia cells to normal hematopoietic trajectory reveals larger intratumor heterogeneity in younger patients. (A) UMAPs based on scRNA-Seq (top panel) and scATAC-Seq data from healthy pediatric donors (bottom panel). scATAC-Seq includes the dataset generated in this study and previously published datasets.49 Cell type annotation for scATAC-Seq data were transferred from scRNA-Seq data using Seurat. Total numbers of sequenced cells are indicated on top. (B) Violin plots of marker gene expression used for defining the hematopoietic cell populations. (C) Projection of patient cells onto normal hematopoietic trajectories. Left panel, representative projection of patient 1154 scRNA-Seq data. Right panel, representative projection of patient 1154 scATAC-Seq data. Gray dots, cells from healthy donors; colored dots, patient cells. (D) Composition of CD19+ leukemic blasts in different hematopoietic lineages based on projected scRNA-Seq data (left bar) and scATAC-Seq data (right bar). M-lineage, myeloid lineage. (E) Frequency of B-lineage blasts from 18 infant KMT2A-r patients stratified along the normal hematopoietic trajectory (pseudotime). B-lineage pseudotime from HSC/MPPs to mature B cells is ordered into 20 bins. Upper heatmap shows the frequency of each bin from all 18 infant KMT2A-r patients. Lower line plot shows the frequency of each developmental stage along the pseudotime trajectory using healthy donor data. (F) UMAP shows coembedded snmC-Seq2 and scATAC-Seq data. Total numbers of sequenced cells of each modality are indicated. (G) Blasts from younger patients (<6 months old) show higher developmental heterogeneity based on scRNA-Seq, scATAC-Seq, and snmC-Seq2 data, respectively. Heterogeneity was quantified using Shannon’s entropy. P values are based on Student t test. (H) Fractions of cells aberrantly coexpressing B (VPREB1, IGLL1, CD79A, and CD19) and myeloid (MPO, CEBPA, and CD33) lineage antigens in younger and older infant patients. P value was computed using a one-sided binomial test.
Projection of KMT2A-r leukemia cells to normal hematopoietic trajectory reveals larger intratumor heterogeneity in younger patients. (A) UMAPs based on scRNA-Seq (top panel) and scATAC-Seq data from healthy pediatric donors (bottom panel). scATAC-Seq includes the dataset generated in this study and previously published datasets.49 Cell type annotation for scATAC-Seq data were transferred from scRNA-Seq data using Seurat. Total numbers of sequenced cells are indicated on top. (B) Violin plots of marker gene expression used for defining the hematopoietic cell populations. (C) Projection of patient cells onto normal hematopoietic trajectories. Left panel, representative projection of patient 1154 scRNA-Seq data. Right panel, representative projection of patient 1154 scATAC-Seq data. Gray dots, cells from healthy donors; colored dots, patient cells. (D) Composition of CD19+ leukemic blasts in different hematopoietic lineages based on projected scRNA-Seq data (left bar) and scATAC-Seq data (right bar). M-lineage, myeloid lineage. (E) Frequency of B-lineage blasts from 18 infant KMT2A-r patients stratified along the normal hematopoietic trajectory (pseudotime). B-lineage pseudotime from HSC/MPPs to mature B cells is ordered into 20 bins. Upper heatmap shows the frequency of each bin from all 18 infant KMT2A-r patients. Lower line plot shows the frequency of each developmental stage along the pseudotime trajectory using healthy donor data. (F) UMAP shows coembedded snmC-Seq2 and scATAC-Seq data. Total numbers of sequenced cells of each modality are indicated. (G) Blasts from younger patients (<6 months old) show higher developmental heterogeneity based on scRNA-Seq, scATAC-Seq, and snmC-Seq2 data, respectively. Heterogeneity was quantified using Shannon’s entropy. P values are based on Student t test. (H) Fractions of cells aberrantly coexpressing B (VPREB1, IGLL1, CD79A, and CD19) and myeloid (MPO, CEBPA, and CD33) lineage antigens in younger and older infant patients. P value was computed using a one-sided binomial test.
Next, we devised a method to project leukemic blasts to the normal hematopoietic trajectory (supplemental Methods). For example, Figure 2C shows that blasts in patient KMT2A-r 1154 were mostly arrested after the pre-pro-B stage, with a minor fraction of blasts arrested at the earlier multipotent progenitor stage. The projections based on the transcriptome and chromatin accessibility data are highly concordant (supplemental Figure 2C). Additional analyses further confirm the robustness of the projection (supplemental Methods; supplemental Figure 2D-F).
Overall, >95% blasts projected onto the B-cell developmental trajectory across the 18 patients (Figure 2D). However, within this trajectory, there was a wide spectrum of developmental stages at which blasts from the same patient were arrested (Figure 2E). We quantified this intratumor developmental heterogeneity using Shannon’s entropy. We found that blasts from younger patients (<6 months old) exhibited significantly higher developmental heterogeneity that manifested at both the transcriptomic (P = .007) and chromatin accessibility (P = .07) levels (Figure 2G; supplemental Figure 2G). We next integrated our snmC-Seq2 data with scATAC-Seq data (Figure 2F; supplemental Methods). We again observed higher developmental heterogeneity in blasts of younger patients (P = .02) (Figure 2G). In addition, we found a significantly higher proportion of cells aberrantly coexpressed B and myeloid lineage genes in younger infants, indicating higher lineage plasticity in this age group (Figure 2H).
Distinct transcriptomic and epigenomic signatures of blasts in younger patients reveal intrinsic steroid resistance
We next sought to identify transcriptomic and epigenomic features underlying the higher heterogeneity among blasts in younger patients. We identified 495 differentially expressed genes [DEGs, FDR <0.05, and abs(log2FC) >0.5] in blasts from at least 1 B-cell developmental stage between younger and older patients. These DEGs were clustered into 5 clusters (Figure 3A; supplemental Table 5). Genes in cluster 1 were expressed higher in younger patients across the entire B-cell developmental trajectory. The top enriched pathways include B cell development genes, response to viral infection, and AP-1 pathway (Figure 3B). Genes in cluster 4 were expressed higher in younger patients and predominantly at immature B stage. The top enriched pathways include ribosome biogenesis, metabolism, and translation (supplemental Figure 3A). Genes in clusters 5 and 2 were expressed lower in younger patients in progenitor and pre-pro-B stages and pre-B and immature-B stages, respectively. Remarkably, the top enriched pathway in cluster 5, blasts at the most immature developmental stage, is response to corticosteroid (Figure 3B). This includes the steroid receptor gene NR3C1 (Figure 3A).
![Transcriptomic and epigenomic signatures of blasts in younger patients. (A) Heatmap for differentially expressed genes [abs(log2[FC]) >0.5 and FDR <0.05] of blasts arrested at various B-cell developmental stages between younger (<6 months old) and older (>6 months old) patients. DEGs were pooled and clustered by k-means clustering (k = 5) based on their log2FC. Number of genes in each cluster is indicated in the parenthesis. Nonsignificant genes are colored gray. (B) Pathway enrichment analysis results for DEGs in clusters 1 (top panel) and cluster 5 (bottom panel). (C) Heatmap for differential TF motif accessibility of blasts arrested at various B-cell developmental stages between younger and older patients. For each TF in each cell, the motif accessibility at scATAC-Seq peaks was computed as the normalized deviation score using chromVAR. Color in the heatmap indicates the difference in normalized chromVAR deviation scores averaged across all cells in younger vs older patients. TFs with differential accessibility between younger and older patients were identified by Wilcoxon test of the normalized deviation scores between the 2 groups with an FDR cutoff <0.05. Nonsignificant TFs were colored in gray. (D-E) Viability of wild type and NR3C1/KLF9 KO KOPN8 (D) and SEMK2 (E) cell lines after dexamethasone treatment with different doses. Error bar, standard deviation of 2 biological replicates. P values by Student t-test for KO vs control are shown: *P < .05; **P < .01; ***P < .001. n.s., not significant.](https://ash.silverchair-cdn.com/ash/content_public/journal/blood/139/14/10.1182_blood.2021013442/8/m_bloodbld2021013442f3.png?Expires=1765891545&Signature=wMSDRbCqo60pVBRc0X2Vu13d8Qb5Ty67DJAPBn7No4pU674Oy2kpplV2aEn71v2Kga8OYXsJZnisf4PVKg1kVRu0JkTn-8LpRiKYc~sB9NwTzxcWQ5HI~YI8JZaAMMG5uKDFUI0p4NczvOsg~ZMOxjCulq5tTvolmHRpWyx0gVF14vdh3JbBOPJ~LU0LLiZfZRAqjRIqXVcCPjDsMF-tjN3hFIqFlGkioFcxqySK710O~wjkX3cT5WzzyrbQesq2l-z-rxYQZOwEHn~aOqC9e9D5ysvrnYF-mj2AfWPzdnevfjCMBUwn6rF4IMkyIcjHG7wqeDVE8Xn5eubXqH6qXg__&Key-Pair-Id=APKAIE5G5CRDK6RD3PGA)
Transcriptomic and epigenomic signatures of blasts in younger patients. (A) Heatmap for differentially expressed genes [abs(log2[FC]) >0.5 and FDR <0.05] of blasts arrested at various B-cell developmental stages between younger (<6 months old) and older (>6 months old) patients. DEGs were pooled and clustered by k-means clustering (k = 5) based on their log2FC. Number of genes in each cluster is indicated in the parenthesis. Nonsignificant genes are colored gray. (B) Pathway enrichment analysis results for DEGs in clusters 1 (top panel) and cluster 5 (bottom panel). (C) Heatmap for differential TF motif accessibility of blasts arrested at various B-cell developmental stages between younger and older patients. For each TF in each cell, the motif accessibility at scATAC-Seq peaks was computed as the normalized deviation score using chromVAR. Color in the heatmap indicates the difference in normalized chromVAR deviation scores averaged across all cells in younger vs older patients. TFs with differential accessibility between younger and older patients were identified by Wilcoxon test of the normalized deviation scores between the 2 groups with an FDR cutoff <0.05. Nonsignificant TFs were colored in gray. (D-E) Viability of wild type and NR3C1/KLF9 KO KOPN8 (D) and SEMK2 (E) cell lines after dexamethasone treatment with different doses. Error bar, standard deviation of 2 biological replicates. P values by Student t-test for KO vs control are shown: *P < .05; **P < .01; ***P < .001. n.s., not significant.
Transcriptomic and epigenomic signatures of blasts in younger patients. (A) Heatmap for differentially expressed genes [abs(log2[FC]) >0.5 and FDR <0.05] of blasts arrested at various B-cell developmental stages between younger (<6 months old) and older (>6 months old) patients. DEGs were pooled and clustered by k-means clustering (k = 5) based on their log2FC. Number of genes in each cluster is indicated in the parenthesis. Nonsignificant genes are colored gray. (B) Pathway enrichment analysis results for DEGs in clusters 1 (top panel) and cluster 5 (bottom panel). (C) Heatmap for differential TF motif accessibility of blasts arrested at various B-cell developmental stages between younger and older patients. For each TF in each cell, the motif accessibility at scATAC-Seq peaks was computed as the normalized deviation score using chromVAR. Color in the heatmap indicates the difference in normalized chromVAR deviation scores averaged across all cells in younger vs older patients. TFs with differential accessibility between younger and older patients were identified by Wilcoxon test of the normalized deviation scores between the 2 groups with an FDR cutoff <0.05. Nonsignificant TFs were colored in gray. (D-E) Viability of wild type and NR3C1/KLF9 KO KOPN8 (D) and SEMK2 (E) cell lines after dexamethasone treatment with different doses. Error bar, standard deviation of 2 biological replicates. P values by Student t-test for KO vs control are shown: *P < .05; **P < .01; ***P < .001. n.s., not significant.
TF motif accessibility analysis revealed 45 TFs that had genome-wide chromatin accessibility difference (Wilcoxon test FDR <0.05) in blasts between younger and older patients in >1 B-cell developmental stage (Figure 3C; supplemental Table 6). Consistent with their expression levels, the motif chromatin accessibility for the AP-1 factors was higher in younger patients. In contrast, chromatin accessibility of the steroid response related NR3C1 and KLF9 TFs were lower in younger patients.
Besides chromatin accessibility, we identified an average of 22 432 differentially methylated regions (DMRs) for each B-cell developmental stage between patients of the 2 age groups (supplemental Table 7). The DNA methylation change in gene promoter was consistent with the change in gene expression. For instance, promoters of upregulated genes IL7R, IGLL1, and TCF4 (Figure 3A), were hypomethylated in younger patients at multiple B-cell developmental stages (supplemental Figure 3B). In contrast, promoters of downregulated genes NR3C1, KLF9, and RUNX2 (Figure 3A,C) were hypermethylated in younger patients at early stages of B-cell development (supplemental Figure 3B-C).
Steroids are one of the most important agents for the treatment of KMT2A-r ALL patients,6 and steroid resistance contributes to the poor prognosis of infant KMT2A-r ALL, especially among younger patients.14-17 What mediates the poor steroid response in infants is not known. NR3C1 encodes the glucocorticoid receptor, and previous studies have reported that NR3C1 is important for glucocorticoid treatment response in other acute leukemias.18,19KLF9 has been reported as a gene that responds to glucocorticoid signaling.20,21 Lower NR3C1/KLF9 gene expression and motif accessibility in younger patients provide a potential mechanistic explanation for inferior treatment response and therapy resistance in younger patients. We functionally validated NR3C1 and KLF9 in 3 KMT2A-r ALL cell lines, SEMK2, KOPN8, and RS4;11 (supplemental Figure 3D). We observed strong resistance to prednisone and dexamethasone after CRISPR-mediated knockout of NR3C1 in all 3 cell lines (P < 1e-5) (Figure 3D-E; supplemental Figure 3E). KLF9 knockout induced resistance in KOPN8 and RS4;11 (P < 1e-5 and P < .01, respectively) (supplemental Figure 3E). The less pronounced steroid resistance of KLF9 KO cells compared with NR3C1 KO cells may be due to lower KLF9 baseline expression according to the CCLE database (supplemental Figure 3F).
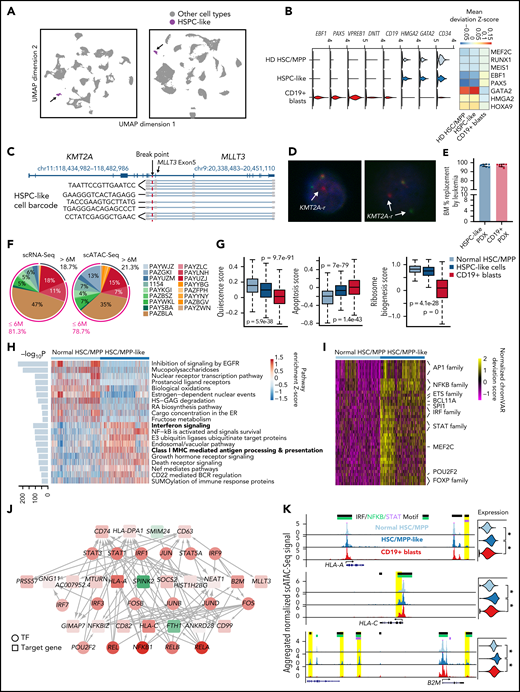
A rare HSPC-like population predominantly in younger patients
We found a small population of cells in the PB of infant patients that resemble HSPCs (1.27% and 1.47% of total cells by scRNA-Seq and scATAC-Seq, respectively) (Figure 4A). These cells are CD34+CD19− (Figure 1H), express several canonical HSPC TFs such as GATA2 and HMGA2, and are negative for B-cell developmental genes such as EBF1, PAX5, VPREB1, and DNTT (Figure 4B; supplemental Figure 4A). Furthermore, key HSPC TFs were enriched, and early B-cell TFs depleted at open chromatin regions in this population compared with CD19+ blasts (Figure 4B). By scTLR-Seq, we detected KMT2A fusion transcripts above background in this population (Figures 1J and 4C). For further confirmation, we performed KMT2A DNA FISH on sorted HSPC-like cells from 2 patients (supplemental Figure 4B); 14.4% (180/1248) of the HSPC-like cells in patient 3315 and 6.6% (21/316) in patient PAYLNH demonstrated a split KMT2A signal, indicative of a KMT2A rearrangement (Figure 4D). To functionally test the HSPC-like cells, we transplanted sorted HSPC-like cells (supplemental Figure 4B) and CD19+ blasts from initial diagnostic sample of patient PAYUZJ into NSG mice. We found both HSPC-like cells and CD19+ blasts can generate leukemia (Figure 4E). However, leukemia derived from HSPC-like cells has lower CD19+ and higher CD34+CD63+ immunophenotype compared with the CD19+-derived leukemia (supplemental Figure 4C). These data indicate that HSPC-like cells are indeed malignant with different immunophenotype.
A leukemia cell containing HSPC-like population exists in younger patients. (A) UMAPs of single-cell data from the PB of 18 infant patients highlighting the hematopoietic stem and progenitor-like population in the PB of the patients (HSPC-like cells, purple). Gray, other cell types. Left panel, UMAP based on scRNA-Seq data, showing 128 588 total cells, 1136 of which are HSPC-like cells. Right panel, UMAP based on scATAC-Seq data, showing 98 887 total cells, 1020 of which are HSPC-like. (B) Gene expression and regulator activity signatures for normal HSPCs, HSPC-like cells, and CD19+ blasts. Left panel, violin plots of marker gene expression in the 3 cell types. Right panel, activity of cell-type-specific transcriptional factors in the 3 cell types. Activity was measured as the mean TF motif chromatin accessibility score in each cell type. (C) Representative result of fusion reads identified in HSPC-like cells from patient 1154 using scTLR-Seq. Fusion reads from multiple HSPC-like blasts (with different cell barcodes) are shown. (D) Representative DNA FISH images of HSPC-like cells. Blue, DAPI; red dots, 5′ of KMT2A gene; green dots, 3′ of KMT2A gene. White arrows indicate KMT2A translocation. (E) Barplot shows leukemia burdens (percentage of hCD45) in the end-of-study BM in 2 groups. Blue, PDX cells from HSPC-like engrafted mice (n = 8); red, PDX cells from CD19+ blasts engraft mice (n = 8). (F) Percentages of total HSPC-like cells contributed by each patient, based on scRNA-Seq and scATAC-Seq data. (G) Quiescence, apoptosis, and ribosome biogenesis signature gene scores for BM HSC/MPPs from normal donors, HSPC-like cells, and CD19+ blasts. Scores were calculated as the sum of z-scores (across all cells) of all genes of a signature. P values were computed using the Wilcoxon test. (H) Pathways enriched comparing HSC/MPP-like cells and BM HSC/MPPs from normal donors. Enriched pathways were identified using the AUCell method. Heatmap shows the top 20 enriched pathways for HSC/MPP-like cells and normal HSC/MPPs, respectively. Barplot on the left shows the adjusted P value for enrichment. (I) Heatmap of differential TF motif accessibility in HSC/MPP-like cells compared with normal BM HSC/MPPs. Values are z-score normalized deviation scores calculated using chromVAR. TFs with differential accessibility between HSC/MPP-like cells and normal HSC/MPPs were identified using Wilcoxon test of the normalized deviation scores between the 2 groups with an FDR cutoff <0.05. (J) Transcriptional regulation network distinguishing HSC/MPP-like cells from normal HSC/MPPs. For clarity, only the part of the TRN involving AP-1, NFKB, STAT, and IRF factors is shown. Nodes represent either enriched TFs or differentially expressed genes in the HSC/MPP-like blasts vs normal HSC/MPPs. Node color is proportional to the −log10(FDR) of differential expression, with red being upregulation and green being downregulation. Edge line thickness is proportional to the −log10(FDR) of the linear regression coefficient for the predicted enhancer-promoter interaction. (K) Example MHC class I genes upregulated in HSC/MPP-like cells. Left panels, aggregated scATAC-Seq signals in normal HSC/MPPs, HSC/MPP-like cells, and CD19+ blasts. Putative enhancers for each gene are highlighted in yellow. Motifs of STAT or NFKB or IRF transcription factors overlapping the enhancers are indicated at the top. Right panels, violin plots for normalized expression of the selected genes in the 3 cell types. *Adjusted P value <1e-10.
A leukemia cell containing HSPC-like population exists in younger patients. (A) UMAPs of single-cell data from the PB of 18 infant patients highlighting the hematopoietic stem and progenitor-like population in the PB of the patients (HSPC-like cells, purple). Gray, other cell types. Left panel, UMAP based on scRNA-Seq data, showing 128 588 total cells, 1136 of which are HSPC-like cells. Right panel, UMAP based on scATAC-Seq data, showing 98 887 total cells, 1020 of which are HSPC-like. (B) Gene expression and regulator activity signatures for normal HSPCs, HSPC-like cells, and CD19+ blasts. Left panel, violin plots of marker gene expression in the 3 cell types. Right panel, activity of cell-type-specific transcriptional factors in the 3 cell types. Activity was measured as the mean TF motif chromatin accessibility score in each cell type. (C) Representative result of fusion reads identified in HSPC-like cells from patient 1154 using scTLR-Seq. Fusion reads from multiple HSPC-like blasts (with different cell barcodes) are shown. (D) Representative DNA FISH images of HSPC-like cells. Blue, DAPI; red dots, 5′ of KMT2A gene; green dots, 3′ of KMT2A gene. White arrows indicate KMT2A translocation. (E) Barplot shows leukemia burdens (percentage of hCD45) in the end-of-study BM in 2 groups. Blue, PDX cells from HSPC-like engrafted mice (n = 8); red, PDX cells from CD19+ blasts engraft mice (n = 8). (F) Percentages of total HSPC-like cells contributed by each patient, based on scRNA-Seq and scATAC-Seq data. (G) Quiescence, apoptosis, and ribosome biogenesis signature gene scores for BM HSC/MPPs from normal donors, HSPC-like cells, and CD19+ blasts. Scores were calculated as the sum of z-scores (across all cells) of all genes of a signature. P values were computed using the Wilcoxon test. (H) Pathways enriched comparing HSC/MPP-like cells and BM HSC/MPPs from normal donors. Enriched pathways were identified using the AUCell method. Heatmap shows the top 20 enriched pathways for HSC/MPP-like cells and normal HSC/MPPs, respectively. Barplot on the left shows the adjusted P value for enrichment. (I) Heatmap of differential TF motif accessibility in HSC/MPP-like cells compared with normal BM HSC/MPPs. Values are z-score normalized deviation scores calculated using chromVAR. TFs with differential accessibility between HSC/MPP-like cells and normal HSC/MPPs were identified using Wilcoxon test of the normalized deviation scores between the 2 groups with an FDR cutoff <0.05. (J) Transcriptional regulation network distinguishing HSC/MPP-like cells from normal HSC/MPPs. For clarity, only the part of the TRN involving AP-1, NFKB, STAT, and IRF factors is shown. Nodes represent either enriched TFs or differentially expressed genes in the HSC/MPP-like blasts vs normal HSC/MPPs. Node color is proportional to the −log10(FDR) of differential expression, with red being upregulation and green being downregulation. Edge line thickness is proportional to the −log10(FDR) of the linear regression coefficient for the predicted enhancer-promoter interaction. (K) Example MHC class I genes upregulated in HSC/MPP-like cells. Left panels, aggregated scATAC-Seq signals in normal HSC/MPPs, HSC/MPP-like cells, and CD19+ blasts. Putative enhancers for each gene are highlighted in yellow. Motifs of STAT or NFKB or IRF transcription factors overlapping the enhancers are indicated at the top. Right panels, violin plots for normalized expression of the selected genes in the 3 cell types. *Adjusted P value <1e-10.
Intriguingly, we found that ∼80% of HSPC-like cells came from patients <6 months (Figure 4F). To further characterize this population, we computed gene signature scores related to HSPC biology, including quiescence score, apoptosis score,22 and ribosome biogenesis score.23 We found that HSPC-like cells resemble a cellular state between normal HSC/MPP and CD19+ blasts (Figure 4G). More than 98% of HSPC-like cells were projected to HSC/MPP, LMPP, and committed progenitors (supplemental Figure 4D). Among them, ∼70% were projected to HSC/MPPs, which we term as HSC/MPP-like cells. We identified 165 DEGs between HSC/MPP-like cells and normal HSC/MPPs (supplemental Figure 4E; supplemental Table 8). Pathway analysis revealed that type II interferon response and MHC class I genes were upregulated in the HSC/MPP-like population (Figure 4H; supplemental Figure 4F). Consistently, scATAC-Seq data showed enrichment for motifs of interferon effector TFs in the HSC/MPP-like population compared with normal HSC/MPPs, including STAT, IRF, and NFKB (Figure 4I).
Next, we constructed a transcriptional regulatory network (TRN) by integrating our scRNA-Seq and scATAC-Seq data (supplemental Methods). For clarity, we only present the subnetwork involving interferon effector TFs, including AP-1, NFKB, STAT, and IRF factors in Figure 4J. The full TRN is provided in supplemental Table 9. Our TRN model suggests that interferon effector TFs act in a highly combinatorial fashion to regulate the MHC class I genes and other target genes in HSC/MPP-like cells. For instance, we identified binding sites of multiple interferon effector TFs in enhancers of the HLA-A, HLA-C, and B2M genes (Figure 4K).
An immunosuppressive circuit between HSPC-like cells and cytotoxic lymphocytes
We found that all 5 projected populations of HSPC-like cells were enriched for upregulated genes involved in interferon response (supplemental Table 8; supplemental Figure 4F). Therefore, we turned our attention to normal immune cells (Figure 5A; supplemental Figure 5A) to identify the source of interferon that HSPC-like cells respond to. We found that NK T cells (and to a lesser extent, NK cells) were the major source of IFNG in our patient cohort (Figure 5B). Interestingly, we found a higher fraction of NK T cells in younger patients (supplemental Figure 5B) and a higher fraction of NK T cells expressing IFNG in younger patients (P = 7e-5) (Figure 5C). The HSPC-like population also expressed a higher level of IFNGR2 compared with normal HSC/MPPs (P = 9e-3) (Figure 5C). Moreover, the fraction of NK T cells expressing IFNG in each patient is positively correlated with the fraction of HSPC-like cells expressing IFNGR2 (supplemental Figure 5C). These results suggest an aberrantly elevated IFNG signaling between HSPC-like cells and NK T cells in infants <6 months.
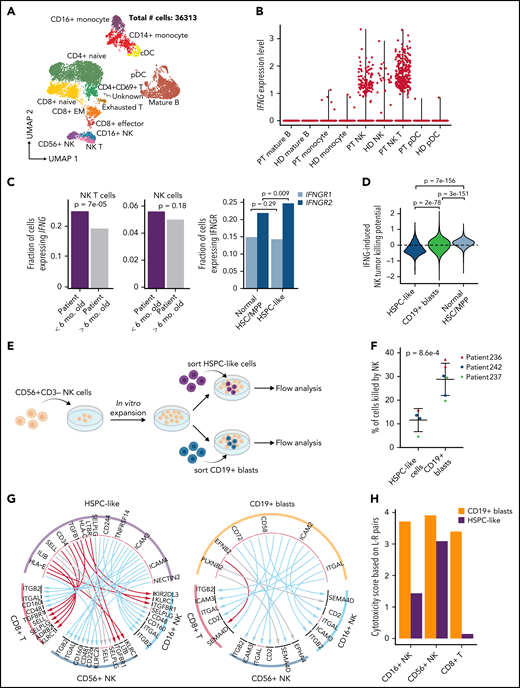
An immunosuppressive circuit between HSPC-like cells and cytotoxic lymphocytes in younger patients. (A) UMAP of scRNA-Seq data for normal immune cells in 18 KMT2A-r patients. Number of sequenced cells is indicated. (B) NK T cells are the major source of IFNG in patients. Shown are violin plots of IFNG expression in various immune cell populations in both KMT2A-r patients and healthy donors. HD, healthy donor; PT, patient. (C) Upregulated IFNG signaling in the HSPC-like population in younger patients. Left, barplot showing younger patients have a higher fraction of NK T cells expressing IFNG. Right, barplot showing IFGN receptor 2 gene (IFNGR2) was expressed higher in HPSC-like cells in the PB of younger infants with ALL compared with normal BM HSC/MPPs. (D) Activating and suppressive signaling pathways for NK cell cytotoxicity induced by IFNG signaling in blasts. Y-axis, potential for inducing NK cell cytotoxicity based on combined normalized expression of genes in activating and suppressive pathways in HSPC-like cells, CD19+ blasts, and normal HSC/MPPs. (E) Schematic overview of blast and NK cell coculture experiment. (F) Percentage of HSPC-like cells and CD19+ blasts killed by NK cells. Dots represent different patient samples. P values were computed using Student t-test. (G) Predicted L-R interactions between the leukemia cell containing HSPC-like population (left panel) or CD19+ blasts (right panel) and 2 major classes of cytotoxic lymphocytes, CD8+ T cells and NK cells. Red, blue, and gray arcs, suppressive, activating, and unknown interactions, respectively. (H) Cytotoxicity scores of NK and CD8+ T cells based on combined activating and suppressive signaling between the cytotoxic lymphocyte and the HSPC-like/blast populations via L-R pairs (see supplemental Methods for details). L-R pairs were based on those in panel E.
An immunosuppressive circuit between HSPC-like cells and cytotoxic lymphocytes in younger patients. (A) UMAP of scRNA-Seq data for normal immune cells in 18 KMT2A-r patients. Number of sequenced cells is indicated. (B) NK T cells are the major source of IFNG in patients. Shown are violin plots of IFNG expression in various immune cell populations in both KMT2A-r patients and healthy donors. HD, healthy donor; PT, patient. (C) Upregulated IFNG signaling in the HSPC-like population in younger patients. Left, barplot showing younger patients have a higher fraction of NK T cells expressing IFNG. Right, barplot showing IFGN receptor 2 gene (IFNGR2) was expressed higher in HPSC-like cells in the PB of younger infants with ALL compared with normal BM HSC/MPPs. (D) Activating and suppressive signaling pathways for NK cell cytotoxicity induced by IFNG signaling in blasts. Y-axis, potential for inducing NK cell cytotoxicity based on combined normalized expression of genes in activating and suppressive pathways in HSPC-like cells, CD19+ blasts, and normal HSC/MPPs. (E) Schematic overview of blast and NK cell coculture experiment. (F) Percentage of HSPC-like cells and CD19+ blasts killed by NK cells. Dots represent different patient samples. P values were computed using Student t-test. (G) Predicted L-R interactions between the leukemia cell containing HSPC-like population (left panel) or CD19+ blasts (right panel) and 2 major classes of cytotoxic lymphocytes, CD8+ T cells and NK cells. Red, blue, and gray arcs, suppressive, activating, and unknown interactions, respectively. (H) Cytotoxicity scores of NK and CD8+ T cells based on combined activating and suppressive signaling between the cytotoxic lymphocyte and the HSPC-like/blast populations via L-R pairs (see supplemental Methods for details). L-R pairs were based on those in panel E.
IFNG signaling in tumor cells affects 2 important classes of genes relevant to lymphocytes. Induction of the MHC class I genes in tumor cells can function as suppressive signals for NK cell cytotoxicity, whereas induction of cell adhesion genes such as ICAM1 function as activating signals for NK cell cytotoxicity.24,25 We, therefore, computed an NK cell cytotoxicity score induced by IFNG signaling in the CD19+ blast and HSPC-like population based on the expression levels of the 2 classes of genes. We found that signaling to cytotoxic lymphocytes by HSPC-like cells has an overall immunosuppressive effect toward NK cells compared with CD19+ blasts and normal HSPCs (P < 1e-10) (Figure 5D). To functionally validate this observation, we sorted HSPC-like cells and CD19+ blasts from 3 infant ALL samples (supplemental Table 1) and performed NK cell coculture assays (Figure 5E). Cells in the HSPC-like population indeed were killed much less efficiently, reflecting their immunosuppressive effect toward NK cells (P = 8.6e-4) (Figure 5F; supplemental Figure 5D).
To further understand signaling between leukemia blasts and cytotoxic lymphocytes, we conducted a systematic search of active ligand-receptor (L-R) pairs mediating signal transduction between CD8+ T/NK cells and CD19+ blasts/HSPC-like cells (Figure 5G; supplemental Table 10; supplemental Methods). Strikingly, the majority of L-R pairs between HSPC-like cells and CD8+ T/NK cells are known to exert a suppressive effect on cytotoxic lymphocytes.26-29 Example L-R pairs include killer Ig-like receptors (KIRs) and MHC class I proteins,30-32 transforming growth factor β (TGFB) and receptor (TGFBR).33-35 We next computed an overall lymphocyte cytotoxicity score by summing the normalized expression levels of all predicted L-R pairs between blasts and lymphocytes. We found that the cytotoxic scores are lower for all 3 types of lymphocytes (CD8+ T, CD16+ NK, and CD56+ NK) when considering interactions with HSPC-like cells compared with interactions with CD19+ blasts (Figure 5H). These results suggest that HSPC-like cells exert an overall immunosuppressive effect on cytotoxic lymphocytes they interact with, which may facilitate the immune escape of leukemic cells contained within this population.
Preexisting lymphomyeloid primed progenitor and myeloid primed blasts in treatment-naive B-ALL predict lineage switch
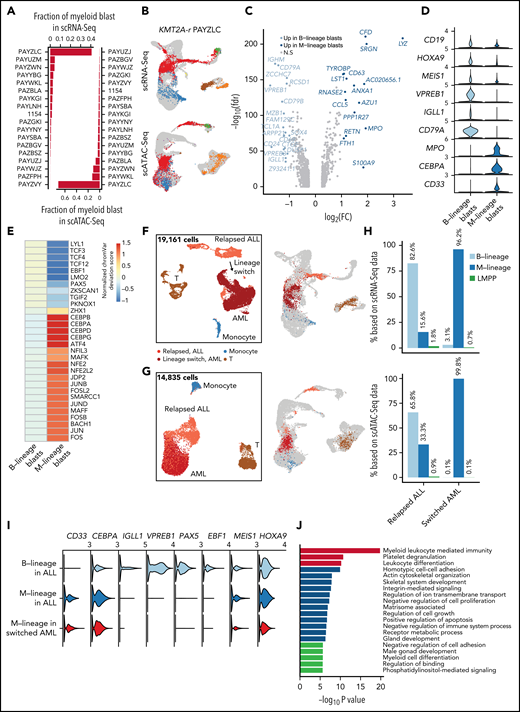
Lineage switch from a lymphoid to a myeloid fate at relapse is usually associated with poor outcome. Previous studies have shown that lineage switch predominantly occurs in KMT2A-r leukemia and in younger patients.36,37 Among our cohort of 18 treatment-naive KMT2A-r patients who were clinically diagnosed as B-cell precursor ALL, several had substantial blast subpopulations that mapped to myeloid fates by RNA-Seq and ATAC-Seq at diagnosis (Figure 6A-B).
Preexisting lymphomyeloid primed progenitor and myeloid blasts in treatment-naive patients as indicators of lineage switch. (A) Frequencies of CD19+ blasts that were projected to the myeloid lineage (GMPs, monocytes, and dendritic cells) in all 18 infant KMT2A-r patients based on scRNA-Seq and scATAC-Seq data. (B) Projection of patient PAYZLC data onto normal hematopoietic trajectory. Top panel, projection of scRNA-Seq data. Bottom panel, projection of scATAC-Seq data. Gray dots, cells from healthy donors; colored dots, patient cells. (C) Volcano plot for differentially expressed genes between M-lineage blasts and B-lineage blasts. Analysis was based on projected blasts from all 18 patients. DEGs were identified with the cutoff of abs(log2FC) >0.5 and FDR <0.01. Those with abs(log2FC) >1 are highlighted in blue. (D) Violin plots for representative signature genes in M-lineage blasts and B-lineage blasts. (E) Heatmap of differential TF motif accessibility in B-lineage and myeloid-lineage blasts. Analysis was based on projected blasts from 18 patients. Values are z-score normalized deviation scores calculated using chromVAR. TFs with differential accessibility between B-lineage and myeloid-lineage blasts were identified using Wilcoxon test of the normalized deviation scores between the 2 groups with an FDR cutoff <0.05. (F-G) UMAP of scRNA-Seq (F) and scATAC-Seq (G) data for a pediatric KMT2A-r patient with paired samples before and after lineage switch. Left panel, UMAP of paired samples, colored by assigned cell populations. Total numbers of sequenced cells are indicated. Right panel, projection of patient cells to the normal hematopoietic trajectory. Gray dots, cells from healthy donors; colored dots, patient cells. (H) Fraction of B-, myeloid-lineage, and LMPP blasts before and after lineage switch. Top panel, fraction based on scRNA-Seq data; bottom panel, fraction based on scATAC-Seq data. (I) Violin plots of gene expression of B-lineage and myeloid-lineage marker genes before and after lineage switch. (J) Enriched pathways among differentially expressed genes between normal LMPP from healthy donors and LMPP-like blasts in patient samples before lineage switch.
Preexisting lymphomyeloid primed progenitor and myeloid blasts in treatment-naive patients as indicators of lineage switch. (A) Frequencies of CD19+ blasts that were projected to the myeloid lineage (GMPs, monocytes, and dendritic cells) in all 18 infant KMT2A-r patients based on scRNA-Seq and scATAC-Seq data. (B) Projection of patient PAYZLC data onto normal hematopoietic trajectory. Top panel, projection of scRNA-Seq data. Bottom panel, projection of scATAC-Seq data. Gray dots, cells from healthy donors; colored dots, patient cells. (C) Volcano plot for differentially expressed genes between M-lineage blasts and B-lineage blasts. Analysis was based on projected blasts from all 18 patients. DEGs were identified with the cutoff of abs(log2FC) >0.5 and FDR <0.01. Those with abs(log2FC) >1 are highlighted in blue. (D) Violin plots for representative signature genes in M-lineage blasts and B-lineage blasts. (E) Heatmap of differential TF motif accessibility in B-lineage and myeloid-lineage blasts. Analysis was based on projected blasts from 18 patients. Values are z-score normalized deviation scores calculated using chromVAR. TFs with differential accessibility between B-lineage and myeloid-lineage blasts were identified using Wilcoxon test of the normalized deviation scores between the 2 groups with an FDR cutoff <0.05. (F-G) UMAP of scRNA-Seq (F) and scATAC-Seq (G) data for a pediatric KMT2A-r patient with paired samples before and after lineage switch. Left panel, UMAP of paired samples, colored by assigned cell populations. Total numbers of sequenced cells are indicated. Right panel, projection of patient cells to the normal hematopoietic trajectory. Gray dots, cells from healthy donors; colored dots, patient cells. (H) Fraction of B-, myeloid-lineage, and LMPP blasts before and after lineage switch. Top panel, fraction based on scRNA-Seq data; bottom panel, fraction based on scATAC-Seq data. (I) Violin plots of gene expression of B-lineage and myeloid-lineage marker genes before and after lineage switch. (J) Enriched pathways among differentially expressed genes between normal LMPP from healthy donors and LMPP-like blasts in patient samples before lineage switch.
Myeloid-like blasts differentially expressed 231 genes, including key myeloid lineage-specific genes such as MPO, CEBPA, and CD33 (Figure 6C-D). scATAC-Seq analysis further confirmed activity of lineage-specific TFs in the myeloid-like blasts (eg, C/EBP factors and BACH1 and 2) and B-lineage blasts (eg, EBF1 and PAX5), respectively (Figure 6E; supplemental Figure 6A). Collectively, these data document preexisting blasts with myeloid potential in patients at initial diagnosis of B-ALL. To further test the myeloid potential of this population, we analyzed longitudinal samples from 2 BCP-ALL KMT2A-r patients whose disease underwent a lineage switch. Patient 1 developed a lineage switch to AML after treatment with CART-19 for relapsed B-ALL (supplemental Figure 6B). Patient 2 was treated with CART-19 for relapsed KMT2A-r ALL, relapsed with CD19-negative ALL, and received inotuzumab (anti-CD22 monoclonal antibody) followed by CART-22 therapy for CD22+ persistent disease (supplemental Figure 6C). The patient subsequently relapsed with AML. In both patients, we identified a preexisting blast population with myeloid potential before lineage switch in our scRNA-Seq and scATAC-Seq data, which expanded under the pressure of immunotherapy (Figure 6F-I; supplemental Figure 6D-G). At all time points, the myeloid potential by scATAC-Seq exceeded the expression of myeloid signature genes, underscoring the much greater power of single-cell epigenomic profiling to detect lineage potential compared with transcriptomic analysis. To investigate the potential of myeloid-biased blasts, we transplanted mice with 3 subpopulations sorted from the initial diagnostic sample of patient #1979 (supplemental Figure 6C): immature (CD19+CD34+CD38−), lymphoid (CD19+CD33−), and lymphoid with coexpression of myeloid markers (CD19+CD33+). Once mice developed leukemia, we determined the immunophenotype of engrafted hCD45+ leukemic cells. We found that lymphoid subpopulation only gave rise to CD19+ lymphoid leukemia, while the CD19+/CD33+ and CD19+/CD34+ subpopulations gave rise to a bulk CD19+CD33− population and a substantial CD19+CD33+ subclone, recapitulating the original leukemia (supplemental Figure 6H). This data supports the coexistence of subclones with different degrees of myeloid potential and plasticity and suggests the eventual evolution to a full myeloid switch under pressure of B-cell–directed therapy.
Besides preexisting myeloid-biased blasts, we also identified a small fraction of lymphomyeloid-primed progenitors-like (LMPP-like) blasts in multiple patients of our infant cohort (supplemental Figure 7A-B). These LMPP-like blasts were also present both pre and postswitch in our pediatric longitudinal samples (Figure 6H; supplemental Figure 7D). Interestingly, the fractions of LMPP-like blasts and myeloid-like blasts were significantly correlated across our patient cohort (Spearman correlation = 0.61 and 0.68; P value = .004 and .001) (supplemental Figure 7C). To test the hypothesis of an altered differentiation program in LMPP-like blasts, we performed differential expression analysis and identified 483 and 752 DEGs between normal LMPPs and LMPP-like blasts from pre and postlineage switch samples, respectively. Strikingly, the top enriched pathway among the DEGs in both comparisons was myeloid leukocyte mediated immunity (Figure 6J; supplemental Figure 7D). Interestingly, our transplantation experiment shows that immature subpopulation (CD19+CD34+CD38−) was able to generate both CD19 only and CD19+CD33+ leukemias, with a trend toward higher CD33 expression in NSGS recipients (P = .064 in BM) (supplemental Figure 6H), which were previously shown to support myeloid skewing of MLL-AF4 transduced human CD34+ cord blood cells.38 In summary, these data suggest that altered differentiation of LMPP with a myeloid-lineage bias contributes to lineage switch under therapeutic pressure.
Discussion
Infant KMT2A-r ALL (iALL) is known to have vastly different outcomes depending on the age of presentation.5 Both cell-intrinsic and extrinsic factors have been suggested to contribute to more aggressive disease originating in utero.39-44 So far, murine models have failed to address the key problem in iALL: the extreme therapy refractory nature of iALL, specifically in young infants. In our study, we were able to determine the following 4 tangible reasons that explain upfront resistance in a subset of cells and that show a clear correlation with age at presentation.
First, leukemia cells from younger infants arrest across a broader range of developmental stages, including a subset of cells that map to highly immature HSPCs. While the existence of a true “leukemia stem cell” in ALL is controversial,12 the presence of more stem cell–like transcriptional signatures has been linked to chemotherapy resistance and poor outcome in multiple hematopoietic malignancies.12,13
Second, in the most immature leukemic subpopulation, steroid response signatures are significantly lower in younger infants compared with older infants. Steroid response has long been recognized as strongly predictive of outcome,15,45 but differential steroid response signatures were not evident when analyzing bulk leukemic populations. However, in the most immature compartments, decreased steroid response became the top differentially regulated pathway. We functionally validated the importance of the steroid receptor NR3C1 in KMT2A-r ALL cells. Critically, we previously found that the NR3C1 TF motif was highly enriched in open chromatin of mouse fetal HSCs compared with adult HSCs.46 Our data thus support a model whereby an earlier cell of origin may result in decreased steroid responsiveness of a subset of iALL cells, which survive the heavily steroid-reliant induction chemotherapy and represent a reservoir for eventual relapse.
Third, in addition to increased “linear” developmental plasticity along the B-cell developmental axis, leukemic cells in younger infants display decreased lineage fidelity compared with older patients. KMT2A-r leukemias have long been suspected to originate from an uncommitted precursor.47 Our data strongly supports this notion and documents a previously unrecognized degree of lineage infidelity as well as a surprising degree of myeloid potential in a subset of patients. This aspect of our data lends support to the “MPAL”-like approach suggested by the recent report on the Interfant-06 clinical trial, where infants who failed to achieve a satisfactory response to B-ALL induction therapy appeared to benefit from switching to an “AML-like” consolidation.48 We also document the potential of myeloid-primed subpopulations at diagnosis to serve as a reservoir for lineage switch under the pressure of B-cell–directed immunotherapy.
Fourth, one of the most interesting and unanticipated aspects of our study was the detection of leukemic cells within a CD34+CD19− HSPC-like population in younger patients that can evade cytotoxic T and NK cells. Here, we reported an immunosuppressive signaling circuit specifically in younger infants. This circuit includes increased IFNG produced by NK T cells, evidence of response to IFNG signaling in the HSPC-like cells, and suppressive signaling from HSPC-like cells back to cytotoxic NK and T cells. Furthermore, the characterization of immunosuppressive ligands on the surface of the most immature subpopulation within the leukemic population explains the failure of HSCT to change the outcome of iALL and supports exploring the modulation of interferon signaling and/or immune synapses as potentially promising immunotherapy approaches.
In summary, our data support a model where features of fetal progenitors, the likely cell of origin of iALL, mediate developmental plasticity, lineage infidelity, and intrinsic therapy resistance of an immature subset of blasts. Our findings thus support approaches geared toward understanding and modulating fetal developmental features, targeted inhibitors, or immunotherapy approaches rather than optimization of conventional stem cell-sparing chemotherapy or lineage-restricted immunotherapy, both of which fail to address the key underlying biological features of iALL.
Acknowledgments
The authors acknowledge the Children’s Oncology Group and the Children’s Hospital of Philadelphia Center for Childhood Cancer Research biorepositories for provision of primary patient leukemia specimens. The authors thank Danika Makowski of the Center for Pediatric Tumor Cell Atlas for administrative support and Hamid Bassiri for discussion about NK cell biology.
This work was supported by the National Cancer Institute (NCI) HTAN under award U2C CA233285 (K.T. and S.P.H.). Additional support includes NCI award CA243072 (K.T.), grants from the Emerson Collective and the Coco Foundation (K.M.B.), a Department of Defense CDMRP award W81XWH2010357 (D.M.B., E.M.G., and P.A.B.), a National Human Genome Research Institute award HG010646, a National Heart, Lung, and Blood Institute award DP2-HL142044 (H.W.), and a Roberts Collaborative Rapid Grant (K.W.).
Authorship
Contribution: K.T., K.M.B., and D.M.B. conceived the study; C.C. designed and performed experiments, analyzed and interpreted data, and wrote the manuscript; W.Y. developed the data analysis pipelines, analyzed and interpreted data, and wrote the manuscript; Y.U., L.F., K.W., Y.H., and Q.Z. developed analytic pipelines and performed data analysis; F.A., Q.Q., C.-h.C., J.F., P.G., and C.L. performed additional experiments; A.F. and I.R. performed data curation; P.A.B., E.M.G., H.W., S.P.H., C.A.F., and J.W.D. provided patient samples and interpreted data; K.T., K.M.B., and D.M.B. supervised the overall study, designed experiments, and interpreted data; K.T. and K.M.B. wrote the manuscript; and all authors approved the final version of the manuscript.
Conflict-of-interest disclosure: S.P.H. has received consulting fees from Novartis, honoraria from Jazz Pharmaceuticals, Servier, and Amgen, and owns common stock in Amgen. C.A.F. is a named inventor on the following issued patents filed by the Children’s Hospital of Philadelphia that have not been licensed: Methods and Kits for Analysis of Chromosomal Rearrangements Associated with Leukemia. United States of America 6 368 791. 2002 April 09; Compositions and Methods for the Detection of DNA Topoisomerase II Complexes with DNA. United States of America 8 642 265 B2. 2014 February 04. CYP3A4 NFSE Variant and Methods of Use Thereof. United States of America 6 174 684. 2001 January 16. The remaining authors declare no competing financial interests.
The current affiliation for J.F. is Johns Hopkins University, Baltimore, MD.
The current affiliation for P.G. is The First Affiliated Hospital of Xi'an Jiaotong University, Xi'an, China.
The current affiliation for C.L. is Boston Children's Hospital, Boston, MA.
The current affiliation for A.F. is Illumina, Inc, San Diego, CA.
The current affiliation for D.M.B. is Tmunity Therapeutics Inc., Philadelphia, PA.
Correspondence: Kai Tan, 4004 CTRB, 3501 Civic Center Blvd, Philadelphia, PA 19104; e-mail: tank1@chop.edu; Kathrin M. Bernt, 3064 CTRB, 3501 Civic Center Blvd, Philadelphia, PA 19104; e-mail: berntk@chop.edu; and David M. Barrett, 3020 Market St, Suite 535, Philadelphia, PA 19104; e-mail: david.barrett@tmunity.com.
Data from this study have been deposited at the Human Tumor Atlas Network (HTAN) data portal: https://data.humantumoratlas.org/. The linkage between HTAN parent IDs and sample IDs was provided in supplemental Table 1. Analysis scripts were deposited at https://github.com/tanlabcode/KMT2Ar_Paper.
The online version of this article contains a data supplement.
There is a Blood Commentary on this article in this issue.
The publication costs of this article were defrayed in part by page charge payment. Therefore, and solely to indicate this fact, this article is hereby marked “advertisement” in accordance with 18 USC section 1734.

This feature is available to Subscribers Only
Sign In or Create an Account Close Modal