

Key Points
KDM5 inhibition reverts the effects of KMT2D mutations by increasing levels of H3K4me3 and restoring expression of KMT2D-regulated genes.

Abstract
Loss-of-function mutations in KMT2D are a striking feature of germinal center (GC) lymphomas, resulting in decreased histone 3 lysine 4 (H3K4) methylation and altered gene expression. We hypothesized that inhibition of the KDM5 family, which demethylates H3K4me3/me2, would reestablish H3K4 methylation and restore the expression of genes repressed on loss of KMT2D. KDM5 inhibition increased H3K4me3 levels and caused an antiproliferative response in vitro, which was markedly greater in both endogenous and gene-edited KMT2D mutant diffuse large B-cell lymphoma cell lines, whereas tumor growth was inhibited in KMT2D mutant xenografts in vivo. KDM5 inhibition reactivated both KMT2D-dependent and -independent genes, resulting in diminished B-cell signaling and altered expression of B-cell lymphoma 2 (BCL2) family members, including BCL2 itself. KDM5 inhibition may offer an effective therapeutic strategy for ameliorating KMT2D loss-of-function mutations in GC lymphomas.
Introduction
The histone-methyltransferase KMT2D (ENSG00000167548; MLL2/Mll4) is lost in a striking proportion of germinal center (GC) lymphomas, with 80% of follicular lymphoma (FL)1-4 and 30% of germinal centre B-cell–like (GCB) diffuse large B-cell lymphoma (DLBCL) cases harboring mutations5-7 that are generally truncating, clonal, and often biallelic.1,8-10 KMT2D mutations occur alongside frequent mutations in the epigenetic regulators CREBBP and EZH2; however, in contrast to these lesions, no therapies targeting KMT2D mutations have been reported.
KMT2D is a member of the KMT2 family of methyltransferases (KMT2A-H), which catalyze the mono-, di-, and trimethylation of histone 3 lysine 4 (H3K4),11 with H3K4me1 predominantly located at enhancers and H3K4me3 at active/poised promoters.12 Although KMT2D has preferential mono-methyltransferase activity and deposits H3K4me1 at enhancers, it also acts as the central structural component of the complex of proteins associated with Set1–like multiprotein complex and is required for the correct recruitment of the histone acetyltransferases EP300/CREBBP and the H3K27me3 demethylase KDM6A.13,14 Loss of Kmt2d has been demonstrated to decrease H3K4me1/me2 deposition, alter gene expression, and cooperate with Bcl2 overexpression in VavP-Bcl2 mice to drive lymphomagenesis.9,10 Germline KMT2D mutations are also the predominant cause of Kabuki syndrome, a developmental disorder with defects in B-cell development but no apparent increase in GC lymphoma prevalence,15,16 highlighting that KMT2D mutations are likely to cooperate with other lesions to cause GC lymphomas.
H3K4 methylation is also regulated by the lysine specific demethylase (KDM) families LSD1 and KDM5, which demethylate H3K4me1 to H3K4me0 and H3K4me3/me2 to H3K4me1, respectively. The KDM5 family, consisting of 4 family members (KDM5A-D), uses α-ketoglutarate as a substrate and regulates gene expression in a variety of contexts. Although mutations of KDM5 genes are rare, they have been implicated as potential therapeutic targets because of their upregulation in several cancers and role in driving drug resistance.17-20
In this report, we hypothesized that KDM5 inhibition would reestablish H3K4 methylation and restore the expression of genes deregulated on loss of KMT2D. Using several KDM5 inhibitors (KDM5i), we demonstrate that KDM5 inhibition has strong antiproliferative and cytotoxic activity on GCB-DLBCL cell lines through a combination of regulating B-cell receptor (BCR) signaling and the expression of B-cell lymphoma 2 (BCL2) family members. Critically, KDM5 inhibition sensitivity is dependent on the presence of KMT2D mutations, suggesting that KDM5 inhibition may offer a targeted therapy for KMT2D mutant GC lymphomas.
Methods
Please see supplemental Information, available on the Blood Web site for full details.
Cell culture
All cell lines were cultured in a 37°C, 5% CO2 humidified incubator using RPMI-1640 supplemented with 10% fetal bovine serum, 1% l-glutamine, and 1% Pen-Strep, except OCI-LY-1 and OCI-LY-7, which were cultured in Iscove modified Dulbecco medium with 20% fetal bovine serum, 1% l-glutamine, and 1% Pen-Strep (supplemental Table 1). Cell lines were acquired from DSMZ (Deutsche Sammlung von Mikroorganismen und Zellkulturen GmbH) or an institute tissue bank. Identity was confirmed by short tandem repeat sequencing and regularly checked by Sanger sequencing of unique mutations and for Mycoplasma contamination.
Cell viability and apoptosis
Viable cell numbers were determined using the Guava ViaCount Assay (Millipore) or CellTitreGlo (Promega), whereas apoptosis was quantified by the Guava Nexin Assay (Millipore).
RNA extraction
RNA was extracted using QIAGEN RNeasy Kits including an on-column DNase step. RNA for sequencing was determined to be of high quality by Tapestation (RNA integrity number >9.5).
Complementary DNA synthesis and quantitative reverse transcriptase polymerase chain reaction
Complementary DNA was synthesized using the high-capacity complementary DNA Reverse Transcription Kit (Thermo Fisher Scientific), and quantitative polymerase chain reaction was performed using the SsoAdvanced Universal SYBR Green Supermix (BioRad). Reactions were performed in triplicate and normalized to GAPDH. All primer sequences are listed in supplemental Table 2.
Chromatin immunoprecipitation
Chromatin immunoprecipitation (ChIP) was performed using a modified version of the Active Motif ChIP-IT High-Sensitivity Kit.
Gene editing
Clustered regularly interspaced short palindromic repeats (CRISPR) was performed by annealing guide RNAs (supplemental Table 3) to tracrRNA, followed by complexing to Cas9 protein, to generate ribonucleicprotein complexes. Ribonucleicproteins were nucleofected (supplemental Table 4), alongside a donor template when correcting the KMT2D mutation in SU-DHL-8 cells. After 48 hours, single-cell cloning was performed, and Sanger sequencing was used to identify mutant clones.
Results
KDM5 inhibition increases H3K4me3 levels in GC lymphoma cells
To assess whether the KDM5 family was a suitable therapeutic target for GC lymphomas, we first quantified the expression of KDM5A-D in DLBCL cell lines, primary FL (ICGC21 ) and DLBCL (ICGC/TCGA) biopsies and normal GC B cells (BLUEPRINT22 ) (Figure 1A-B). KDM5A and KDM5C were highly expressed in all the samples, whereas the Y-linked KDM5D was only expressed in male-derived cell lines (Figure 1A). Protein expression was confirmed for KDM5A, KDM5C, and KDM5D by western blot analysis (supplemental Figure 1a).
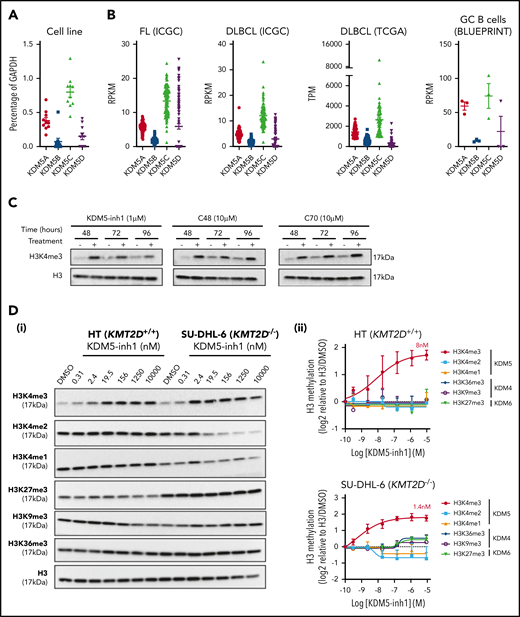
KDM5 inhibition increases H3K4me3 levels in DLBCL cell lines. (A) The expression of the 4 KDM5 family members (KDM5A-D) was examined by quantitative reverse transcriptase-polymerase chain reaction in 10 DLBCL cell lines and normalized to the expression of GAPDH. Data are the mean ± standard error of the mean (SEM) of 3 independent experiments. (B) KDM5 family member expression was examined by RNA-seq in publicly available datasets of FL (ICGC, n = 9721 ) and DLBCL (TCGA, n = 48; ICGC, n = 74) patients, plus healthy GC B cells (BLUEPRINT22 ). RPKM, reads per kilobase million; TPM, transcripts per million. (C) SU-DHL-6 cells were treated with 1 µM KDM5-inh1 or 10 µM Compound-48 and KDM5-C70 for 48, 72, and 96 hours, followed by western blot analysis of H3K4me3 levels relative to H3. (D) The SU-DHL-6 and HT cell lines were treated with DMSO or increasing concentrations of KDM5-inh1 for 48 hours. Representative western blots for H3K4me3/me2/me1 (KDM5), H3K9me3/K36me3 (KDM4), H3K27me3 (KDM6), and H3 (i). Quantification of western blots relative to H3 (ii). Data are mean ± SEM of 3 independent experiments.
KDM5 inhibition increases H3K4me3 levels in DLBCL cell lines. (A) The expression of the 4 KDM5 family members (KDM5A-D) was examined by quantitative reverse transcriptase-polymerase chain reaction in 10 DLBCL cell lines and normalized to the expression of GAPDH. Data are the mean ± standard error of the mean (SEM) of 3 independent experiments. (B) KDM5 family member expression was examined by RNA-seq in publicly available datasets of FL (ICGC, n = 9721 ) and DLBCL (TCGA, n = 48; ICGC, n = 74) patients, plus healthy GC B cells (BLUEPRINT22 ). RPKM, reads per kilobase million; TPM, transcripts per million. (C) SU-DHL-6 cells were treated with 1 µM KDM5-inh1 or 10 µM Compound-48 and KDM5-C70 for 48, 72, and 96 hours, followed by western blot analysis of H3K4me3 levels relative to H3. (D) The SU-DHL-6 and HT cell lines were treated with DMSO or increasing concentrations of KDM5-inh1 for 48 hours. Representative western blots for H3K4me3/me2/me1 (KDM5), H3K9me3/K36me3 (KDM4), H3K27me3 (KDM6), and H3 (i). Quantification of western blots relative to H3 (ii). Data are mean ± SEM of 3 independent experiments.
We then examined the effect of 3 different KDM5is on H3K4 methylation; KDM5-inh1 (patent no. WO 2014/131777 A1; EpiTherapeutics/Gilead23 ), Compound 48 (Constellation Pharmaceuticals24 ), and KDM5-C70,25 all of which are competitive inhibitors of α-ketoglutarate binding. All 3 increased H3K4me3, with KDM5-inh1 significantly more potent than Compound 48 and KDM5-C70 (Figure 1C). In KMT2D wild-type (WT) HT cells and mutant SU-DHL-6 cells, KDM5-inh1 induced similar increases in H3K4me3 (8 vs 1.4 nM half maximal effective concentration [EC50]), while H3K4me1/H3K4me2 were only decreased in SU-DHL-6 cells (Figure 1D). In addition, KDM5-inh1 increased H3K4me3 levels in primary FL cell suspensions (supplemental Figure 1d-e) and did not alter KDM5A/KDM5C protein levels (supplemental Figure 1b-c) or histone marks mediated by the closely related KDM4 (H3K9me3/H3K36me3) and KDM6 (H3K27me3)17 families (Figure 1D), indicating that KDM5-inh1 is a specific and potent KDM5i.
KDM5 inhibition has selective cytostatic and cytotoxic activity in KMT2D mutant cell lines
We next examined the cytostatic activity of KDM5 inhibition and found that KDM5-inh1 had a significantly greater antiproliferative effect on KMT2D mutant cell lines (Figure 2A-C; supplemental Figure 2a). Compound 48 and KDM5-C70 were less potent, although they reduced proliferation in SU-DHL-6 and OCI-LY-18, the cell lines most sensitive to KDM5-inh1 (supplemental Figure 2a). The majority (6 of 8) also displayed lower EC50 values after 10 days of treatment (supplemental Figure 2b-c), indicating that KDM5 inhibition has sustained antiproliferative activity, whereas apoptosis was induced in the most sensitive cell lines (Figure 2D; supplemental Figure 2d).
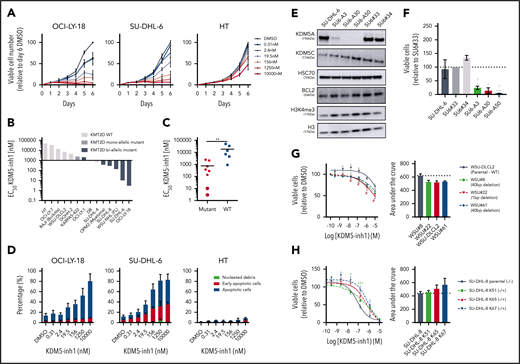
KDM5 inhibition reduces the proliferation of KMT2D mutant cell lines. (A-B) DLBCL, FL, myeloma, and Burkitt’s lymphoma cell lines were treated with DMSO or increasing concentrations of KDM5-inh1, and viable cells were quantified every day up to 6 days for OCI-LY-18, SU-DHL-6, and HT cells (A) and after 5 days for all cell lines (B), with EC50 values for KMT2D WT and mutant cell lines displayed in a waterfall plot. (C) Dot plot showing the significantly lower EC50 values for KMT2D mutant cell lines. Statistical significance was determined by Mann-Whitney U test: **P < .01. (D) Induction of apoptosis was quantified in OCI-LY-18, SU-DHL-6, and HT cells treated with DMSO or increasing concentrations of KDM5-inh1 for 5 days. (E) Western blots showing loss of KDM5A in 3 homozygous knockout clones (SU6-A3, A30, A50) compared with parental and WT controls (SU6#33, #34), alongside expression of KDM5C, BCL2, and H3K4me3 levels. (F) Parental, control, and KDM5A knockout SU-DHL-6 cells were seeded at 4000 cells per well, and viable cell numbers were quantified after 6 days. Statistical significance was calculated using a 2-way analysis of variance (ANOVA) with a Tukey’s posttest: *P < .05 and ***P < .001 relative to SU6#33, and #P < .05 relative to SU6#34. (G-H) Viable cell counts from WSU-DLCL2 cells and 3 KMT2D mutant clones (G) or parental SU-DHL-8 cells and 3 corrected clones (H) treated with DMSO or increasing concentrations of KDM5-inh1 for 5 days. Data are the mean ± standard error of the mean of 3 to 7 independent experiments. Statistical significance was calculated using a 2-way ANOVA with a Dunnett’s posttest: */#P < .005; ***P < .001.
KDM5 inhibition reduces the proliferation of KMT2D mutant cell lines. (A-B) DLBCL, FL, myeloma, and Burkitt’s lymphoma cell lines were treated with DMSO or increasing concentrations of KDM5-inh1, and viable cells were quantified every day up to 6 days for OCI-LY-18, SU-DHL-6, and HT cells (A) and after 5 days for all cell lines (B), with EC50 values for KMT2D WT and mutant cell lines displayed in a waterfall plot. (C) Dot plot showing the significantly lower EC50 values for KMT2D mutant cell lines. Statistical significance was determined by Mann-Whitney U test: **P < .01. (D) Induction of apoptosis was quantified in OCI-LY-18, SU-DHL-6, and HT cells treated with DMSO or increasing concentrations of KDM5-inh1 for 5 days. (E) Western blots showing loss of KDM5A in 3 homozygous knockout clones (SU6-A3, A30, A50) compared with parental and WT controls (SU6#33, #34), alongside expression of KDM5C, BCL2, and H3K4me3 levels. (F) Parental, control, and KDM5A knockout SU-DHL-6 cells were seeded at 4000 cells per well, and viable cell numbers were quantified after 6 days. Statistical significance was calculated using a 2-way analysis of variance (ANOVA) with a Tukey’s posttest: *P < .05 and ***P < .001 relative to SU6#33, and #P < .05 relative to SU6#34. (G-H) Viable cell counts from WSU-DLCL2 cells and 3 KMT2D mutant clones (G) or parental SU-DHL-8 cells and 3 corrected clones (H) treated with DMSO or increasing concentrations of KDM5-inh1 for 5 days. Data are the mean ± standard error of the mean of 3 to 7 independent experiments. Statistical significance was calculated using a 2-way ANOVA with a Dunnett’s posttest: */#P < .005; ***P < .001.
As KDM5A has been more widely described as an oncogene than KMD5C,17,18 we used CRISPR to knockout KDM5A in KMT2D mutant SU-DHL-6 cells (Figure 2E). KDM5A−/− knockout cells had increased H3K4me3 levels (∼50%; Figure 2E) and reduced proliferation relative to WT SU-DHL-6 cells, although apoptosis was not induced (Figure 2F; supplemental Figure 3a-b). Given the modest alterations in global H3K4me3 and lack of apoptosis induction, it is likely that depletion of multiple isoforms is required to induce a robust therapeutic response.
Inducing and correcting KMT2D mutations alters KDM5 inhibition sensitivity
Because KMT2D mutant cells were more sensitive to KDM5 inhibition than WT (Figure 2b-c), we used CRISPR to introduce KMT2D mutations in WSU-DLCL2, the least sensitive t(14;18)-positive KMT2D WT cell line. Three WSU-DLCL2 clones (#8, #22, #61; supplemental Table 5) harboring monoallelic truncating mutations displayed reduced proliferation after KDM5 inhibition (Figure 2G). Global levels of H3K4 methylation appeared unaltered by KMT2D loss in untreated cells, whereas KDM5 inhibition induced similar increases in H3K4me3 in mutant and WT cells (supplemental Figure 3b-c).
CRISPR was also used to correct the homozygous 1-bp insertion (P648Tfs*2) that disrupts KMT2D in SU-DHL-8 cells, generating 3 clones where a single allele had been reverted to WT, 2 of which displayed increased global H3K4me1 (K51 and K65; supplemental Figure 3d). All these clones were more resistant to KDM5 inhibition (Figure 2H), confirming that KDM5 inhibition sensitivity is altered by KMT2D mutations.
KDM5 inhibition induces widespread increases in H3K4me3
We hypothesized that increased H3K4me3 levels would drive a gene expression program responsible for the activity of KDM5 inhibition. H3K4me3 ChIP-seq identified 11 158 peaks in untreated SU-DHL-6 cells (supplemental Table 6; supplemental Figure 4a), with the majority (72.6%) located at promoters (Figure 3A). KDM5 inhibition increased the average peak size (supplemental Figure 4b) and altered H3K4me3 levels at 2408 peaks, with 98% demonstrating increased H3K4me3 (supplemental Table 6; Figure 3B). Only a third of these peaks overlapped with promoters (Figure 3A), suggesting that KDM5 inhibition also alters H3K4me3 at enhancers. Using ChIP-seq data from GC lymphoma cell lines (ENCODE; Encyclopedia of DNA Elements) and primary GC B cells (BLUEPRINT22 ), we found that 84% to 95% of the intergenic regions regulated by KDM5 inhibition overlapped with the enhancer-associated H3K4me1 mark (supplemental Figure 4c). These regions also largely showed deposition of H3K4me3 and H3K27ac, indicating that the majority are active enhancers.
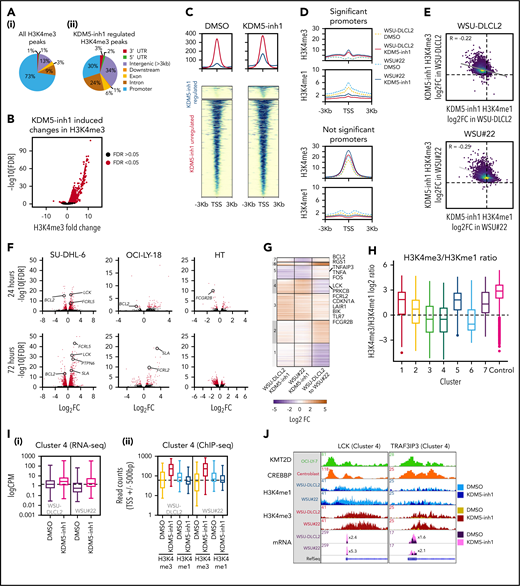
Epigenetic and transcriptomic characterization of KDM5 inhibition. (A) Genomic locations of H3K4me3 peaks identified by ChIP-seq in cells treated with DMSO (i) or 1 μM KDM5-inh1 (ii) for 72 hours. (B) KDM5 inhibition induced changes in H3K4me3, with significantly changed peaks displayed in red. (C) Heatmaps of ChIP-seq data showing difference in H3K4me3 levels between promoters significantly altered (blue) or otherwise (red) in SU-DHL-6 cells treated with DMSO or 1 µM KDM5-inh1 for 72 hours. (D) Spatial plots showing distribution of H3K4me1 and H3K4me3 at promoters with significantly altered H3K4me3 by KDM5-inh1 or otherwise in WSU-DLCL2 (yellow/red) and WSU#22−/+ (light/dark blue) cells treated with DMSO (yellow/light blue) or KDM5-inh1 (red/dark blue). (E) Plots showing broad increases in H3K4me3 and reductions in H3K4me1, quantified by ChIP-seq, at the transcription start site (TSS) (±500 bp) of H3K4me3+ genes in WSU-DLCL2 and WSU#22−/+ cells treated with 1μM KDM5-inh1. The Pearson’s correlation coefficient is indicated on each plot. (F) Volcano plots indicating DE genes in SU-DHL-6, OCI-LY-18, and HT cells treated with 1 μM KDM5-inh1 for 24 and 72 hours, with significant genes highlighted in red. (G) Heatmap showing log2FC values for 897 genes that were DE by either KDM5-inh1 or KMT2D loss and clustered using K-means clustering. (H) H3K4me3 and H3K4me1 reads were counted for the promoters in each cluster and then divided (H3K4me3/H3K4me1) and log2 normalized to create a summary ratio for each. Control promoters were identified as being H3K4me3+ in WSU-DLCL2 cells but showing no alteration in mRNA expression or H3K4me3/H3K4me1 deposition in any of our analyses. (I) Boxplots showing RNA-seq logCPM values (i) and TSS read counts across ChIP-seq (ii) datasets of genes from cluster 4. (J) ChIP-seq and RNA-seq tracks, centered on LCK and TRAF3IP3, from WSU-DLCL2 and WSU#22−/+ cells treated with KDM5-inh1 for 72 hours, plus ChIP-seq tracks of KMT2D (OCI-LY-7)9 and CREBBP (centroblasts)26 binding.
Epigenetic and transcriptomic characterization of KDM5 inhibition. (A) Genomic locations of H3K4me3 peaks identified by ChIP-seq in cells treated with DMSO (i) or 1 μM KDM5-inh1 (ii) for 72 hours. (B) KDM5 inhibition induced changes in H3K4me3, with significantly changed peaks displayed in red. (C) Heatmaps of ChIP-seq data showing difference in H3K4me3 levels between promoters significantly altered (blue) or otherwise (red) in SU-DHL-6 cells treated with DMSO or 1 µM KDM5-inh1 for 72 hours. (D) Spatial plots showing distribution of H3K4me1 and H3K4me3 at promoters with significantly altered H3K4me3 by KDM5-inh1 or otherwise in WSU-DLCL2 (yellow/red) and WSU#22−/+ (light/dark blue) cells treated with DMSO (yellow/light blue) or KDM5-inh1 (red/dark blue). (E) Plots showing broad increases in H3K4me3 and reductions in H3K4me1, quantified by ChIP-seq, at the transcription start site (TSS) (±500 bp) of H3K4me3+ genes in WSU-DLCL2 and WSU#22−/+ cells treated with 1μM KDM5-inh1. The Pearson’s correlation coefficient is indicated on each plot. (F) Volcano plots indicating DE genes in SU-DHL-6, OCI-LY-18, and HT cells treated with 1 μM KDM5-inh1 for 24 and 72 hours, with significant genes highlighted in red. (G) Heatmap showing log2FC values for 897 genes that were DE by either KDM5-inh1 or KMT2D loss and clustered using K-means clustering. (H) H3K4me3 and H3K4me1 reads were counted for the promoters in each cluster and then divided (H3K4me3/H3K4me1) and log2 normalized to create a summary ratio for each. Control promoters were identified as being H3K4me3+ in WSU-DLCL2 cells but showing no alteration in mRNA expression or H3K4me3/H3K4me1 deposition in any of our analyses. (I) Boxplots showing RNA-seq logCPM values (i) and TSS read counts across ChIP-seq (ii) datasets of genes from cluster 4. (J) ChIP-seq and RNA-seq tracks, centered on LCK and TRAF3IP3, from WSU-DLCL2 and WSU#22−/+ cells treated with KDM5-inh1 for 72 hours, plus ChIP-seq tracks of KMT2D (OCI-LY-7)9 and CREBBP (centroblasts)26 binding.
KDM5 inhibition converts H3K4me1 to H3K4me3 at promoters
To understand how KMT2D mutations alter H3K4me1/H3K4me3 and the response to KDM5 inhibition, we focused on WSU#22−/+, which we engineered from KMT2D WT WSU-DLCL2 cells to contain a heterozygous 1-bp deletion (P95Qfs*35) that is typical of the KMT2D mutations seen in GC lymphomas (Figure 2G). We first examined global changes in H3K4me3/H3K4me1 by ChIP-seq and observed modest changes in H3K4me1 (1333 altered peaks; 62.3% decreased) between untreated WSU-DLCL2 and WSU#22−/+ cells, with H3K4me3 minimally affected (49 altered peaks; supplemental Figure 4d-f; supplemental Table 6). The response to KDM5 inhibition was more dramatic, with H3K4me3 deposition broadly increased (>99%, 3244-4604 peaks) in WSU-DLCL2 and WSU#22−/+ cells, whereas H3K4me1 levels were predominantly reduced (>80%, 2469-3130 peaks; supplemental Figure 4d-f; supplemental Table 6).
We identified 10 259 promoters that were marked by H3K4me3 but not significantly altered by KDM5 inhibition in WSU-DLCL2/WSU#22−/+ cells and 1958 promoters with significantly altered H3K4me3 after KDM5 inhibition. As expected, the majority of promoters displayed a typical high H3K4me3/H3K4me1 ratio, whereas the significantly altered promoters showed an inverse low H3K4me3/H3K4me1 ratio, consistent with the pattern observed in SU-DHL-6 cells (Figure 3C-D; supplemental Figure 4g-h). Across all promoters, KDM5 inhibition reduced H3K4me1 and increased H3K4me3, although this was most striking in the low H3K4me3/H3K4me1 group (Figure 3D-E), suggesting that KDM5-inhibition activates promoters by converting H3K4me1 to H3K4me3.
KDM5 inhibition induces moderate changes in gene expression
Genes differentially expressed (DE; false discovery rate [FDR] <-0.05, log2 fold change [log2FC], >1 or less than −1) by KDM5 inhibition were identified by RNA-seq analysis of 2 KMT2D mutant sensitive (SU-DHL-6 and OCI-LY-18) and 1 WT insensitive cell line (HT) treated with 1 μM KDM5-inh1 for 24 or 72 hours. Overall, a greater number of DE genes were observed at 72 vs 24 hours in all cell lines (Figure 3F; supplemental Table 7), with the impact most striking in SU-DHL-6 (147 and 545 DE genes). In all conditions, except HT at 72 hours, the majority of DE genes were upregulated, whereas the overlap was greatest between SU-DHL-6 and OCI-LY-18 (supplemental Figure 5a-c).
Focusing on SU-DHL-6 and comparing our KDM5 inhibition RNA- and ChIP-seq data, we observed that promoter H3K4me3 correlated with gene expression (r = .28) to a greater extent than enhancer H3K4me3 levels (r = .04 vs nearest gene; supplemental Figure 5d). This was more pronounced when examining upregulated genes (0.44 vs 0.02) and indicates that KDM5 inhibition activates gene expression through promoters rather than enhancers, whereas gene downregulation may occur indirectly. Overall, KDM5 inhibition has a relatively modest impact on gene expression despite widely increasing H3K4me3.
KDM5 inhibition regulates KMT2D-dependent and -independent genes
We next compared RNA-seq profiles between WSU-DLCL2 and WSU#22−/+ cells and identified 445 genes DE after KMT2D loss, whereas KDM5 inhibition led to 309 and 339 DE genes (141 common genes; supplemental Figure 5e-f). In total, 897 genes were either DE between WSU-DLCL2 and WSU#22−/+ or after KDM5 inhibition, which separated into 7 discrete groups using K-means clustering (Figure 3G; supplemental Table 7).
The majority of genes (71%) were regulated by either KMT2D (eg, clusters 1 and 2) or KDM5 inhibition alone (eg, cluster 3). Critically, we also identified 2 clusters (4 and 5) where changes in gene expression accompanying KMT2D loss were reversed after KDM5 inhibition. Cluster 4 contained genes that were downregulated by KMT2D loss (mean log2FC, −0.87) but upregulated by KDM5 inhibition in both WT and mutant cells (mean log2FC,= 0.92 vs 1.75), including the cell cycle regulator CDKN1A and several signaling regulators (LCK, PRKCB, FCGR2B). An inverse relationship was observed in cluster 5, where genes were upregulated by KMT2D loss (mean log2FC, 0.31) but downregulated by KDM5 inhibition in WSU-DLCL2 and WSU#22−/+ cells (mean log2FC, −1.0 vs −1.1; Figure 3G), including the apoptotic regulator BCL2.
We next analyzed how levels of promoter H3K4 methylation in these clusters are linked to changes in gene expression after KDM5 inhibition or KMT2D loss. Clusters upregulated by KDM5 inhibition (3, 4, and 6) exhibited a low basal H3K4me3/H3K4me1 ratio, indicating that these promoters are repressed by KDM5, whereas the remaining clusters had a typical high H3K4me3/H3K4me1 ratio (Figure 3H). Although KDM5 inhibition reduced H3K4me1 and increased H3K4me3 within all clusters, its effect was most notable on clusters 3 and 4, where the H3K4me3/H3K4me1 ratio was altered to the extent that levels of H3K4me3 surpassed H3K4me1, which is likely responsible for the upregulation of these genes (Figure 3I-J). Cluster 5, in contrast, contained promoters with minimal apparent changes in H3K4me3, supporting our previous observation that KDM5 inhibition may indirectly downregulate gene expression. Across all clusters, however, KMT2D loss induced minimal changes to promoter H3K4me1/H3K4me3, whereas the clusters of genes downregulated by KMT2D loss (1 and 4) showed no bias toward alterations in enhancer or intragenic H3K4me1 (data not shown), in line with recent reports indicating that the consequences of KMT2D loss may not occur just through reduced H3K4 methylation.13,14
KDM5 inhibition regulates KMT2D and CREBBP target genes
To further test whether KDM5 inhibition regulates KMT2D target genes, we used gene set enrichment analysis (GSEA)27 to compare our RNA-seq series with a database of lymphoma and B-cell signatures, including signatures derived from patient cohorts, in vitro analyses, and mouse models of KMT2D.9,10,26,28,29 All 4 datasets generated in 2 recent lymphoma KMT2D studies9,10 were significantly enriched in both series, as were 28 signatures associated with CREBBP (Figure 4A; supplemental Table 8). Moreover, these KMT2D/CREBBP signatures were also enriched in our SU-DHL-6 and WSU-DLCL2/WSU#22−/+ H3K4me3 ChIP-seq data (supplemental Figure 5g; supplemental Tables 9 and 10), whereas the 2408 regions regulated by KDM5 inhibition in SU-DHL-6 significantly overlapped with binding of KMT2D and CREBBP (Figure 4B; supplemental Figure 4h). In contrast, we detected only modest enrichment for signatures associated with EZH2 mutations and EZH2i30,31 (supplemental Table 8).
![KDM5 inhibition regulates KMT2D target genes and BCR signaling regulators. (A) Heatmap indicating normalized enrichments scores (NESs) of KMT2D and CREBBP signatures in KDM5-inh1–treated cells, following GSEA of RNA-seq profiles using a manually curated database of B-cell signatures. (B) Overlap between KDM5 inhibition–regulated regions in SU-DHL-6 and CREBBP26 or KMT2D bound regions,9,10 with observed/expected and FDR values for the overlaps indicated. (C) Deeptools32 was used to calculate summary scores at the promoters (transcription start site [TSS] ± 500 bp) of genes in each cluster (Figure 3G) plus nonbivalent (H3K4me3+/H3K27me3−) and bivalent (H3K4me3/H3K27me3+) control promoters for ChIP-seq datasets of histone mark deposition (ENCODE/BLUEPRINT) and KMT2D,9,10 CREBBP,26 and EZH2/SUZH1233 binding. The overall direction of change in RNA expression, following KDM5i or KMT2D loss, is indicated for each cluster in the first 2 columns. (D-E) Heatmaps indicating NES following GSEA of the Reactome database in RNA-seq profiles from KDM5-inh1–treated cells (D) and RNA-seq plus promoter H3K4me1 and H3K4me3 profiles from KDM5-inh1–treated WSU-DLCL2/WSU#22−/+ cells (E). (F) Log2FC values of B-cell signaling regulators in SU-DHL-6, OCI-LY-18, and HT cells treated with KDM5-inh1. (G-H) Levels of pERK1/2 (T202/Y204) and ERK1/2 were quantified by western blot in cell lines exposed to 1 μM KMD5-inh1 for 5 days or 1 μM entospletinib for 48 hours (G), with the quantification of 3 individual replicates (H), alongside levels of ERK1 Y204 measured by phosphoproteomics and MEK1 activity quantified by kinase substrate enrichment analysis.34 (I) Activation of SYK was investigated by western blot analysis in SU-DHL-6, OCI-LY-18, and OCI-LY-7 cells treated with DMSO or KDM5-inh1 for 72 hours, followed by anti-IgM F(ab′)2 antibody stimulation for 10 minutes or 1 hour.](https://ash.silverchair-cdn.com/ash/content_public/journal/blood/138/5/10.1182_blood.2020008743/5/m_bloodbld2020008743f4.png?Expires=1767712620&Signature=tPJwk6841Jq0XA3IIUnqErFgeFtCkfdZC30Yqnt2BcVrI4rh2kg-rwq94b8jOIpOtK7pMKRlhpmtyYs9S~OvUhtDCdtEmpBI1Ym3yeFdAp46ncKnqDiYfGzg2n6btmX31SGmHJH2nDA1FlN6lOJoBqAiLA4rRkSOSsiUsE4TptKA9t6hrX~97ZHFPx78PTyFlmL9fpw96G7QJYcGvOerqvJoxgOU-6wjljZxwmXYayjGE3-~BEdaXVHA3wq2MxfcQkpY6bUdWJvGAk-XQei8wMujPSUeapZgMH~DIFQklW3ibqGHGncuYCHhLdDKlO8~88CjRrSEgOwdG4aToIKUqw__&Key-Pair-Id=APKAIE5G5CRDK6RD3PGA)
KDM5 inhibition regulates KMT2D target genes and BCR signaling regulators. (A) Heatmap indicating normalized enrichments scores (NESs) of KMT2D and CREBBP signatures in KDM5-inh1–treated cells, following GSEA of RNA-seq profiles using a manually curated database of B-cell signatures. (B) Overlap between KDM5 inhibition–regulated regions in SU-DHL-6 and CREBBP26 or KMT2D bound regions,9,10 with observed/expected and FDR values for the overlaps indicated. (C) Deeptools32 was used to calculate summary scores at the promoters (transcription start site [TSS] ± 500 bp) of genes in each cluster (Figure 3G) plus nonbivalent (H3K4me3+/H3K27me3−) and bivalent (H3K4me3/H3K27me3+) control promoters for ChIP-seq datasets of histone mark deposition (ENCODE/BLUEPRINT) and KMT2D,9,10 CREBBP,26 and EZH2/SUZH1233 binding. The overall direction of change in RNA expression, following KDM5i or KMT2D loss, is indicated for each cluster in the first 2 columns. (D-E) Heatmaps indicating NES following GSEA of the Reactome database in RNA-seq profiles from KDM5-inh1–treated cells (D) and RNA-seq plus promoter H3K4me1 and H3K4me3 profiles from KDM5-inh1–treated WSU-DLCL2/WSU#22−/+ cells (E). (F) Log2FC values of B-cell signaling regulators in SU-DHL-6, OCI-LY-18, and HT cells treated with KDM5-inh1. (G-H) Levels of pERK1/2 (T202/Y204) and ERK1/2 were quantified by western blot in cell lines exposed to 1 μM KMD5-inh1 for 5 days or 1 μM entospletinib for 48 hours (G), with the quantification of 3 individual replicates (H), alongside levels of ERK1 Y204 measured by phosphoproteomics and MEK1 activity quantified by kinase substrate enrichment analysis.34 (I) Activation of SYK was investigated by western blot analysis in SU-DHL-6, OCI-LY-18, and OCI-LY-7 cells treated with DMSO or KDM5-inh1 for 72 hours, followed by anti-IgM F(ab′)2 antibody stimulation for 10 minutes or 1 hour.
KDM5 inhibition regulates KMT2D target genes and BCR signaling regulators. (A) Heatmap indicating normalized enrichments scores (NESs) of KMT2D and CREBBP signatures in KDM5-inh1–treated cells, following GSEA of RNA-seq profiles using a manually curated database of B-cell signatures. (B) Overlap between KDM5 inhibition–regulated regions in SU-DHL-6 and CREBBP26 or KMT2D bound regions,9,10 with observed/expected and FDR values for the overlaps indicated. (C) Deeptools32 was used to calculate summary scores at the promoters (transcription start site [TSS] ± 500 bp) of genes in each cluster (Figure 3G) plus nonbivalent (H3K4me3+/H3K27me3−) and bivalent (H3K4me3/H3K27me3+) control promoters for ChIP-seq datasets of histone mark deposition (ENCODE/BLUEPRINT) and KMT2D,9,10 CREBBP,26 and EZH2/SUZH1233 binding. The overall direction of change in RNA expression, following KDM5i or KMT2D loss, is indicated for each cluster in the first 2 columns. (D-E) Heatmaps indicating NES following GSEA of the Reactome database in RNA-seq profiles from KDM5-inh1–treated cells (D) and RNA-seq plus promoter H3K4me1 and H3K4me3 profiles from KDM5-inh1–treated WSU-DLCL2/WSU#22−/+ cells (E). (F) Log2FC values of B-cell signaling regulators in SU-DHL-6, OCI-LY-18, and HT cells treated with KDM5-inh1. (G-H) Levels of pERK1/2 (T202/Y204) and ERK1/2 were quantified by western blot in cell lines exposed to 1 μM KMD5-inh1 for 5 days or 1 μM entospletinib for 48 hours (G), with the quantification of 3 individual replicates (H), alongside levels of ERK1 Y204 measured by phosphoproteomics and MEK1 activity quantified by kinase substrate enrichment analysis.34 (I) Activation of SYK was investigated by western blot analysis in SU-DHL-6, OCI-LY-18, and OCI-LY-7 cells treated with DMSO or KDM5-inh1 for 72 hours, followed by anti-IgM F(ab′)2 antibody stimulation for 10 minutes or 1 hour.
We next investigated the enrichment of histone marks and epigenetic regulators using data from GC lymphoma cell lines and GC B cells22 and our previously defined gene clusters in WSU-DLC2/WSU#22−/+ cells (Figure 3G). In agreement with our observations linking CREBBP to KDM5-regulated genes (Figure 4A-B), cluster 4 promoters displayed levels of H3K27ac and CREBBP binding that were higher than any other cluster, including cluster 3, which is regulated by KDM5 inhibition but not KMT2D loss (Figure 4C). Levels of KMT2D binding conversely were not predictive of KDM5 inhibition response (Figure 4C).
KMT2D has diverse functions in chromatin regulation, many of which could be compensated for by other enzymes (eg, KMT2C); however, we hypothesize that its loss in lymphoma results in the repression of H3K4me1-high promoters, which are normally lowly expressed but poised for activation on stimulation by altering the recruitment of enzymes including EP300/CREBBP and KDM6A.13,14 By demethylating H3K4me3/me2 to H3K4me1, the KDM5 family also prevents the activation of these genes, which can be reactivated by KDM5 inhibition, converting residual H3K4me1 into H3K4me3.
KDM5 inhibition upregulates regulators of B-cell signaling
To determine how KDM5 inhibition reduces proliferation and induces apoptosis, we analyzed our ChIP- and RNA-seq data series to identify notably enriched pathways while also focusing on key individual genes. In both our ChIP- and RNA-seq data, we observed strong enrichments for pathways related to BCR and G protein–coupled receptor signaling (supplemental Tables 9 and 10; Figure 4D-E), including genes encoding the tyrosine phosphatase SHP-1 (PTPN6) and various coreceptors (eg, FCGR2B, FCRL3/5, CD72, LAIR1) capable of recruiting and activating SHP-1 (Figure 4F; supplemental Figure 6a-c).
We selected several signaling genes for further validation including PTPN6 and demonstrated that KDM5-inh1 increased promoter H3K4me3 levels in both cell lines and primary FL cell suspensions (supplemental Figure 6d-e). These genes were also upregulated by Compound 48, KDM5-C70, and KMD5A knockout in SU-DHL-6 cells, albeit to a lesser extent than after KDM5 inhibition (supplemental Figure 7a-b). Given that PTPN6 is regulated by KMT2D9 and CREBBP26 (supplemental Figure 6a), and subject to low-frequency mutations and silencing in lymphoma,35 we speculated that increased expression/activity of SHP-1 may result in reduced B-cell signaling, although we also noted that KDM5 inhibition induced signaling regulators downstream of SHP-1 (Figure 4F).
KDM5 inhibition reduces B-cell signaling
To investigate how KDM5 inhibition regulates B-cell signaling, we performed phosphoproteomics analysis in SU-DHL-6 and OCI-LY-18 cells exposed to KDM5-inh1. Focusing on well-documented phosphorylation sites, we detected decreased phosphorylation sites on key members of the MAPK–extracellular signal-regulated kinase (ERK) signaling pathway, including BRAF and ERK1/2 (supplemental Figure 8a). Reduced MAPK/ERK signaling was confirmed by kinase substrate enrichment analysis,34 which identified MEK1 to have significantly reduced activity in both OCI-LY18 and SU-DHL-6, with kinases downstream of MEK/ERK also inhibited (eg, CDK2, MNK1/2; supplemental Figure 8b), and validated in SU-DHL-6 cells by western blotting of ERK1/2 T202/Y204 phosphorylation (Figure 4G-H).
MAPK-ERK signaling was also reduced by the SYK inhibitor entospletinib (Figure 4G), indicating that reduced MAPK-ERK signaling in KDM5-inh1–treated cells may be caused by inhibition of tonic BCR signaling,36 which can be regulated by SHP-1.37-39 Although genetic ablation of proximal BCR-associated kinases has been shown to reduce proliferation in GCB-DLBCL cells (including SU-DHL-6 and OCI-LY-18),37-39 we were unable to directly assess the effect of KDM5-inh1 on SYK and BTK because phosphorylation levels were undetectable in these experiments.
To more specifically focus on BCR signaling, we pretreated the immunoglobulin M (IgM)+ SU-DHL-6, OCI-LY-18, and OCI-LY-7 cells (supplemental Figure 8c) with dimethyl sulfoxide (DMSO) or KDM5-inh1 for 72 hours and then stimulated with anti-IgM F(ab′)2 to cross-link the BCR. KDM5-inh1 pretreatment reduced SYK phosphorylation at later time points (1-4 hours) after surface-IgM engagement (Figure 4I; supplemental Figure 8d-f), whereas the initial induction of SYK phosphorylation at 10 minutes, surface expression of sIgM and intracellular calcium release were all unaffected (supplemental Figure 8d-h). By contrast, KDM5 inhibition had no impact on SYK phosphorylation in the KDM5 inhibition–insensitive OCI-LY-7 cells (Figure 4I; supplemental Figure 8d-f).
The more rapid dephosphorylation of SYK is consistent with an increase in the expression of regulators such as SHP-136 and may contribute to the reduction in MAPK-ERK signaling. However, more direct regulators of MAPK-ERK signaling (eg, DUSP6,40 PTPN741 ) were also induced, making it likely that KDM5 inhibition suppresses B-cell signaling through multiple effector proteins.
KDM5 inhibition modulates the expression of BCL2 family members
Among the downregulated genes, we observed reduced expression of the antiapoptotic BCL2. All 3 KDM5i tested consistently reduced BCL2 protein expression in t(14;18)-positive cell lines (Figure 5A; supplemental Figure 9a), although sensitivity to KDM5 inhibition and the BCL2i venetoclax varied (r = .38, P = .31), indicating that response to KDM5 inhibition is not solely dependent on BCL2 (supplemental Figure 9b-c). The mechanism of BCL2 downregulation appeared to be an indirect effect of KDM5 inhibition, as we observed no clear changes in H3K4me3/H3K4me1 or H3K27ac across the BCL2 promoter (supplemental Figure 6d) or at enhancers contained within BCL2 or the immunoglobulin heavy chain locus (data not shown), consistent with earlier observations that downregulated genes do not correlate with H3K4me3 deposition (supplemental Figure 5c-d).

KDM5 inhibition alters the expression of BCR signaling and apoptotic regulatory genes. (A) Expression of BCL2 protein was examined by western blot in 10 DLBCL cell lines exposed to DMSO or 1 μM KDM5-inh1 for 48 hours. (B) SU-DHL-6 and HT cells were treated with DMSO or 1 and 5 μM KDM5-inh1 for 5 days, with the cells reseeded in fresh drug/media after 48 hours. The expression of BCL2 family members was investigated by western blot, with HSC70 used as a loading control. Western blots are representative of 3 independent experiments, with the quantification relative to HSC70 displayed in panel C. Statistical significance was determined using an analysis of variance (ANOVA) with a Dunnett’s posttest vs untreated control: *P < .05; **P < .01; ****P < .0001. Viable cells were quantified in 10 lymphoma cell lines treated with increasing concentrations of KDM5-inh1 for 5 days, alongside increasing concentrations of S63845 (MCL1i) for 3 days. (D) Overall Loewe and highest single agent (HSA) synergy scores calculated for each cell line using Synergy Finder,42 with a score >10 indicating significant synergy. (E) Plots showing the degree of synergy between different concentrations of KDM5-inh1 and S63845 in OCI-LY-1 and WSU-DLCL2 cells, with the area of maximum synergy indicated by a blue box. (F-G) Global levels of H3K4me3 in tumors from mice treated with vehicle or 50 mg/kg KDM5-inh1 for 1 week (n = 3) were quantified by western blot and normalized to H3, whereas BCL2 and pERK levels were quantified and normalized to GAPDH and total ERK, respectively. (H) Activity of 50 mg/kg KDM5-inh1 on the growth of SU-DHL-6 xenografts in comparison with vehicle-treated mice. Data are the mean ± standard error of the mean of 10 individual mice, except in the vehicle group where one mouse was removed because of insufficient tumor growth (<300 mm3). Statistical significance was calculated using a 2-way ANOVA with a Dunnett’s posttest: ***P < .001; ****P < .0001.
KDM5 inhibition alters the expression of BCR signaling and apoptotic regulatory genes. (A) Expression of BCL2 protein was examined by western blot in 10 DLBCL cell lines exposed to DMSO or 1 μM KDM5-inh1 for 48 hours. (B) SU-DHL-6 and HT cells were treated with DMSO or 1 and 5 μM KDM5-inh1 for 5 days, with the cells reseeded in fresh drug/media after 48 hours. The expression of BCL2 family members was investigated by western blot, with HSC70 used as a loading control. Western blots are representative of 3 independent experiments, with the quantification relative to HSC70 displayed in panel C. Statistical significance was determined using an analysis of variance (ANOVA) with a Dunnett’s posttest vs untreated control: *P < .05; **P < .01; ****P < .0001. Viable cells were quantified in 10 lymphoma cell lines treated with increasing concentrations of KDM5-inh1 for 5 days, alongside increasing concentrations of S63845 (MCL1i) for 3 days. (D) Overall Loewe and highest single agent (HSA) synergy scores calculated for each cell line using Synergy Finder,42 with a score >10 indicating significant synergy. (E) Plots showing the degree of synergy between different concentrations of KDM5-inh1 and S63845 in OCI-LY-1 and WSU-DLCL2 cells, with the area of maximum synergy indicated by a blue box. (F-G) Global levels of H3K4me3 in tumors from mice treated with vehicle or 50 mg/kg KDM5-inh1 for 1 week (n = 3) were quantified by western blot and normalized to H3, whereas BCL2 and pERK levels were quantified and normalized to GAPDH and total ERK, respectively. (H) Activity of 50 mg/kg KDM5-inh1 on the growth of SU-DHL-6 xenografts in comparison with vehicle-treated mice. Data are the mean ± standard error of the mean of 10 individual mice, except in the vehicle group where one mouse was removed because of insufficient tumor growth (<300 mm3). Statistical significance was calculated using a 2-way ANOVA with a Dunnett’s posttest: ***P < .001; ****P < .0001.
We next analyzed the expression of BCL2 alongside other family members in SU-DHL-6 and HT cells treated with KDM5-inh1 for 2/5 days. Minimal changes were observed in the insensitive HT cells; however, decreased BCL2 and BCL-XL expression, alongside increasing expression of the proapoptotic NOXA, BIML, and BIMEL, were observed at day 5 in SU-DHL-6 (Figure 5B-C). These changes preceded the onset of apoptosis at day 2 (supplemental Figure 9d-e), whereas KDM5 inhibition also reduced BCL2 and BCL-XL mRNA expression in primary FL cell suspensions (supplemental Figure 6e). Overall, these data indicate that KDM5 inhibition shifts the balance of BCL2 family members toward a proapoptotic response in sensitive cells.
KDM5 inh1 synergizes with MCL1 inhibitors
Given the ability of KDM5 inhibition to regulate B-cell signaling and BCL2 family members, we tested whether KDM5 inhibition could synergize with the BH3 mimetics venetoclax43 and S63845 (MCL1 apoptosis regulator inhibitor; MCL1i),44 which are under clinical investigation for GC lymphomas. Although initial experiments revealed minimal synergy with venetoclax (data not shown), we found S63845 to widely synergize with KDM5-inh1, particularly in t(14;18)-positive cell lines (Figure 4D+E; supplemental Figure 10a+b). Overall, the synergy with S63845 is likely explained by KDM5 inhibition downregulating the expression of the 2 other major negative regulators of apoptosis, BCL2 and BCL-XL, triggering increased MCL1 dependence, alongside reduced prosurvival BCR/MAPK-ERK signaling.
KDM5-inh1 has in vivo activity against KMT2D mutant xenografts
To test the in vivo efficacy of KDM5-inh1, KMT2D mutant SU-DHL-6 cells were xenografted subcutaneously into NOD/SCID mice. Mice were orally administered vehicle, 50 mg/kg KDM5-inh1 daily (7 days on/7 days off) or 10 mg/kg ibrutinib (positive control) for 21 days. KDM5-inh1 was well tolerated with weight loss < 20% and no other signs of toxicity observed (supplemental Figure 10c-e). Levels of H3K4me3 were variable at the study end point, although increased H3K4me3 alongside reduced BCL2 expression and pERK were observed in the tumors of mice treated with KDM5-inh1 for 7 days (Figure 5F+G; supplemental Figure 10f). After 7 days of treatment, tumor growth inhibition of 65% was observed for the KDM5-inh1 group, and although the tumors partially recovered during the dosing holiday, tumor growth inhibition values of 54% to 66% were maintained until day 17 when the vehicle group was killed (Figure 5H).
Discussion
The KMT2 methyltransferases are one of the most highly disrupted gene families across cancer,11 most notably within the GC lymphomas where KMT2D is mutated in 80% of FL1-4 and 30% of GCB-DLBCL cases,5-7 alongside mutations in the epigenetic regulatory genes CREBBP26,28,45-47 and EZH2.48-50 The therapeutic potential of targeting these mutations has been established by the approval of EZH2i for FL,31,51,52 whereas HDAC3 has been proposed as a therapeutic target for CREBBP mutant lymphomas.28,29 We therefore examined whether KDM5 inhibition could ameliorate the loss of KMT2D by stabilizing H3K4 methylation and restoring the expression of KMT2D-regulated genes.
KDM5 inhibition increased global levels of the promoter-associated H3K4me3 while inducing significant cytostatic/cytotoxic responses in KMT2D mutant cell lines in vitro and tumor growth inhibition in vivo. KDM5 inhibition was confirmed to be dependent on KMT2D by generating and correcting KMT2D mutations in cell lines, with single-allele alterations able to modulate KDM5 inhibition sensitivity. Our epigenetic and transcriptomic analyses revealed that KDM5 inhibition activates both KMT2D-dependent and -independent genes and in particular upregulates B-cell signaling regulators marked by high levels of promoter H3K4me1.
KDM5 inhibition also induced striking reductions in BCL2 expression in t(14;18)-positive lymphoma cells, alongside altering the expression of other BCL2 family members, which together with the loss of BCR/MAPK-ERK signaling appears likely to be responsible for the cytostatic/cytotoxic activity of KDM5 inhibition. Further in vivo studies are required to establish whether KDM5 inhibition has sufficient single-agent activity, as the dose we assessed in this study (50 mg/kg) induced relatively modest reductions in tumor growth. However, the degree of synergy observed in vitro with MCL1i, and reductions in BCR/MAPK-ERK signaling indicate that KDM5i may synergize effectively with BH3 mimetics or potentially targeted signaling agents as an alternative strategy. Our data also indicates that inhibition of multiple KDM5 members may be needed to achieve a therapeutic response, consistent with reports of significant redundancy in the KDM553,54 and other KDM families,55,56 which should be taken into consideration in the further development of KDM5i.
Despite the evidence presented here that KDM5i can reactivate KMT2D-dependent genes, by increasing H3K4me3 at the expense of H3K4me1, KDM5 inhibition does not directly reverse the epigenetic consequences of losing the mono-methyltransferase activity of KMT2D. A number of recent studies have described the major consequence of KMT2D loss to occur through reduced recruitment of the H3K27 acetyltransferases EP300/CREBBP and demethylase KDM6A,13,14 and it is noteworthy that inhibition of LSD1, the direct antagonist of the methyltransferase activity of KMT2D, is ineffective in lymphoma.57
Given previous reports of high levels of promoter H3K4me1 maintaining particular signaling regulators in a poised configuration58,59 and KMT2D mutations altering B-cell signaling by preventing the upregulation of negative regulators after CD40 stimulation,10 we propose that KMT2D and KDM5 work cooperatively at select promoters to maintain them in a poised configuration until a suitable signal is received. This is likely to occur through a combination of KMT2D directly catalyzing H3K4me1 and recruiting other epigenetic enzymes (eg, the acetlytransferases p300/CREBBP), alongside the KDM5 family preventing overactivation by demethylating H3K4me3/H3K4me2 to H3K4me1. This is supported by our observation that KMT2D-dependent genes upregulated by KDM5 inhibition have strikingly high levels of H3K27ac and CREBBP binding in addition to higher levels of H3K4me1 compared with H3K4me3. In lymphoma, this delicate balance could be disrupted through reduced H3K4me1 catalysis and/or EP300/CREBBP recruitment in KMT2D mutant cells or by mutations in CREBBP/EP300 themselves. Importantly, by converting residual H3K4me1 to H3K4me3, KDM5 inhibition can reactivate these genes and ameliorate the impact of KMT2D mutations.
In summary, this report establishes the potential of KDM5 inhibition as a targeted therapy for GC lymphomas that can reactivate the expression of KMT2D-dependent genes. In particular, the increased expression of negative regulators of B-cell signaling results in a curtailment of prosurvival signals and decreases the expression of BCL2 and other BCL2 family proteins. Notably, the response to KDM5 inhibition is dependent on the presence of KMT2D mutations and raises the question as to whether KDM5i may be effective in other malignancies harboring mutations in KMT2D or other KMT2 methyltransferases.
All our RNA-seq and ChIP-seq data have been uploaded at GSE153671.
The online version of this article contains a data supplement.
There is a Blood Commentary on this article in this issue.
The publication costs of this article were defrayed in part by page charge payment. Therefore, and solely to indicate this fact, this article is hereby marked “advertisement” in accordance with 18 USC section 1734.
Acknowledgments
The authors thank EpiTherapeutics and Gilead for providing us with KDM5-inh1 and general advice throughout the project, in particular, Lars-Ole Gerlach, Kristian Helin, Daniela Kleine-Kohlbrecher, and Peter Staller (EpiTherapeutics).
This work was supported by grants from Cancer Research UK under the Accelerator Award Programme (15968 and C355/A26819, J.F.; and 23669, G.P.) and the Southampton Experimental Cancer Medicine and Cancer Research Centres. A.M. is supported by National Institutes of Health, National Cancer Institute grant R35 CA220499, The Follicular Lymphoma Consortium, LLS TRP 6572-19, and LLS SCOR 7021-20.
Authorship
Contribution: J.F. and J.H. conceived the study; J.H., G.P., A.M., and J.F. designed the study; J.H., A.D., G.P., and J.F. wrote the manuscript; J.G., P.J., J.O., S.I., and A.C. identified, contributed, and prepared patient samples for the project; J.H., F.B.-C., and J.W. performed bioinformatic analysis; J.H., L.K., A.D., A.Y., T.R., A.F.A.S., S.A., K.C., M.P., J.D., D.B., K.K., and E.K. performed experiments; J.H., L.K., A.D., A.Y., and J.F. analyzed the data; R.N., U.O., and A.M. contributed reagents and interpretation of data; and all authors read, critically reviewed, and approved the manuscript.
Conflict-of-interest disclosure: J.F. receives research funding from Epizyme, has consulted for Epizyme and is part of a speaker bureau for Gilead and Roche. A.M. receives research funding from Janssen and Sanofi, has consulted for Epizyme, Constellation, and Jubilant, and is an advisor to KDAC. K.K. is now employed by Roche Glycart AG. The remaining authors declare no competing financial interest.
Correspondence: James Heward, Haemato Oncology, Barts Cancer Institute, Charterhouse Square, London EC1M 6BQ, United Kingdom; e-mail: j.a.heward@qmul.ac.uk; and Jude Fitzgibbon, Haemato Oncology, Barts Cancer Institute, Charterhouse Square, London EC1M 6BQ, United Kingdom; e-mail: j.fitzgibbon@qmul.ac.uk.
