

Key Points
Overexpressing AID in Eμ-TCL1 mice enhances leukemia cell proliferation and causes more aggressive disease.
TCL1/AID mice develop AID-induced mutations in cancer driver genes at identical amino acid substitutions as in human neoplasms.

Abstract
Most cancers become more dangerous by the outgrowth of malignant subclones with additional DNA mutations that favor proliferation or survival. Using chronic lymphocytic leukemia (CLL), a disease that exemplifies this process and is a model for neoplasms in general, we created transgenic mice overexpressing the enzyme activation-induced deaminase (AID), which has a normal function of inducing DNA mutations in B lymphocytes. AID not only allows normal B lymphocytes to develop more effective immunoglobulin-mediated immunity, but is also able to mutate nonimmunoglobulin genes, predisposing to cancer. In CLL, AID expression correlates with poor prognosis, suggesting a role for this enzyme in disease progression. Nevertheless, direct experimental evidence identifying the specific genes that are mutated by AID and indicating that those genes are associated with disease progression is not available. To address this point, we overexpressed Aicda in a murine model of CLL (Eμ-TCL1). Analyses of TCL1/AID mice demonstrate a role for AID in disease kinetics, CLL cell proliferation, and the development of cancer-related target mutations with canonical AID signatures in nonimmunoglobulin genes. Notably, our mouse models can accumulate mutations in the same genes that are mutated in human cancers. Moreover, some of these mutations occur at homologous positions, leading to identical or chemically similar amino acid substitutions as in human CLL and lymphoma. Together, these findings support a direct link between aberrant AID activity and CLL driver mutations that are then selected for their oncogenic effects, whereby AID promotes aggressiveness in CLL and other B-cell neoplasms.
Introduction
Chronic lymphocytic leukemia (CLL) results from the accumulation of mature, long-lived CD5+ B lymphocytes in peripheral blood (PB), bone marrow, and secondary lymphoid organs1,2 due to an imbalance between cell proliferation and death.3 Furthermore, disease progression correlates with the relative proportions of proliferative and quiescent subpopulations within leukemic clones.4,5 Activation of CLL cells mainly occurs in secondary lymphoid organs,6,7 where they are stimulated via B-cell receptors,8 CD40, and/or Toll-like receptors.9,10 In B lymphocytes, such receptor/ligand interactions lead to expression of activation-induced cytidine deaminase (AID), an enzyme required for somatic hypermutation and class switch recombination.11 AID mutates genomic DNA by deaminating cytosine to uracil, which can lead to point mutations and DNA double-stranded breaks.12,13 Although AID preferentially acts on immunoglobulin genes, it can also target other genes giving rise to mutations and/or chromosome translocations that can be oncogenic.14
We have shown that leukemic clones in patients with worse clinical outcomes overexpress AID, and that AID expression is modulated by microenvironmental signals.15-17 Despite these and other studies18 suggesting a link between AID activity and CLL progression, direct experimental evidence indicating that AID is responsible for off-target mutations driving disease progression is not available.
Here, we tested the hypothesis that mice overexpressing AID in leukemic cells would recapitulate the leukemogenic process observed in progressive and immunoglobulin heavy chain (IGHV)-unmutated CLL (U-CLL) clones expressing AID. To address this, we crossed Eμ-TCL1 mice (a validated murine model of CLL19,20 ) with 2 different strains overexpressing AID, either only in B cells12 or ubiquitously.21
Our results show that these double-transgenic AID (DT-AID) mice develop more aggressive leukemias with shorter survivals than Eμ-TCL-1, linking constitutive AID expression in the leukemic clone with enhanced cell proliferation. Whole-exome sequencing (WES) of leukemic cells from DT-AID and their proliferating fractions reveal novel AID-induced mutations in oncogenes and tumor-suppressor genes as well as in genes involved in chromatin structure and the Wnt-signaling pathway. Furthermore, we found that some genes that are mutated in human CLL and diffuse large B-cell lymphoma (DLBCL) are also mutated in DT-AID mice, and that some of these mutations occur at the exact same positions, resulting in equivalent amino acid substitutions as in the human disease. Hence, our 2 DT-AID strains provide complementary models of aggressive CLL-like disease and strongly indicate that AID causes a distinct set of off-target mutations in genes that are likely relevant to CLL and human B-cell neoplasms in general because of selection for their oncogenic effects.
Materials and methods
Clinical samples
PB mononuclear cells were collected in a prospective manner from patients with CLL defined by International Workshop on Chronic Lymphocytic Leukaemia (IWCLL) criteria. Progressive CLL cases were identified as described in Prieto et al.22 Supplemental Table 1 (available on the Blood Web site) lists the clinical and molecular characteristic of these patients.
Mice models
Eu-TCL1–transgenic mice19 were crossed with either AID-transgenic mice under the control of the actin (act-AIDTg/wt mice) promoter21 or AID-transgenic mice under control of the immunoglobulin κ (Igκ; Igκ-AIDTg/Tg mice) promoter12 in C57BL/6 × (C57BL/6 × C3H) or pure C57BL/6 final genetic backgrounds. Genotyping was performed by polymerasce chain reaction from tail tissue using specific primers for TCL1 and AID genes.19,21
Quantitative real-time polymerase chain reaction and immunohistochemistry
Total RNA was isolated from purified leukemic cells and retrotranscribed as described.23 Gene analysis and quantification of AID expression were performed as described,21,23 and primer sets were depicted in supplemental Materials and methods or in Palacios et al.23 Immunohistochemistry was performed as described24 and detailed in supplemental Materials and methods.
Whole-exome sequencing
Genomic DNA was purified from isolated leukemic Ki67+ and Ki67− cells (tumor) and tail tips (germline) using the Quick-DNA Kit (Zymo Research). A similar procedure was used for human PB mononuclear cells where the leukemic clone was isolated and the T-cell fraction was used as a germline control. Reads were aligned as described25,26 and variant calling was performed using VarScan with a minimal variant frequency of 0.08, and minimum coverage of 10× (V2.4.3).27 Mutation signature analysis was performed using SomaticSignatures28 and methods are detailed in supplemental Materials and methods.
Statistical analysis
Data are presented as means plus or minus standard error of the mean. The 1-way analysis of variance (ANOVA) multiple comparisons test, the 2-tailed, unpaired Student t test, and the Fisher exact test were used for statistical analysis (*P < .05, **P < .001, ***P < .001, ****P < .0001). Kaplan-Meier survival curve plots, the Gehan-Breslow-Wilcoxon test, and the log-rank (Mantel-Cox) test were performed. All tests were performed with GraphPad Prism v.6 software. A value of P < .05 was considered significant.
Results
Eμ-TCL1 mice overexpressing AID develop a more aggressive disease
The strategy to generate DT mouse models is depicted in supplemental Figure 1A. DT-AID mice were healthy, without evidence of inborn alterations. AID messenger RNA (mRNA) levels were significantly higher in the DT-AID models compared with TCL1 (supplemental Figure 1B). Cytoplasmic AID protein was increased within B220+ cells in the DT-AID models compared with the TCL1 counterpart (Figure 1A). All 3 strains showed loss disruption of lymphoid tissue architecture and weaker B220 signals compared with normal B-cell follicles. Disease kinetics were monitored every 2 months by white blood cell counts, proportion of IgM+CD5+ cells, and associated signs of leukemia. Mice of 6 and 10 months of age were selected as these time points were illustrative of preleukemic and leukemic stages, respectively.29 In both DT-AID models, circulating leukemia cells appeared earlier and at 10 months were significantly higher than in TCL1 (Figure 1B-C; supplemental Figure 1C). Tumor burden was higher, with significantly larger spleens and more IgM+CD5+ cells in the DT-AID than in TCL1 (Figure 1C-D), whereas both DT-AID models had significantly shorter survival than TCL1 (Figure 1E; supplemental Figure 1E). As expected based on the constitutive expression of AID, many more IGHV mutations were found in the B-cell expansions identified in the DT-AID mice than in the TCL1 animals (supplemental Figure 2).
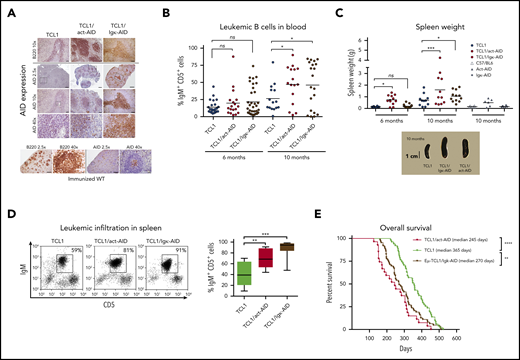
Overexpression of the AID transgene emulates a progressive CLL-like disease. (A) Immunohistochemical analyses of spleen sections from the 3 strains euthanatized after developing leukemia. As depicted, AID levels in both AID-DT strains appeared similar to, or even higher than in, GC B cells from immunized wild-type (wt) C57BL/6 mice examined in parallel. Cre-immunized wt animals were used as controls. Micrographs for each genotype depicting AID and B220 for 3 different magnifications are depicted. Insets/squares indicate the areas where augmentation was used. Scale bars: 500, 100, and 20 µm for original magnifications of ×2.5, ×10, and ×40, respectively. Mice between 8 and 10 months were used for these experiments. Within the sensitivity range achieved by immunocytochemistry, the relative AID protein levels of the DT-AID models correlated with mRNA measurements (supplemental Figure 1B). Overall, these data indicate that both DT-AID models develop leukemia with similar histopathology and, despite relatively higher AID expression, do not exhibit dysfunctional development and are suitable to study the influence of AID in CLL evolution. After antigen detection, each section was counterstained using Mayer’s hematoxylin. (B) Submandibular vein bleeding was performed for TCL1 and DT-AID mice at 6 and 10 months. Percentages of malignant IgM+CD5+ cells are shown for ≥15 animals of the 3 genotypes. At month 10, the TCL1/Igκ-AID mean was 46% ± 8%; the TCL1/act-AID mean was 47% ± 7%; and the TCL1 mean was 26% ± 5%. (C) Comparison of spleen weights of control wt mice and animals from the 3 genotypes (n ≥ 8). Representative images of spleens are shown under the chart. (D) To determine tumor burden in leukemic animals, 10 mice from each genotype were euthanized at 6 and 10 months of age. Spleens from the 3 strains at 10 months of age were disaggregated to evaluate leukemic infiltration (IgM+CD5+ cell percentage). The TCL1/Igκ-AID mean percentage was 87% ± 5%; the TCL1/act-AID mean percentage was 64% ± 7%; and the TCL1 mean percentage was 42% ± 7%. (E) Kaplan-Meier survival curves are shown for TCL1 (n = 51), TCL1/Igκ-AID (n = 63), and TCL1/act-AID (n = 27). Survival data were obtained by observing cohorts of 10 to 51 mice for each genotype. Differences in median overall survival for both DT-AID strains (medians: TCL1/Igκ-AID = 270 days and TCL1/act-AID mice = 245 days) compared with TCL1 mice (median, 356 days) were significant (log-rank test). Overall survival of the monotransgenic AID strains was comparable to TCL1 mice (supplemental Figure 1E). Only those mice (stipulated by end-point leukemia or dying with leukemia signs) were euthanized and included in the analysis of overall survival. *P < .05, **P < .001, ***P < .001, ****P < .0001. ns, not significant.
Overexpression of the AID transgene emulates a progressive CLL-like disease. (A) Immunohistochemical analyses of spleen sections from the 3 strains euthanatized after developing leukemia. As depicted, AID levels in both AID-DT strains appeared similar to, or even higher than in, GC B cells from immunized wild-type (wt) C57BL/6 mice examined in parallel. Cre-immunized wt animals were used as controls. Micrographs for each genotype depicting AID and B220 for 3 different magnifications are depicted. Insets/squares indicate the areas where augmentation was used. Scale bars: 500, 100, and 20 µm for original magnifications of ×2.5, ×10, and ×40, respectively. Mice between 8 and 10 months were used for these experiments. Within the sensitivity range achieved by immunocytochemistry, the relative AID protein levels of the DT-AID models correlated with mRNA measurements (supplemental Figure 1B). Overall, these data indicate that both DT-AID models develop leukemia with similar histopathology and, despite relatively higher AID expression, do not exhibit dysfunctional development and are suitable to study the influence of AID in CLL evolution. After antigen detection, each section was counterstained using Mayer’s hematoxylin. (B) Submandibular vein bleeding was performed for TCL1 and DT-AID mice at 6 and 10 months. Percentages of malignant IgM+CD5+ cells are shown for ≥15 animals of the 3 genotypes. At month 10, the TCL1/Igκ-AID mean was 46% ± 8%; the TCL1/act-AID mean was 47% ± 7%; and the TCL1 mean was 26% ± 5%. (C) Comparison of spleen weights of control wt mice and animals from the 3 genotypes (n ≥ 8). Representative images of spleens are shown under the chart. (D) To determine tumor burden in leukemic animals, 10 mice from each genotype were euthanized at 6 and 10 months of age. Spleens from the 3 strains at 10 months of age were disaggregated to evaluate leukemic infiltration (IgM+CD5+ cell percentage). The TCL1/Igκ-AID mean percentage was 87% ± 5%; the TCL1/act-AID mean percentage was 64% ± 7%; and the TCL1 mean percentage was 42% ± 7%. (E) Kaplan-Meier survival curves are shown for TCL1 (n = 51), TCL1/Igκ-AID (n = 63), and TCL1/act-AID (n = 27). Survival data were obtained by observing cohorts of 10 to 51 mice for each genotype. Differences in median overall survival for both DT-AID strains (medians: TCL1/Igκ-AID = 270 days and TCL1/act-AID mice = 245 days) compared with TCL1 mice (median, 356 days) were significant (log-rank test). Overall survival of the monotransgenic AID strains was comparable to TCL1 mice (supplemental Figure 1E). Only those mice (stipulated by end-point leukemia or dying with leukemia signs) were euthanized and included in the analysis of overall survival. *P < .05, **P < .001, ***P < .001, ****P < .0001. ns, not significant.
Distinct mutation signatures in DT-AID and TCL1 mice
Genome-wide DNA mutations induced by AID overexpression were identified (supplemental Excel File 1, sheets 1-6). Since the clinical findings, variant rates and mutation patterns were similar in both DT-AID mouse lines (Figure 2; supplemental Figure 3A; supplemental Excel File 1, sheet 1), they were considered together for all subsequent analyses. WES analysis revealed a mutation rate in protein-coding regions of 0.83 ± 0.88 per Mb in TCL1, similar to the mutation rate reported for human CLL 0.6 ± 0.28.30 As expected, AID overexpression in DT-AID mice led to a higher mutation rate (1.59 ± 0.83 per Mb).
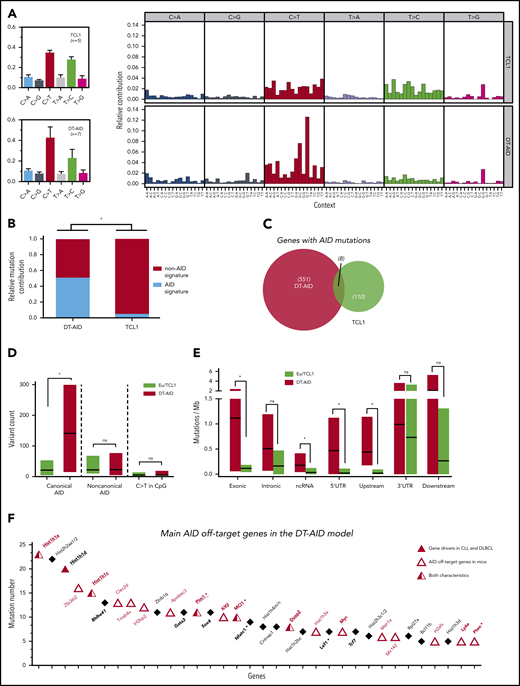
Mutational activity and identification of AID nonimmunoglobulin, off-target genes in DT-AID mice. Purified leukemic cells from spleens of 5 TCL1 and 7 DT-AID were studied by the WES technique. (A) Total somatic mutation pattern (left) and analysis of somatic mutation pattern by 96-trinucleotide substitutions model (right). One signature was dominated by C>T transitions at the RCY motif (c-AID). For the remaining 2 signatures, we were not able to establish a significant correlation with any described mutational process reported in COSMIC (https://cancer.sanger.ac.uk/cosmic/signatures). (B) Relative contribution of AID mutations (black) and mutations without AID mutations (white) for TCL1 and DT-AID mice. Using a 12% cutoff, DT-AID mice showed a higher contribution of AID mutations than TCL1 (5 of 7 vs 0 of 5; P = .02, Fisher exact test). (C) Venn diagram depicting the number of genes mutated by AID in TCL1 and DT-AID mice. (D) Quantification of mutations according to occurrence at canonical and noncanonical AID hotspots, and C>T transitions in CpG, for TCL1 vs DT-AID mice. Significant differences were found comparing c-AID mutations between both strains (P = .02 2-tailed, unpaired Student t test). (E) Genomic context of AID-related variants. Significant differences in exonic (P = .03), ncRNA (P = .04), and 5′ UTR (P = .03) (2-tailed, unpaired Student t test). Upstream and downstream indicate variants overlapping the 1-kb region up/downstream of transcription start or end site. Intergenic regions were excluded from analyses. (A-E) *P < .05. (F) Recurrently mutated genes, ≥5 c-AID mutations distributed between at least 2 mice in DT-AID mice are represented, summing the 7 genomes included in our study for this genotype. Total number of mutations in each gene, for the entire group, is depicted on the y-axis. Genes are displayed on the x-axis according to mutation numbers. Genes previously described as AID-off targets are indicated by red characters and an open triangle. Driver genes in B-cell neoplasms previously described are underlined and identified by a red triangle. Genes in bold plus italic letters represent genes associated with tumor development. Genes associated with CLL progression are highlighted by asterisks.
Mutational activity and identification of AID nonimmunoglobulin, off-target genes in DT-AID mice. Purified leukemic cells from spleens of 5 TCL1 and 7 DT-AID were studied by the WES technique. (A) Total somatic mutation pattern (left) and analysis of somatic mutation pattern by 96-trinucleotide substitutions model (right). One signature was dominated by C>T transitions at the RCY motif (c-AID). For the remaining 2 signatures, we were not able to establish a significant correlation with any described mutational process reported in COSMIC (https://cancer.sanger.ac.uk/cosmic/signatures). (B) Relative contribution of AID mutations (black) and mutations without AID mutations (white) for TCL1 and DT-AID mice. Using a 12% cutoff, DT-AID mice showed a higher contribution of AID mutations than TCL1 (5 of 7 vs 0 of 5; P = .02, Fisher exact test). (C) Venn diagram depicting the number of genes mutated by AID in TCL1 and DT-AID mice. (D) Quantification of mutations according to occurrence at canonical and noncanonical AID hotspots, and C>T transitions in CpG, for TCL1 vs DT-AID mice. Significant differences were found comparing c-AID mutations between both strains (P = .02 2-tailed, unpaired Student t test). (E) Genomic context of AID-related variants. Significant differences in exonic (P = .03), ncRNA (P = .04), and 5′ UTR (P = .03) (2-tailed, unpaired Student t test). Upstream and downstream indicate variants overlapping the 1-kb region up/downstream of transcription start or end site. Intergenic regions were excluded from analyses. (A-E) *P < .05. (F) Recurrently mutated genes, ≥5 c-AID mutations distributed between at least 2 mice in DT-AID mice are represented, summing the 7 genomes included in our study for this genotype. Total number of mutations in each gene, for the entire group, is depicted on the y-axis. Genes are displayed on the x-axis according to mutation numbers. Genes previously described as AID-off targets are indicated by red characters and an open triangle. Driver genes in B-cell neoplasms previously described are underlined and identified by a red triangle. Genes in bold plus italic letters represent genes associated with tumor development. Genes associated with CLL progression are highlighted by asterisks.
Analysis of the somatic mutation pattern31 showed a higher proportion of C>T transitions at the preferred RCY AID hotspots in DT-AID than TCL1 mice (Figure 2A; supplemental Figure 3B). Unbiased assessment of underlying mutagenic processes showed that 3 main signatures accounted for >95% of the variance in the sample set, with a higher contribution of the AID signatures in the DT-AID than the TCL1 mice (Figure 2B). Interestingly, mutations at AID canonical hotspots (c-AID; C>T/G within RCY motifs)32 dominated (supplemental Figure 3).
Analysis of genome-wide AID signatures
We identified mutations that might have resulted from the action of AID using 3 criteria: (1) those occurring at c-AID, (2) those considered to be indirectly induced by AID through noncanonical mismatch repair (nc-AID; A>C/G at WAN motifs),33 and (3) C>T transitions in CpG (NCG).34 These variants are collectively referred to as “AID mutations” hereafter and were more abundant in DT-AID than TCL1 (Figure 3C; supplemental Excel File 1, sheet 5). However, of these 3, c-AID mutations were the only signature significantly increased in DT-AID mice, either genome-wide (Figure 2D), or specifically in exons, noncoding RNA (ncRNA), and 5′ untranslated region (UTRs) (Figure 2E).
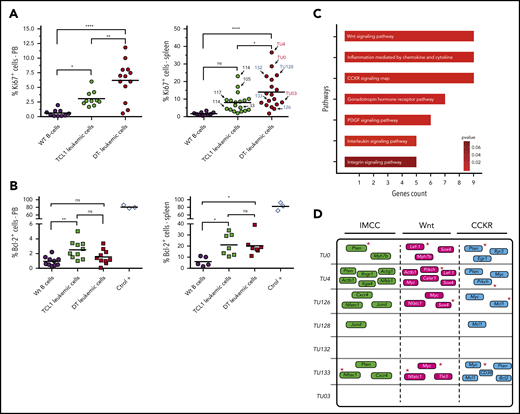
Proliferation/antiapoptotic markers and main genes/pathways affected by c-AID mutations in DT-AID mice. (A) Percentages of IgM+CD5+Ki67+ cells in the blood (left) and spleen (right) from wild-type (WT) controls (black circles), TCL1 (green circles), and DT-AID (red circles) mice determined by flow cytometry (n ≥ 10; 1-way, multiple comparison ANOVA). Arrows indicate the mouse used for the WES experiments (right panel). (B) Percentages of IgM+CD5+Bcl-2+ cells in the blood of wt (black circles), TCL1 (green squares), and DT-AID (red squares) mice. CD19+ cells from C57BL/6 mice and Jurkat T-cell line cells (ctrol +) are shown as controls. No significant differences exist (1-way, multiple comparison ANOVA; n ≥ 7). (A-B) *P < .05, **P < .001, ****P < .0001. (C) Signaling pathway analysis of the groups of genes harboring nonsynonymous c-AID mutations in DT-AID mice. The 7 pathways depicted were significantly enriched and are shown according to the number of affected genes (Panther Pathway enrichment analysis; P < .05). The 3 pathways with the highest gene counts were: “Inflammation mediated by chemokine and cytokines signaling” (IMCC; PPA: P00031), “Wnt signaling” (PPA: P00057), and “Cholecystokinin and gastrin receptors (CCKR) signaling” (PPA: P06959). (D) Mutated genes for each mouse in the 3 underlined pathways. Red asterisks identify genes previously involved in B-cell proliferative disorders.
Proliferation/antiapoptotic markers and main genes/pathways affected by c-AID mutations in DT-AID mice. (A) Percentages of IgM+CD5+Ki67+ cells in the blood (left) and spleen (right) from wild-type (WT) controls (black circles), TCL1 (green circles), and DT-AID (red circles) mice determined by flow cytometry (n ≥ 10; 1-way, multiple comparison ANOVA). Arrows indicate the mouse used for the WES experiments (right panel). (B) Percentages of IgM+CD5+Bcl-2+ cells in the blood of wt (black circles), TCL1 (green squares), and DT-AID (red squares) mice. CD19+ cells from C57BL/6 mice and Jurkat T-cell line cells (ctrol +) are shown as controls. No significant differences exist (1-way, multiple comparison ANOVA; n ≥ 7). (A-B) *P < .05, **P < .001, ****P < .0001. (C) Signaling pathway analysis of the groups of genes harboring nonsynonymous c-AID mutations in DT-AID mice. The 7 pathways depicted were significantly enriched and are shown according to the number of affected genes (Panther Pathway enrichment analysis; P < .05). The 3 pathways with the highest gene counts were: “Inflammation mediated by chemokine and cytokines signaling” (IMCC; PPA: P00031), “Wnt signaling” (PPA: P00057), and “Cholecystokinin and gastrin receptors (CCKR) signaling” (PPA: P06959). (D) Mutated genes for each mouse in the 3 underlined pathways. Red asterisks identify genes previously involved in B-cell proliferative disorders.
Next, we defined those genes that were recurrently mutated at c-AID hotspots in the DT-AID strains as those exhibiting ≥5 mutations distributed between at least 2 mice, and not present in the TCL1 model (supplemental Excel File 1, sheets 5-6). Thirty-four genes met these criteria and, among these, 18 genes (53%) have been identified as AID nonimmunoglobulin targets in murine B cells35-38 (Figure 2F). Furthermore, we identified a series of recurrently mutated genes with a c-AID signature that have not been previously described in either AID-38 or TCL1-transgenic models39 (supplemental Data 1). Thus, the DT-AID mice accumulated c-AID mutations in different cancer-specific genes that were directly mutated by AID. These included a striking accumulation of mutations in genes encoding histones (Hist1h1c, Hist1h1d, Hist1h1e, and Hist2h2aa1) and in tumor-associated transcription factors (Gata3, Bhlhe41, Sox4, Klf2, Zfp36l2, Tcf7). Furthermore, we found a higher number of c-AID mutations in genes associated with tumor development (Myc, Ly6e, Dusp2) as well as linked with CLL development and progression40-42 (Pim-1, Nfatc1, Mcl1, Pten, and Lef-1) (Figure 2F).
Leukemic cells overexpressing AID show increased proliferation and c-AID mutations affecting genes in cancer-associated pathways
AID expression is restricted to a subpopulation of cells that are dividing43 or have recently divided.44 To investigate whether the more aggressive disease in the DT-AID models correlated with tumor proliferation and/or survival rates, we evaluated Ki67 and BCL-2 protein levels in circulating and/or splenic IgM+CD5+ cells. DT-AID mice had significantly higher percentages of IgM+CD5+Ki67+ cells in PB and spleen than TCL1 and C57BL/6 animals (Figure 3A). In contrast, BCL-2 levels in the same cell populations were not significantly different (Figure 3B).
Functional annotation of genes bearing nonsynonymous mutations in c-AID hotspots in the DT-AID strains identified 7 significantly enriched pathways, most of them involved in cell proliferation and tumor growth. Interestingly, among the 3 path-ways with the highest gene counts, we found Wnt signaling (Panther Pathway Accession [PPA]: P00057), which was associated with CLL progression45 (Figure 3C-D). Notably, many of the genes involved in these 3 pathways were shared between the different DT-AID animals and previously linked with CLL progression (Mcl1,46 Myc,47 Pten,48 Nfatc1,41 and Lef-142 ) or with leukemia in general (Sox449 and Prkch50 ) (Figures 2F and 3D, red asterisks).
Genes mutated by AID in proliferating leukemic cells
Because AID’s mutagenic activity is operative in dividing cells43 and associates with tumor development,51 and given the higher percentage of Ki67+ leukemic cells observed in DT-AID mice, we searched nonimmunoglobulin genes bearing AID mutations that could affect leukemia cell proliferation. We isolated splenic IgM+CD5+Ki67+ cells and IgM+CD5+Ki67− cells from selected mice (Figure 3A, arrows) for WES. Analyses of these data show that the c-AID mutation signature was significantly greater in the DT-AID than the TCL1 mice (Figure 4A-B).

Genes mutated by AID in proliferating and resting leukemic cells. (A) Quantification of mutations in Ki67+ cells according to occurrence at canonical and noncanonical AID hotspots, and C>T transitions in CpG for TCL1 and DT-AID animals. Analyses of these data show that the c-AID mutation signature was significantly greater in the DT-AID than in the TCL1 mice (median, 121 ± 40 vs 18 ± 9, respectively; P = .027, 2-tailed, unpaired Student t test). (B) Genomic context of AID-related variants in Ki67+ cells of TCL1 and DT-AID mice. Significant differences using the 1-tailed exonic, unpaired Student t test (P = .04), ncRNA (P = .04), and 3′UTR (P = .03), were found. *P < .05 (A-B). (C) Graphical representation of the genes affected by nonsynonymous mutations (exonic, UTRs, and up/downstream regions), which adhered to the c-AID context in Ki67+ and Ki67− cells. Figure was generated using genes with >5 c-AID mutations; these are highlighted in bold letters. Red bold letters denote gene drivers described in CLL30,52 and DLBCL53 and in the KI67+ fraction. Genes underlined and in bold letters are mutated members of the Wnt-signaling pathway. (D) c-AID mutations were selected and functionally annotated using statistical overrepresentation (KEGG pathways; Fisher exact test). Wnt pathways with the mutated genes affected by c-AID and nonsynonymous mutations are shown. Black asterisks identify genes with c-AID mutations in Ki67+ and Ki67− fractions. Red asterisks identify genes with c-AID mutations only present in the Ki67+ fraction. As depicted, genes involved in these pathways and previously associated with tumor progression such as Lef-1, Tcf-7, Sox4, Prkch, and Celsr-1 were found.
Genes mutated by AID in proliferating and resting leukemic cells. (A) Quantification of mutations in Ki67+ cells according to occurrence at canonical and noncanonical AID hotspots, and C>T transitions in CpG for TCL1 and DT-AID animals. Analyses of these data show that the c-AID mutation signature was significantly greater in the DT-AID than in the TCL1 mice (median, 121 ± 40 vs 18 ± 9, respectively; P = .027, 2-tailed, unpaired Student t test). (B) Genomic context of AID-related variants in Ki67+ cells of TCL1 and DT-AID mice. Significant differences using the 1-tailed exonic, unpaired Student t test (P = .04), ncRNA (P = .04), and 3′UTR (P = .03), were found. *P < .05 (A-B). (C) Graphical representation of the genes affected by nonsynonymous mutations (exonic, UTRs, and up/downstream regions), which adhered to the c-AID context in Ki67+ and Ki67− cells. Figure was generated using genes with >5 c-AID mutations; these are highlighted in bold letters. Red bold letters denote gene drivers described in CLL30,52 and DLBCL53 and in the KI67+ fraction. Genes underlined and in bold letters are mutated members of the Wnt-signaling pathway. (D) c-AID mutations were selected and functionally annotated using statistical overrepresentation (KEGG pathways; Fisher exact test). Wnt pathways with the mutated genes affected by c-AID and nonsynonymous mutations are shown. Black asterisks identify genes with c-AID mutations in Ki67+ and Ki67− fractions. Red asterisks identify genes with c-AID mutations only present in the Ki67+ fraction. As depicted, genes involved in these pathways and previously associated with tumor progression such as Lef-1, Tcf-7, Sox4, Prkch, and Celsr-1 were found.
Next, we focused our analysis to genes in the Ki67+ fraction bearing any c-AID mutation that could affect gene expression or function: that is, in the UTRs, up and downstream 2-kb gene regions (∼2 kb), as well as nonsynonymous mutations (n = 136) (supplemental Excel File 2, sheet D). This analysis showed 41 genes (30%) only mutated in the Ki67− fraction (subgroup I), 42 genes mutated in both fractions, (subgroup II), and 53 (39%) only mutated in the Ki67+ fraction (subgroup III; Figure 4C). Newly mutated genes in the Ki67+ fraction (subgroup II shared with a subset of subgroup I and subgroup III not shared with subgroup I; n = 95, 70% of genes) were remarkably enriched in c-AID mutations affecting histones and B-cell neoplasm gene drivers (Figure 4C, red genes). Sixteen of 167 gene drivers (9%) found in the Ki67+ fraction have been described in human CLL30,52,54 and/or DLBCL53 (supplemental Excel File 2, sheet E). Thus, forcing AID expression in TCL1 mice led to the accumulation of c-AID mutations in a subset of driver genes found in human B-cell neoplasms. Wnt signaling was the most overrepresented pathway affected by c-AID mutations inside of the Ki67+ fraction (Figure 4D; supplemental Figure 3).
Mutated genes in the Ki67+ fraction displaying c-AID signatures
Among genes identified in the Ki67+ fraction (subgroup II and III; Figure 4C), 11 were chosen for in-depth analysis because they had nonsynonymous c-AID mutations in coding regions and/or in UTRs or up/downstream regions. These genes clustered into 3 groups: oncogenes (Pim-1, Mcl-1, and Myc), tumor-suppressor genes (Pax-5, Dusp2, Gata-3, Klf2, and Zfp36l2), and histones (Hist1h1d, Hist1h1e, and Hist1h2h2aa1). Most of the c-AID mutations fell in functional regions in both DT-AID models (Figure 5).

Gene mutational maps of candidate driver genes with c-AID signatures involved in CLL progression. Graphic representation of 11 selected mutated genes with c-AID signatures separated in oncogenes (A), tumor supressors (B), and genome chromatin/histones (C) categories. Red gene names highlight previously described tumor drivers in human cancers. Black asterisks refer to mutations detected in the whole-leukemic clone; red asterisks indicate mutations found in the Ki67+ fraction. Key domains where AID mutations are detected and the corresponding base-pair number for each gene map are shown. Specifically, in the case of histones, red characters indicate substitutions in H1.3 (Leu83→Phe and Ser90→Asp) and in H1.4 (Leu82→Phe) located at conserved DNA-binding domains. Leu82→Phe substitution was found in 3 different mice of both DT-AID strains. For H1.4, the Ala111→Thr and Ala112→Thr changes are placed within the AKP helix motif of domain H15, which is essential for this histone family’s functional integrity. For H2A, the Glu65→Asp mutation directly affects the DNA-binding site. Blue characters identify individual TCL1/Igκ-AID mice carrying c-AID mutations; red characters identify TCL1/act-AID mice.
Gene mutational maps of candidate driver genes with c-AID signatures involved in CLL progression. Graphic representation of 11 selected mutated genes with c-AID signatures separated in oncogenes (A), tumor supressors (B), and genome chromatin/histones (C) categories. Red gene names highlight previously described tumor drivers in human cancers. Black asterisks refer to mutations detected in the whole-leukemic clone; red asterisks indicate mutations found in the Ki67+ fraction. Key domains where AID mutations are detected and the corresponding base-pair number for each gene map are shown. Specifically, in the case of histones, red characters indicate substitutions in H1.3 (Leu83→Phe and Ser90→Asp) and in H1.4 (Leu82→Phe) located at conserved DNA-binding domains. Leu82→Phe substitution was found in 3 different mice of both DT-AID strains. For H1.4, the Ala111→Thr and Ala112→Thr changes are placed within the AKP helix motif of domain H15, which is essential for this histone family’s functional integrity. For H2A, the Glu65→Asp mutation directly affects the DNA-binding site. Blue characters identify individual TCL1/Igκ-AID mice carrying c-AID mutations; red characters identify TCL1/act-AID mice.
Among the oncogenes, we found mutations in the kinase catalytic domain of the protein kinase–encoding PIM-1, in the Bcl-2 apoptosis-regulator domain of MCL-1 protein, and within the 5′UTR of Myc (Figure 5A). In tumor suppressors, each transcription factor (PAX-5, GATA-3, KLF-2, and ZFP36L2) had mutations in DNA-binding domains (Figure 5B). In the case of histones, we found an unexpected number (>14) of c-AID mutations on the H1 family proteins, including H1.3 and H1.4 variants encoded by Hist1h1d and Hist1h1e, respectively. Mutations in H1.3, H1.4, and H2A affected key amino acid positions. All of them are placed at the conserved DNA-binding domains or affect the AKP helix motif of domain H15 in H1.4, which is essential for this histone family’s function (Figure 5C, red letters).
The AID mutational profile from DT-AID models resembles those of progressive human CLL expressing AID
To further explore the role of AID expression in human CLL progression, and to validate the usefulness of the DT-AID models, we performed WES on leukemic clones from 12 progressive patients with CLL (supplemental Table 1; supplemental Excel File 3), systematically identifying genes mutated in the patients and in our murine models. Patients were selected based on continuous AID expression (AID mRNA+ in PB white blood cells every 3 months until treatment), Binet stage, and short time to first treatment. WES data from the human and murine CLL samples were analyzed for mutational context, focusing on putative AID hotspots (c-AID; nc-AID and NCG). Our initial analysis revealed that introduction of the Aid transgene in TCL1 mice resulted in mutations that corresponded closely with the AID mutational signatures in the progressive CLL patients (Figure 6A; supplemental Figure 6). A higher number of c-AID mutations, which can be directly ascribed to AID activity, were shared between the DT-AID model with progressive human disease. In total, 20 genes harboring 64 c-AID mutations in the DT-AID (lower red ticks) and 26 in the human progressive cohort (upper red ticks) were simultaneously affected (Figure 6A, largest circos plot), whereas no genes showing c-AID hotspots were affected in the TCL-1 and progressive CLL cohort (Figure 6A small circus plot). Notably, a much higher number of nonimmunoglobulin genes were concomitantly mutated in DT-AID and progressive CLL (45 c-AID, 7 nc-AID, and 19 NCG) than in TCL-1 and progressive patients (3 c-AID, 2 nc-AID, and 4 NCG) (Figure 6B).

Genome-wide distribution of the mutational patterns in nonimmunoglobulin genes from TCL1 and DT-AID models compared with a progressive CLL cohort. Mutations in nonimmunoglobulin genes of mice models. (A) Circos plots showing the somatic mutation landscape focused on mutations that might have resulted from the action of AID (c-AID; nc-AID and NCG mutations). Links from one to the other side indicate punctual mutations occurring in the same gene of the both genomes compared in the circus. The link width is proportional to the number of mutations found in a particular gene. Red ticks indicate c-AID mutations; orange ticks, nc-AID mutations; and gray ticks, NCG mutations. Circos axes represent the number of mutations in different colors for each mutational signature. (B) Histogram showing the number of total nonimmunoglobulin genes that are mutated in the TCL1 model compared with progressive (Prog.) CLLs and in the DT-AID model compared with progressive CLL cohort simultaneously. (C) Circos plots showing mutations with potential functional impact on nonimmunoglobulin genes that remain mutated in the TCL1 strain and DT-AID model compared with the progressive CLL cohort, respectively. Functional annotation in human samples was performed using the Ensembl Variant Effect Predictor toolkit (CITE: https://www.ncbi.nlm.nih.gov/pmc/articles/PMC4893825/). Tumor gene drivers and genes involved in the Wnt pathway mutated in DT-AID and progressive CLL cases are underlined.
Genome-wide distribution of the mutational patterns in nonimmunoglobulin genes from TCL1 and DT-AID models compared with a progressive CLL cohort. Mutations in nonimmunoglobulin genes of mice models. (A) Circos plots showing the somatic mutation landscape focused on mutations that might have resulted from the action of AID (c-AID; nc-AID and NCG mutations). Links from one to the other side indicate punctual mutations occurring in the same gene of the both genomes compared in the circus. The link width is proportional to the number of mutations found in a particular gene. Red ticks indicate c-AID mutations; orange ticks, nc-AID mutations; and gray ticks, NCG mutations. Circos axes represent the number of mutations in different colors for each mutational signature. (B) Histogram showing the number of total nonimmunoglobulin genes that are mutated in the TCL1 model compared with progressive (Prog.) CLLs and in the DT-AID model compared with progressive CLL cohort simultaneously. (C) Circos plots showing mutations with potential functional impact on nonimmunoglobulin genes that remain mutated in the TCL1 strain and DT-AID model compared with the progressive CLL cohort, respectively. Functional annotation in human samples was performed using the Ensembl Variant Effect Predictor toolkit (CITE: https://www.ncbi.nlm.nih.gov/pmc/articles/PMC4893825/). Tumor gene drivers and genes involved in the Wnt pathway mutated in DT-AID and progressive CLL cases are underlined.
To further explore the role of AID in CLL progression, we searched for specific nonimmunoglobulin genes carrying potentially functionally impacting mutations in the DT-AID models and human CLLs. Twenty genes were affected in DT-AID and progressive CLL; of these, 7 displayed c-AID mutations and 3 nc-AID mutations. Interestingly, Prkch, Pax-5, Mcl1, Hist1h1b, Hist1h1c, and Hist1h1d, bearing an AID signature, were identified in the DT-AID model, in the Ki-67+ murine fraction, and in the human progressive cohort (Figure 6C).
Altogether, these data confirmed that the mutational pattern developed by the introduction of the Aid transgene into the TCL-1 model emulates the genotype in progressive CLLs in which persistent AID expression was documented.
Murine DT-AID model recapitulates mutations reported for human lymphomagenesis
Of the 11 genes with nonsynonymous c-AID mutations in the Ki67+ fraction mentioned herein, Pax-5, Pim-1, Dusp-2, Mcl1, Gata-3, Klf2, Hist1h1e, and Hist1h1d are considered human tumor drivers.55 Notably for Pim-1, Mcl-1, Hist1h1e, and Hist1h1d, the amino acid changes occurred at identical positions in the DT-AID mice and human neoplasms. Analyses of available crystal structures for these proteins predict that these mutations have functional consequences (Figure 7).
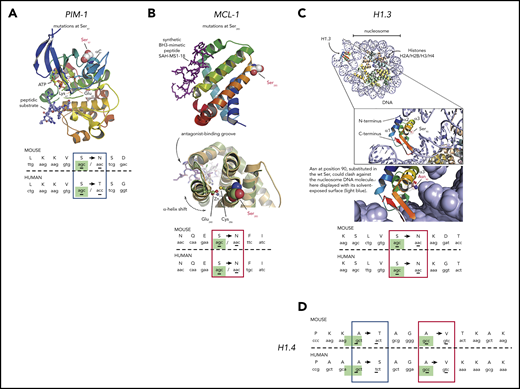
Three-dimensional modeling of c-AID mutations in specific genes from DT-AID mice that recapitulate tumor driver mutations in humans. Structural analyses using available crystal structures of the proteins mutated by AID shared between humans and mice. c-AID mutations of humans/mice in tumor cells. (A) Illustration of PIM-1 PDB 3A9956 with a red-to-blue color ramp indicating N- to C-terminal sense. Substrates, ATP, and peptide (in sticks) are bound in the active site and labeled for reference. Key residues are labeled, including the mutated Ser97 (in spheres) at the C-terminal end of helix αC. (B) MCL-1 PDB 5W89,57 shown with similar structure representation and color ramp as in panel A. A synthetic peptide (purple sticks) that acts as MCL-1 antagonist is bound in the MCL-1 hydrophobic groove. The position of Ser285, substituted by an Asn in the mouse model, is highlighted. (C) Using the crystal structure of a full nucleosome (PDB 4QLC) that includes linker histone H5,58 homologous linker histone H1.3 PDB 1GHC59 was superposed onto H5 and is illustrated in the top complex with H1.3 colored with a ramp. The accuracy of the superposition was aided by structurally aligning an independent complex of H1 with an entire nucleosome PDB 5NL0,60 not shown here for clarity. The position of Ser90 in H1.3 is highlighted in the inset, pointing toward the nucleosomal DNA. Below the inset, Ser90 was substituted in silico by an asparagine to model the c-AID mutation found on H1.3. (D) c-AID mutations found at identical positions in histone H1.4 (human) and its ortholog Hist2h2aa1 (mouse). For all illustrations (A-D), the codon context of key mutations in both species is shown in the bottom with homologous residues aligned and the specific c-AID mutation boxed. Blue boxes mark c-AID mutations conserved in both human and mouse, but encoding different amino acid changes. Red boxes mark c-AID mutations that result in identical amino acid substitutions. The c-AID signature context (C>T/G within RCY motifs) is highlighted in green in mice and in human species.
Three-dimensional modeling of c-AID mutations in specific genes from DT-AID mice that recapitulate tumor driver mutations in humans. Structural analyses using available crystal structures of the proteins mutated by AID shared between humans and mice. c-AID mutations of humans/mice in tumor cells. (A) Illustration of PIM-1 PDB 3A9956 with a red-to-blue color ramp indicating N- to C-terminal sense. Substrates, ATP, and peptide (in sticks) are bound in the active site and labeled for reference. Key residues are labeled, including the mutated Ser97 (in spheres) at the C-terminal end of helix αC. (B) MCL-1 PDB 5W89,57 shown with similar structure representation and color ramp as in panel A. A synthetic peptide (purple sticks) that acts as MCL-1 antagonist is bound in the MCL-1 hydrophobic groove. The position of Ser285, substituted by an Asn in the mouse model, is highlighted. (C) Using the crystal structure of a full nucleosome (PDB 4QLC) that includes linker histone H5,58 homologous linker histone H1.3 PDB 1GHC59 was superposed onto H5 and is illustrated in the top complex with H1.3 colored with a ramp. The accuracy of the superposition was aided by structurally aligning an independent complex of H1 with an entire nucleosome PDB 5NL0,60 not shown here for clarity. The position of Ser90 in H1.3 is highlighted in the inset, pointing toward the nucleosomal DNA. Below the inset, Ser90 was substituted in silico by an asparagine to model the c-AID mutation found on H1.3. (D) c-AID mutations found at identical positions in histone H1.4 (human) and its ortholog Hist2h2aa1 (mouse). For all illustrations (A-D), the codon context of key mutations in both species is shown in the bottom with homologous residues aligned and the specific c-AID mutation boxed. Blue boxes mark c-AID mutations conserved in both human and mouse, but encoding different amino acid changes. Red boxes mark c-AID mutations that result in identical amino acid substitutions. The c-AID signature context (C>T/G within RCY motifs) is highlighted in green in mice and in human species.
For PIM-1, a serine/threonine kinase overexpressed in CLL,61 Ser97 is changed in both DT-AID models and CLL. This mutation is crucial in regulating protein kinase activity. Figure 7A illustrates the ionic bridge between Glu89 and Lys67 essential to achieve kinase activation.62
In the case of MCL-1, a key protein in lymphoid development and survival,63 we identified a shared Ser→Thr replacement (murine Ser266 and human Ser285) (Figure 7B). Our structural analysis comparing PDB 5W89 to 5LOF64 suggests 2 putative, not mutually exclusive scenarios. Either the Ser is important for posttranslational regulatory signaling or it plays an allosteric role in modulating the BH3-binding groove.
Concerning the histone H1 family, we exploited the available structures of H1 and H5 alone and in complex with DNA (PDBs 1GHC, 4QLC, and 5NL0).58-60 In particular, the Ser90→Arg substitution in H1.3 could lead to steric hindrance of the histone favoring chromatin decompaction (Figure 7C inset). Interestingly, this specific mutation has also been identified in CLL.52 For histone H1.4, 2 specific c-AID mutations result in 2 different amino acid changes (Ala164→Ser and Ala167→Val). Again, both mutations have also been described in CLL.30,52
Remarkably, 3 of 5 of these shared mutations led to the introduction of the same amino acid in mice and humans (Figure 7) and for the other 2, the substitutions were conservative as there is high physicochemical similarity between Ser and Thr (Hist1h1e) and between polar and almost isosteric residues Thr and Asn (Pim-1) (Figure 7A,D).
Altogether, the fact that each of these mutations occurs at the same positions in the respective genes and that the changes are either identical or chemically conservative in DT-AID mice and CLL patients strongly suggests that these mutations were selected because they influence the development and/or evolution of CLL.
Discussion
A long-standing model of cancer evolution posits that tumor cells progress through stages via an iterative process of expansion, diversification, and selection.65 Clonal expansion can promote genetic diversification by the acquisition of new mutations and selection of subclones containing “advantageous” mutations that favor disease progression and/or therapeutic refractoriness.66 Although in CLL cells microenvironmental influences increase AID expression and drive CLL progression,17,18,23,67 the association of AID activity, disease evolution, and poor clinical outcome in progressive CLL patients remains hypothetical due to a lack of direct experimental evidence that specific off-target mutations in CLL clones are involved in disease progression.
Therefore, to better understand how AID overexpression in CLL patients promotes disease progression, we developed 2 murine strains overexpressing AID in the TCL1 background. Consistent with our hypothesis, both DT-AID models experienced more rapid and aggressive IgM+CD5+ CLL-like disease, resembling the worse clinical outcomes of patients with U-CLL expressing AID in leukemic B cells.15,16,18,67 Because in the TCL1/act-AID mice AID is expressed globally, malignant T-cell lymphomas could arise.21 Nevertheless, TCL1/act-AID mice gave rise to CD5+ B-cell leukemia instead of a T-cell lymphoma, probably because of an earlier temporal expansion of CD5+ clones (supplemental Figure 4). This effect could be due to the antiapoptotic actions of TCL1 in murine B lymphocytes.68
The leukemic cells in DT-AID mice grew faster and led to more rapid death. Because of this and AID’s expression being increased in proliferating human subsets of the leukemic clone,18,23,69 we performed WES not only of the whole leukemic clone but also of leukemia cells stratified into proliferating (Ki67+) and nonproliferating (Ki67−) fractions. Because mutations bearing AID signatures affected mainly coding regions, we focused mainly on mutations with potential functional impact. Because c-AID mutations were enriched in the whole leukemic clone and in the IgM+CD5+Ki67+ fractions of DT-AID animals, correlation of AID activity with cell division was evident.43 The findings in the Ki67+ fraction pinpoint key genes altered by c-AID mutations in the Wnt pathway, which are frequently mutated and involved in CLL progression.45 Despite this interesting observation, our data in the human cohort do not identify c-AID mutations in Wnt-associated genes, possibly due to interpatient heterogeneity. A larger cohort of patients expressing AID needs to be analyzed to correlate c-AID mutations with the constitutive activation of the Wnt axis in CLL.
Moreover, genes described as AID targets and/or as gene drivers in B-cell neoplasms were only found in the proliferating fraction (Pax-5, Irf4, and Ube2a). Additionally, the genes with the highest number of c-AID mutations (Hist1h1c, d, and e, Pim1, Mcl1, Myc, and others) were shared with components of the resting fraction, indicating that they occurred upon activation of resting cells. This is consistent with cycling cells emanating from resting ones69 and that AID is only active in cycling cells.43 Hence the new, nonshared AID-induced mutations facilitate the emergence of new clonal variants that could be selected for enhanced tumor fitness.
Recently, unbiased sequencing on CLL genomes confirmed the existence of genetic heterogeneity among patients and revealed important intratumor heterogeneity.30 These data are in agreement with patients differing in clinical course having different proliferation rates and ratios of proliferating and quiescent fractions expressing (or not) AID, respectively.4,17,23,44,69,70 Previous analyses of the AID mutational signatures in CLL performed on nonstratified cohorts13,31,33,71 identified AID-induced genomic uracil formation not restricted to immunoglobulin genes.13,31,33 Additionally, analyses of an indolent CLL cohort showed a preponderance of noncanonical (20%) over canonical AID signature (5%), whereas an aging signature accounted for 75% of the total mutations.72,73
Here, by restricting our WES analyses to leukemic cells overexpressing AID, we documented a mutational pattern dominated by a c-AID signature in the unseparated and Ki67+ subsets of DT-AID clones compared with the TCL1 counterpart. Considering that TCL-1 recapitulates progressive and U-CLL,19,20,74 and that AID overexpression associates with a clinically poor outcome in U-CLL patients,15,67,75,76 we further compared our mouse WES findings with those of progressive U-CLLs with sustained AID expression. This revealed that overexpression of AID in the TCL-1 model drives more progressive disease with increased off-target c-AID mutations. Again, this particular pattern recapitulated many of the mutations found in progressive human CLL patients expressing AID, strongly suggesting a direct link between AID overexpression and disease progression.
Finally, we identified genes (Prkch, Pax-5, Mcl1, Hist1h1b, Hist1h1c, Hist1h1d) carrying an AID signature in DT-AID and human CLLs that could be have a role in leukemia progression after upregulation of AID enzyme.
To further explore this hypothesis, we compared genes bearing c-AID signatures in DT-AID animals to mutations described in the same genes in human tumors. Four genes (Pim-1, Mcl-1, Hist1h1d, and Hist1h1e) were mutated at homologous base pairs in mice and humans, and all occurred within a c-AID context. On the basis of available crystal structures, we modeled the sites of those mutations, providing structural bases for putative functional effects in cancer progression (Figure 7). Specifically for Moloney murine leukemia virus 1 (PIM-1) and MCL-1 proteins, the structural changes could be relevant for CLL progression because PIM kinases are essential for CLL survival40,77 and MCL-1 levels correlate with resistance to fludarabine therapy.78 Additionally, the MCL-1 Ser285 replacement could allosterically modulate the BH3-binding groove and change the groove’s affinity for antiapoptotic BH3-containing proteins, leading to therapeutic resistance to MCL-1 inhibitors (Figure 7B).
A striking observation was the quantity of c-AID mutations found in histone family genes. H1 histones are necessary for the condensation of nucleosome chains and for regulation of gene transcription through chromatin remodeling and DNA methylation.79 Interestingly, Hist1h1b, Hist1h1c, Hist1h1d, and Hist1h1e, which are drivers in human CLL,30,78 in DLBCL53 and in FL,80 are mutated in the AID-DT models as well as in the human progressive disease.
Interestingly, the sites of c-AID mutations observed in Hist1h1e and Hist1h1d are identical between mouse and human and in some cases even the amino acid changes are the same. Hence, we propose a feed-forward mechanism whereby c-AID mutations affecting the H1 histone family favor the formation of single-stranded DNA, which in turn allows further mutagenesis by AID. Supporting this hypothesis is the Ser90→Asn substitution in Hist1h1d that could lead to physical clash of the histone with the nucleosome DNA promoting DNA decompaction (Figure 7C).
It is noteworthy that point mutations in PIM-1, MCL-1, H1.3, and H1.4 occurred at the same homologous positions in our murine models and a published human CLL cohort (Figure 7).52 Even more remarkable is that among 5 shared mutations, 3 led to the same and the other 2 to conservative amino acid substitutions based on physiochemical similarity. The chances of finding mutations leading to identical or biochemically equivalent amino acid changes in driver genes in 2 different unrelated species developing the same malignancy is highly unlikely to be random, and strongly suggests that a selection of these changes confers functional advantages for leukemia progression.
In summary, we describe 2 novel transgenic mouse models that recapitulate aggressive CLL and are useful tools to study AID off-target mutations in genes related with disease progression in a leukemic context. We also describe for the first time the mutational pattern of a progressive U-CLL cohort overexpressing AID and confirm that nonimmunoglobulin mutations with a c-AID signature found in the DT-AID models occur in these progressive U-CLL clones. These findings allowed us to highlight previously defined CLL mutations in nonimmunoglobulin genes, and identify new ones, some of which are tumor drivers in human B-cell leukemias/lymphomas and could therefore be relevant for the disease. Collectively, these new findings support a direct association between an activated leukemic B-cell population, aberrant AID action, and clonal aggressiveness in CLL.
Sequencing data will be deposited in the Sequence Read Archive (SRA): AID overexpression in a murine model of CLL (submission no. SUB7384979, accession number pending). For human samples, the sequence data are deposited in DRYAD and accessible for peer review at: https://datadryad.org/stash/share/pMx4ZdDDneBBm9cWh8jiAQGhgMS4MvzzSMLL3PyZLss.
The online version of this article contains a data supplement.
The publication costs of this article were defrayed in part by page charge payment. Therefore, and solely to indicate this fact, this article is hereby marked “advertisement” in accordance with 18 USC section 1734.
Acknowledgments
The authors thank Davide F. Robbiani and Michel C. Nussenzweig for sharing the Igk-AID Tg mice, Hossein Khiabanian for analytic suggestions, Gimena Dos Santos for helpfulness assistance, and Diego Alvarez from Centro Austral de Tecnología Genómica (catg.cl) for his expert bioinformatics advice.
This work was supported, in part, by grants from the Fondo para la Convergencia Estructural del Mercosur (COF 03/11, CSIC I+D_2014, and FCE_1_2011_1_7273 (P.O.); a Consejo Nacional de Investigaciones Científicas y Técnicas (CONICET) postdoctoral fellowship and funding from the Agencia Nacional de Investigación e Innovación (ANNI) and Televie (FNRS 7.8506.19) (P.E.M.); Fondo Nacional de Desarrollo Científico y Tecnológico (FONDECYT) grants 1180882 and MAG1895 (M.A.N.); and contributions from The Nash Family Foundation, The Marks Foundation, the Karches Family, and the Jean Walton Fund for Leukemia, Lymphoma, and Myeloma Research (N.C. and K.R.R.).
Authorship
Contribution: M.A.N., N.C., and P.O. conceived and designed the study; M.A.N., K.R.R., N.C., and P.O. provided study materials; V.R. provided patient samples; P.E.M., X.-J.Y., M.E.M., T.B., G.F.-G., N. Seija, N. Sotelo, C.A., M.C., N.R., and S.P.M. conducted experiments; J.S. and M.A.N. performed bioinformatics analysis; P.E.M., X.-J.Y., M.E.M., F.P., N.R., A.B., M.A.N., and P.O. analyzed and interpreted data; P.E.M., M.A.N., J.M.D.N., A.B., N.C., and P.O. wrote the manuscript; and all authors read and approved the final manuscript
Conflict-of-interest disclosure: P.O. is founder and chief hematology-oncology scientific officer of Ardan Immuno Pharma. The remaining authors declare no competing financial interests.
Correspondence: Pablo Oppezzo, Institut Pasteur de Montevideo, Research Laboratory on Chronic, Lymphocytic Leukemia, Montevideo 11400, Uruguay; e-mail: poppezzo@pasteur.edu.uy; Nicholas Chiorazzi, Karches Center for Oncology Research, The Feinstein Institutes for Medical Research, Manhasset, NY 11030; e-mail: nchizzi@northwell.edu; and Marcelo A.` Navarrete, School of Medicine, University of Magallanes, Av Bulnes 01855, 6210427 Punta Arenas, Chile; e-mail: marcelo.navarrete@umag.cl.

This feature is available to Subscribers Only
Sign In or Create an Account Close Modal