

Key Points
CAR T-cell resistance is associated with tumor and systemic immune dysregulation that is greater in patients with high tumor burden.
Poor CAR T-cell expansion is associated with tumor IFN signaling and peripheral blood M-MDSCs.

Abstract
Axicabtagene ciloleucel (axi-cel) is a chimeric antigen receptor (CAR) T-cell therapy for relapsed or refractory large B-cell lymphoma (LBCL). This study evaluated whether immune dysregulation, present before CAR T-cell therapy, was associated with treatment failure. Tumor expression of interferon (IFN) signaling, high blood levels of monocytic myeloid-derived suppressor cells (M-MDSCs), and high blood interleukin-6 and ferritin levels were each associated with a lack of durable response. Similar to other cancers, we found that in LBCL tumors, IFN signaling is associated with the expression of multiple checkpoint ligands, including programmed cell death–ligand 1, and these were higher in patients who lacked durable responses to CAR-T therapy. Moreover, tumor IFN signaling and blood M-MDSCs associated with decreased axi-cel expansion. Finally, patients with high tumor burden had higher immune dysregulation with increased serum inflammatory markers and tumor IFN signaling. These data support that immune dysregulation in LBCL promotes axi-cel resistance via multiple mechanistic programs: insufficient axi-cel expansion associated with both circulating M-MDSC and tumor IFN signaling, which also gives rise to expression of immune checkpoint ligands.
Introduction
Axicabtagene ciloleucel (axi-cel) is a CD19-directed, CD28-costimulated, chimeric antigen receptor (CAR) T-cell product. It was approved for patients with relapsed or refractory large B-cell lymphoma (LBCL) on the basis of the ZUMA-1 trial that reported an overall response rate of 82%, with an ongoing response in 39%, at a median follow-up of 27 months.1,2 On trial, >90% of progressions occurred within 6 months after axi-cel infusion. Identified factors that affect the efficacy of CAR T-cell therapy include the quality of circulating T cells used for manufacturing, homeostatic cytokine levels at the end of lymphodepleting (LD) chemotherapy, and CAR T-cell expansion.2-4 Efficacy results seem similar in patients with LBCL treated with CD19 CAR T cells costimulated by 4-1BB instead of CD28, with or without fixing the ratio of CD4:CD8 cells.5,6 Therefore, despite different manufacturing processes and varying costimulatory signals, a similar number of patients seem to attain a durable benefit. Conversely, observational studies in the standard-of-care CAR T-cell therapy setting have identified patient factors that associate with decreased axi-cel efficacy. These include a poor performance status, the requirement for bridging therapy, a higher tumor burden, and elevated baseline lactate dehydrogenase (LDH) levels.7,8
LBCL is genetically and biologically heterogeneous. This diversity includes both tumor and the corresponding tumor microenvironment (TME), and it affects response to standard immunochemotherapy.9-13 Patients with active disease experience systemic immune dysregulation detectable in peripheral blood and characterized by elevated cytokines, altered myeloid cell populations, and T-cell deficits.14-19 In addition, patients with lymphoma have high levels of circulating myeloid-derived suppressor cells (MDSCs) compared with healthy control subjects; in LBCL, a higher number of CD14+, HLA-DRlow monocytic (M)-MDSCs associate with higher risk disease and poorer efficacy after chemotherapy.16,20
Thus, axi-cel therapy involves infusion of engineered T cells into patients with LBCL who have already experienced various types of systemic and tumor immune dysregulation. We hypothesized that characteristics of immune dysregulation in patients with LBCL may influence the efficacy of axi-cel therapy.
Methods
Patients and samples
Patient characteristics and clinical outcomes are shown in supplemental Table 1 (available on the Blood Web site). Details on the assay and blood analyte sample sizes are shown in supplemental Table 2. Assays were run for patients with adequate samples at the time of analysis without other selection. In total, samples were obtained from 105 patients treated with axi-cel; 85 patients received standard of care therapy, 14 patients as part of a clinical trial, and 6 patients received axi-cel under the ZUMA-9 (ClinicalTrials.gov identifier: NCT03153462) expanded access trial for products outside of manufacturing specifications. Samples were prospectively collected under institutional review board–approved protocols. Research was conducted in accordance with the Declaration of Helsinki. Durable responders were defined as patients who remained in remission with a minimum follow-up of 6 months after axi-cel infusion. Nondurable responders were patients who died of any cause or experienced relapsed lymphoma. Cytokines were measured as previously described.21
Tumor gene expression
NanoString RNA expression was measured by using the IO360 panel. Results were analyzed based on outcome (no durable response [NDR] vs durable response [DR]) and preselected cutoffs to create high and low groups. RNA-sequencing libraries were prepared by using the NuGen RNA-Seq Multiplex System (Tecan US) following manufacturer protocols. The libraries were sequenced on the Illumina NextSeq 500 system with a 75-base paired-end run at 80 to 100 million read pairs per sample.
Multiplex immunofluorescence
Antibodies used were against CD19 (LE-CG19, dilution 1:100; Dako), CD20 (L26, 1:900; Dako), CD3 (SP7, 1:200; Thermo Fisher Scientific), major histocompatibility complex (MHC) I (EMR8-5, 1:400; Abcam), MHC II (CR3/43, 1:400; Dako), and programmed cell death-ligand 1 (PD-L1) (E1L3N, 1:200; Cell Signaling Technology). Multiplexing and image quantification methods are detailed in supplemental Figure 1.
Myeloid-derived suppressor cells
M-MDSCs (Lin–, CD11b+, CD33+, CD15–, CD14+, and HLA-DRlow) were enumerated in apheresis product or blood by flow cytometry. For suppression assays, M-MDSCs, and autologous T cells (CD3+) were obtained from apheresis material by flow sorting, beads and a magnetic column (Miltenyi), respectively. T cells were stimulated with CD3/CD28–coated beads, and proliferation index was measured by overnight 3H thymidine incorporation after 48 hours of culture.
Axi-cel expansion
Axi-cel levels were measured by quantitative polymerase chain reaction on days 1, 8, and 15 following CAR T-cell infusion. Additional methods are provided in supplemental Figure 6.
Genomic data analysis
NanoString data analysis used nSolver4.0 with the Advanced Analysis R package. NCICCR-DLBCL data were downloaded from the GDC Data Portal (study accession, phs001444; NIH dbGaP #23872). ISG.RS gene expression enrichment score was calculated based on the R package GSVA, with a panel of 38 genes as previously described.22 Gene expression values were compared based on the Wilcoxon test implemented in ggpubr R package. The optimal cut point for dichotomized ISG.RS signature score was determined by using the survminer R package.
Results
Tumor interferon signaling associates with a lack of durable response after axi-cel
Systemic inflammation produced by the tumor and TME may drive immune evasion in LBCL.23 We obtained tumor biopsy specimens before axi-cel therapy and compared results between patients attaining a DR, defined as patients who remained in remission at a minimum of 6 months’ following axi-cel infusion, and those with NDR due to disease relapse or death. Using multiplex immunofluorescence, we simultaneously assessed CD19, CD20, CD3, PD-L1, MHC I, and MHC II (n = 26) (supplemental Figure 1A-B). The percentages of malignant B cells (defined as CD19+ and/or CD20+) that were also positive for MHC II or PD-L1 were higher in NDR patients compared with DR patients (Figure 1A-B). No difference was noted between NDR and DR patients for percentage of infiltrating CD3+ T cells, nor percentage of positive malignant B cells also positive for MHC I (supplemental Figure 1C). The expression of PD-L1 and MHC II, which may cause exhaustion by binding to T-cell programmed cell death protein 1 (PD-1) and lymphocyte activation gene 3 (LAG-3), respectively, is regulated by tumor interferon (IFN) signaling.24-27 We therefore used a NanoString limited gene expression panel enriched for genes of the TME on pretreatment biopsy specimens (n = 35). Among differentially expressed genes, patients with NDR had significantly higher expression of genes known to be targets of tumor IFN signaling (Figure 1C; supplemental Figure 2A-B). In solid tumors, a tumor IFN–stimulated gene signature termed ISG.RS is associated with a multigenic program of T-cell exhaustion and worse outcomes after immune checkpoint blockade.22,24 This signature is distinct from the T-cell IFNG.GS gene signature, which is associated with a higher response to checkpoint blockade. We performed RNA-sequencing (n = 18) and used gene set enrichment analysis to show that the tumor ISG.RS signature is enriched in patients with NDR to axi-cel, whereas the T-cell IFNG.GS signature is enriched in patients with DR (Figure 1D-E).

Tumor IFN signaling and macrophage markers associate with a lack of durable response after axi-cel. Baseline tumor biopsy specimens were collected within 1 month before axi-cel infusion. Multiplex immunofluorescence on baseline tumor biopsy specimens (n = 26) using a panel consisting of tumor markers CD19 and CD20, MHC I and II, CD3, and PD-L1 (supplemental Figure 1). (A-B) The percentage of tumor cells (CD19+ and/or CD20+) that are positive for PD-L1 (A) and MHC II (B) are shown, comparing patients with NDR vs those with a DR to axi-cel. (C) Differential gene expression using the NanoString IO360 panel (770 genes) comparing patients with NDR (n = 18) vs those with a DR (n = 17). Shown is a heatmap including rows indicating known IFN target genes on the panel as well as macrophage (Mϕ) markers and CD19. Each column represents an individual patient sample. The heatmap indicates z scores for each gene. RNA-sequencing was performed on baseline biopsy specimens in patients who went on to have a DR (n = 10) or NDR (n = 8). (D-E) Gene set enrichment analysis showing the enrichment of the tumor IFN signature ISG.RS in patients with NDR (D) and the enrichment of the T-cell IFN signature IFNG.GS in patients with DR (E). (F) Macrophage score by NanoString nSolver advanced analysis, compared between patients with NDR and DR. P values according to nonparametric (Mann-Whitney) t tests.
Tumor IFN signaling and macrophage markers associate with a lack of durable response after axi-cel. Baseline tumor biopsy specimens were collected within 1 month before axi-cel infusion. Multiplex immunofluorescence on baseline tumor biopsy specimens (n = 26) using a panel consisting of tumor markers CD19 and CD20, MHC I and II, CD3, and PD-L1 (supplemental Figure 1). (A-B) The percentage of tumor cells (CD19+ and/or CD20+) that are positive for PD-L1 (A) and MHC II (B) are shown, comparing patients with NDR vs those with a DR to axi-cel. (C) Differential gene expression using the NanoString IO360 panel (770 genes) comparing patients with NDR (n = 18) vs those with a DR (n = 17). Shown is a heatmap including rows indicating known IFN target genes on the panel as well as macrophage (Mϕ) markers and CD19. Each column represents an individual patient sample. The heatmap indicates z scores for each gene. RNA-sequencing was performed on baseline biopsy specimens in patients who went on to have a DR (n = 10) or NDR (n = 8). (D-E) Gene set enrichment analysis showing the enrichment of the tumor IFN signature ISG.RS in patients with NDR (D) and the enrichment of the T-cell IFN signature IFNG.GS in patients with DR (E). (F) Macrophage score by NanoString nSolver advanced analysis, compared between patients with NDR and DR. P values according to nonparametric (Mann-Whitney) t tests.
We next interrogated NanoString gene expression data for genes associated with immune populations in the TME.28 Macrophages had the strongest association with NDR (Figure 1F; supplemental Figure 3A-B). As examples of individual macrophage-associated genes, CD163 (3.4-fold; P = .02) and the IFN-targeted macrophage gene Siglec-1 (2.9-fold; P < .001) were higher at baseline in patients with NDR, whereas no association was seen for CD68 (P = .2). Finally, the expression of macrophage genes, or the macrophage cell signature, positively correlated with the expression of IFN signaling genes (supplemental Figure 3C). For example, R values were >0.6 between the macrophage score and the IFN target genes IFI27, IFIT3, and CCL8. Conversely, the cell type signature that had the strongest association with DR was T cells. However, CD3 itself was not significant, and there was a poor correlation between T cells and IFN signaling gene expression (supplemental Figure 3C-D).
Recently, CRISPR screening showed that loss of tumor-associated death receptors leads to CAR T-cell resistance.29,30 Of genes involved in apoptosis or death receptor signaling, FADD (fold change, −1.2; P = .04) and BAD (fold change, −1.4; P = .05) exhibited differential expression in our data set and were modestly lower in patients with NDR. A complete list of differentially expressed genes from the NanoString panel is provided in supplemental Table 3.
Suppressive circulating M-MDSCs associate with a lack of DR after axi-cel
Another feature of the immune dysregulation in patients with LBCL is an alteration in circulating immune cell subsets. In particular, M-MDSCs are elevated in patients with LBCL compared with healthy control subjects and associate with decreased efficacy of standard chemo-immunotherapy.16,20 We first confirmed the presence of suppressive M-MDSCs in the study patients. We collected M-MDSCs (Lin–, CD11b+, CD33+, CD15–, CD14+, and HLA-DRlo cells) from the fresh apheresis product that was used for autologous axi-cel manufacture and confirmed these cells suppress T-cell activation and proliferation (Figure 2A). The frequency of M-MDSCs in the peripheral blood during axi-cel therapy was then quantified. The frequency and the absolute numbers of peripheral blood M-MDSCs were higher at baseline in patients with NDR compared with patients with a DR (Figure 2B,D). Similarly, there was a nonsignificant suggestion that the peak level of M-MDSCs in blood after axi-cel therapy was associated with NDR after axi-cel infusion (Figure 2C,E). The frequency of M-MDSCs at baseline correlated with the peak level (R = 0.7; P < .0001) (Figure 2F).
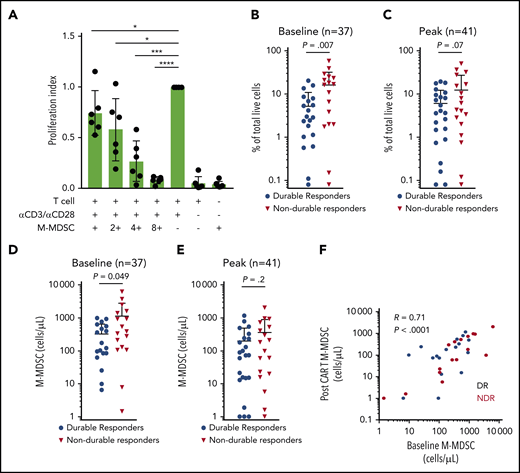
Suppressive circulating M-MDSCs are associated with NDR after axi-cel. (A) Suppressive M-MDSCs are present in LBCL patient apheresis collection material used for axi-cel manufacture. Peripheral blood mononuclear cells collected by apheresis for the purpose of CAR T-cell manufacture were flow sorted for M-MDSCs (Lin–, CD11b+, CD33+, CD15–, CD14+, and HLA-DRlow) and cocultured with CD3+ T cells isolated from the same apheresis at varying ratios. Proliferation index was calculated, and results from 6 consecutive patients are shown. M-MDSCs were collected at baseline before LD chemotherapy and post–axi-cel (days 6, 11, 16, and 21) for LBCL, with peak indicating the highest value observed after axi-cel. (B-C) M-MDSCs shown as percentage of live cells and compared between patients experiencing DR or NDR. (D-E) M-MDSCs shown as cells per mL peripheral blood. (F) Correlation between baseline M-MDSCs and peak M-MDSCs after CAR T-cell infusion, in the peripheral blood. P values according to nonparametric t test. *P < .05; ***P < .001; ****P < .0001.
Suppressive circulating M-MDSCs are associated with NDR after axi-cel. (A) Suppressive M-MDSCs are present in LBCL patient apheresis collection material used for axi-cel manufacture. Peripheral blood mononuclear cells collected by apheresis for the purpose of CAR T-cell manufacture were flow sorted for M-MDSCs (Lin–, CD11b+, CD33+, CD15–, CD14+, and HLA-DRlow) and cocultured with CD3+ T cells isolated from the same apheresis at varying ratios. Proliferation index was calculated, and results from 6 consecutive patients are shown. M-MDSCs were collected at baseline before LD chemotherapy and post–axi-cel (days 6, 11, 16, and 21) for LBCL, with peak indicating the highest value observed after axi-cel. (B-C) M-MDSCs shown as percentage of live cells and compared between patients experiencing DR or NDR. (D-E) M-MDSCs shown as cells per mL peripheral blood. (F) Correlation between baseline M-MDSCs and peak M-MDSCs after CAR T-cell infusion, in the peripheral blood. P values according to nonparametric t test. *P < .05; ***P < .001; ****P < .0001.
Baseline dysregulation of cytokines persists through LD chemotherapy
Serum ferritin is a marker of inflammation that is routinely measured in patients receiving CAR T-cell therapy and may be elicited by interleukin-6 (IL-6) or type I or II IFNs.31-33 We collected available ferritin levels at the time of T-cell apheresis (3-4 weeks before axi-cel infusion), before LD chemotherapy (day −6), and in the morning before infusion of axi-cel (day 0). Baseline ferritin levels were higher in patients with NDR, significantly when measured on the day of axi-cel infusion (Figure 3A). There was a strong correlation between ferritin levels before and after LD chemotherapy (Figure 3B,F). Furthermore, we measured IL-6 levels either at apheresis or before LD (“baseline”) and on the day of axi-cel infusion (day 0); we also recorded the highest (“peak”) measured value in the first month. Similar to ferritin, IL-6 levels were significantly higher at day 0 in patients with NDR (Figure 3C). Baseline IL-6 levels correlated with day 0 IL-6 levels as well as with baseline ferritin levels (Figure 3D-F). Additional cytokines known to change during CAR T-cell therapy, including IL-1β, IL-2, IL-15, IFN-γ, tumor necrosis factor-α (TNF-α), and the ratio ANG2/ANG1, were also measured. Ferritin levels most prominently correlated with IL-6 but also with other cytokines. Multiple cytokines correlated with the same measurement at another time point. Finally, C-reactive protein (CRP) levels were found to correlate with ferritin and IL-6 levels (supplemental Figure 4A-B). CRP levels were significantly higher at apheresis (P = .02) and before lymphodepletion (P = .01) in NDR compared with DR patients (supplemental Figure 4C). These results support that systemic inflammation involving multiple acute-phase reactants (notably ferritin, CRP, and IL-6) persists through LD chemotherapy and is associated with poorer outcome after axi-cel.
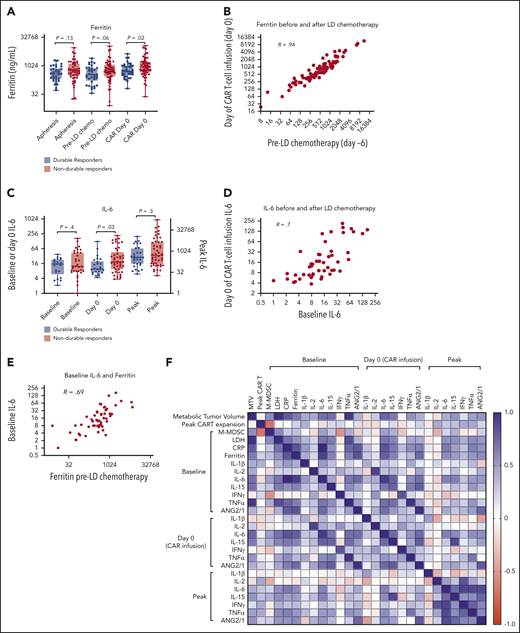
Inflammatory markers persist through LD chemotherapy and associate with NDR. (A) Serum ferritin levels at apheresis (3-4 weeks before infusion; n = 83), day −6 (pre-LD; LD fludarabine/cyclophosphamide chemotherapy; n = 88), and before axi-cel infusion (day 0; n = 93). (B) Correlation (Pearson R) between ferritin values measured both LD and before axi-cel infusion. (C) IL-6 levels measured at baseline (at apheresis or day −6; n = 54), day 0 (n = 70), and the peak level measured in the first 21 days after CAR T-cell therapy (n = 78). (D) Correlation between baseline and day 0 IL-6 levels. (E) Correlation between baseline IL-6 and day −6 ferritin levels. (F) Correlation matrix represented as a heatmap with positive Spearman R values indicated in blue and negative values indicated in red (scale). P values according to nonparametric t test.
Inflammatory markers persist through LD chemotherapy and associate with NDR. (A) Serum ferritin levels at apheresis (3-4 weeks before infusion; n = 83), day −6 (pre-LD; LD fludarabine/cyclophosphamide chemotherapy; n = 88), and before axi-cel infusion (day 0; n = 93). (B) Correlation (Pearson R) between ferritin values measured both LD and before axi-cel infusion. (C) IL-6 levels measured at baseline (at apheresis or day −6; n = 54), day 0 (n = 70), and the peak level measured in the first 21 days after CAR T-cell therapy (n = 78). (D) Correlation between baseline and day 0 IL-6 levels. (E) Correlation between baseline IL-6 and day −6 ferritin levels. (F) Correlation matrix represented as a heatmap with positive Spearman R values indicated in blue and negative values indicated in red (scale). P values according to nonparametric t test.
Ferritin is associated with tumor IFN signaling but not M-MDSC frequency
We next evaluated the relationships between serum inflammatory markers, tumor IFN signaling, and M-MDSCs. We compared patients with a high ferritin level to gene expression in the TME, with a cutoff of 1000 ng/mL based on its significance in a variety of settings.34,35 We compared TME gene expression according to NanoString in patients with a high ferritin level (>1000 ng/mL; n = 8) vs patients with lower ferritin levels (<1000 ng/mL; n = 28). By differential expression, genes targeted by tumor IFN signaling as well as macrophage-associated genes in the TME were higher in the patients with a high baseline ferritin level (Figure 4A-E; supplemental Figure 5A-B; supplemental Table 4).
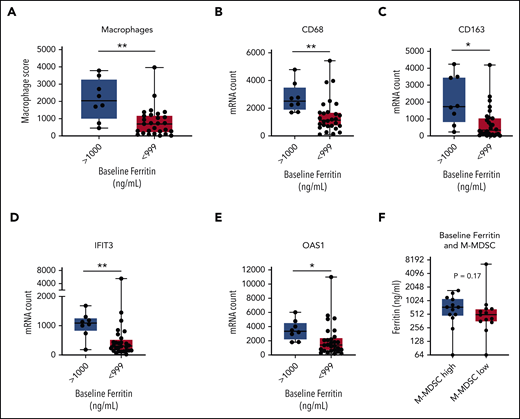
Associations between ferritin, tumor IFN, and M-MDSCs. Baseline tumor biopsy specimens collected within 1 month before axi-cel infusion and analyzed for gene expression by NanoString IO360 (770 genes) with available ferritin data (n = 36). Comparison between patients with a high baseline ferritin value (>1000 ng/mL; n = 8) and a lower value (<999 ng/mL; n = 28). (A-E) Shown are the macrophage score (A), representative macrophage markers CD68 (B) and CD163 (C), and IFN target genes IFIT3 (D) and OAS1 (E). (F) Comparison between patients with a high (>250 cells per mL; n = 13) or low (<250 cells per mL; n = 13) baseline M-MDSC level for ferritin on day −6. P values by nonparametric Mann-Whitney t tests. *P < .05; **P < .01. mRNA, messenger RNA.
Associations between ferritin, tumor IFN, and M-MDSCs. Baseline tumor biopsy specimens collected within 1 month before axi-cel infusion and analyzed for gene expression by NanoString IO360 (770 genes) with available ferritin data (n = 36). Comparison between patients with a high baseline ferritin value (>1000 ng/mL; n = 8) and a lower value (<999 ng/mL; n = 28). (A-E) Shown are the macrophage score (A), representative macrophage markers CD68 (B) and CD163 (C), and IFN target genes IFIT3 (D) and OAS1 (E). (F) Comparison between patients with a high (>250 cells per mL; n = 13) or low (<250 cells per mL; n = 13) baseline M-MDSC level for ferritin on day −6. P values by nonparametric Mann-Whitney t tests. *P < .05; **P < .01. mRNA, messenger RNA.
We next considered blood M-MDSCs. Although M-MDSCs have been linked to inflammation in other cancers,36 no correlation was found between M-MDSCs and serum inflammatory markers (Figures 3F and 4F; supplemental Figure 4D). There was limited overlap of M-MDSC data and TME gene expression data sets (n = 11) (supplemental Table 2), but none of the IFN genes in Figure 1C was significantly different between patients with high and low M-MDSCs (data not shown). These results show that high systemic inflammation and tumor IFN signaling cooccur within the same patients, whereas M-MDSCs may be associated with alternate processes.
M-MDSCs and tumor IFN signaling are associated with decreased axi-cel expansion
In the pivotal ZUMA-1 trial, the degree of early axi-cel expansion in the peripheral blood associated with a DR.1,2 In our patients, median peak axi-cel levels were 10-fold higher in patients with DR compared with those with NDR (P = .01) (Figure 5A). Next, we noted that blood M-MDSC levels negatively correlated with peak axi-cel levels (Figure 3F). Similarly, patients with a high baseline M-MDSC level (greater than median; 250 cells per μL) experienced a 4-fold lower peak axi-cel expansion compared with those with a lower baseline M-MDSC level (P = .02) (Figure 5B). In addition, gene expression in the TME was compared between patients with above-median peak axi-cel levels (“high” expansion >2 × 10⁶ copies per μg; n = 13) vs those with below-median levels (“low”; n = 9). Here, IFN signaling genes were highly expressed in patients with poor axi-cel expansion (Figure 5C; supplemental Figure 6). Finally, we evaluated the relationship between serum inflammatory markers and peak axi-cel levels and noted only a weak correlation between cytokines and expansion (Figure 3F). Similarly, peak expansion was not significantly different between patients with high or low levels of baseline ferritin, baseline CRP, or day 0 IL-6 (Figure 5D-E; supplemental Figure 4E).

Determinants of peak axi-cel expansion. Peripheral blood mononuclear cells were collected at days 1, 8, and 15, and axi-cel copy number was measured by reverse transcription polymerase chain reaction and copies per μg DNA determined. Peak indicates the highest value identified in that patient. (A) Comparison of peak axi-cel copies per micrograms in peripheral blood between patients with NDR and those with a DR. (B) Comparison of peak axi-cel level between patients with a baseline high peripheral blood M-MDSC level (>250 cells per mL; n = 10) and a lower value (n = 9). (C) Volcano plot showing gene expression by NanoString in baseline tumor biopsy specimens collected within 1 month before axi-cel infusion. Comparison is shown between patients with an above-median peak axi-cel level (>2 × 10⁶ copies per μg; “good expansion”) and those with a lower peak (“poor expansion”). IFN signaling genes are shown as yellow squares; all other genes are shown as gray circles. (D) Comparison of peak axi-cel between patients with a very high baseline ferritin value (>1000 ng/mL; n = 10) and those with a lower value (<999 ng/mL; n = 41). (E) Comparison of baseline IL-6 levels in patients with above-overall median peak axi-cel level (>2 × 10⁶ copies per μg; n = 24) to those with a lower peak (n = 18). P values by nonparametric Mann-Whitney t tests.
Determinants of peak axi-cel expansion. Peripheral blood mononuclear cells were collected at days 1, 8, and 15, and axi-cel copy number was measured by reverse transcription polymerase chain reaction and copies per μg DNA determined. Peak indicates the highest value identified in that patient. (A) Comparison of peak axi-cel copies per micrograms in peripheral blood between patients with NDR and those with a DR. (B) Comparison of peak axi-cel level between patients with a baseline high peripheral blood M-MDSC level (>250 cells per mL; n = 10) and a lower value (n = 9). (C) Volcano plot showing gene expression by NanoString in baseline tumor biopsy specimens collected within 1 month before axi-cel infusion. Comparison is shown between patients with an above-median peak axi-cel level (>2 × 10⁶ copies per μg; “good expansion”) and those with a lower peak (“poor expansion”). IFN signaling genes are shown as yellow squares; all other genes are shown as gray circles. (D) Comparison of peak axi-cel between patients with a very high baseline ferritin value (>1000 ng/mL; n = 10) and those with a lower value (<999 ng/mL; n = 41). (E) Comparison of baseline IL-6 levels in patients with above-overall median peak axi-cel level (>2 × 10⁶ copies per μg; n = 24) to those with a lower peak (n = 18). P values by nonparametric Mann-Whitney t tests.
High tumor burden is associated with systemic and tumor inflammation
We previously found that high metabolic tumor volume (MTV) is associated with a poor response to axi-cel.37 Here, we observed a moderate correlation between MTV and multiple baseline cytokines, with the highest R values for IL-6, IL-15, and TNF-α (R = 0.6-0.7), as well as with LDH (R = 0.75) (Figure 3F). We then compared patients with a high MTV (>150 mL) vs those with a lower MTV, as we previously validated this cutoff in association with efficacy. In the high MTV group, significantly higher levels of ferritin, IL-6, IL-15, TNF-α, and the ratio of ANG2/ANG1 were reported (Figure 6A-C). There was no correlation between MTV and peak axi-cel expansion (R = −0.1) (Figure 3F and Figure 6D). There was a weak correlation (R = 0.4) between MTV and baseline peripheral blood M-MDSCs but no significant difference between the low MTV and high MTV groups (Figure 6E). MTV data were available for 26 patients who had NanoString gene expression profiling performed (n = 11, high MTV; n = 15, low MTV), and IFN target genes IFI6 and IFIT1 were higher in patients with high MTV (Figure 6F). However, gene expression differences between patients with high and low MTV were distinct from differences observed between DR and NDR patients. For MTV, the most significant differences involved low expression of extracellular matrix genes in high MTV tumors, including multiple collagen isoforms (supplemental Table 7). Finally, we assessed other clinical features such as histology and bridging therapy for their relationship to inflammatory markers, but there were no notable differences (supplemental Figures 7-8).

A high tumor burden is associated with greater systemic and tumor inflammation. MTV was calculated from baseline positron emission tomography and divided into patients with low MTV (<150 mL) or high MTV (>150 mL) as previously described.37 (A) Comparison of ferritin levels (n = 67) before axi-cel infusion between patients with low or high MTV as shown. Comparison of cytokine levels (n = 58) at day 0 before axi-cel infusion (B) and at the peak level after axi-cel infusion (C). Comparison of MTV with peak axi-cel expansion (n = 42) (D) and baseline percentage M-MDSC levels (n = 33) (E). (F) Comparison of selected IFN signaling target genes in the baseline TME (n = 26). Shown are IFI6 and IFIT1. All P values by nonparametric Mann-Whitney t tests. *P < .05; **P < .01. mRNA, messenger RNA; NS, not significant.
A high tumor burden is associated with greater systemic and tumor inflammation. MTV was calculated from baseline positron emission tomography and divided into patients with low MTV (<150 mL) or high MTV (>150 mL) as previously described.37 (A) Comparison of ferritin levels (n = 67) before axi-cel infusion between patients with low or high MTV as shown. Comparison of cytokine levels (n = 58) at day 0 before axi-cel infusion (B) and at the peak level after axi-cel infusion (C). Comparison of MTV with peak axi-cel expansion (n = 42) (D) and baseline percentage M-MDSC levels (n = 33) (E). (F) Comparison of selected IFN signaling target genes in the baseline TME (n = 26). Shown are IFI6 and IFIT1. All P values by nonparametric Mann-Whitney t tests. *P < .05; **P < .01. mRNA, messenger RNA; NS, not significant.
Tumor IFN signaling is associated with tumor expression of T-cell inhibitory ligands, myeloid cells, and SOCS1 and KLHL6 mutations in LBCL
To better understand the role of IFN signaling in LBCL, we interrogated the public NCICCR data set of newly diagnosed LBCLs for the tumor IFN (ISG.RS) signature.12,22 The ISG.RS score exhibited a bimodal distribution, and we therefore compared patients with high ISG.RS scores vs those with a low ISG.RS score based on a median cutoff (supplemental Figure 9A). First, we assessed the expression of T-cell ligands previously identified to be controlled by tumor IFN signaling in solid tumors.24 Indeed, patients with high ISG.RS had significantly higher expression of multiple T-cell inhibitory ligands, including PD-L1 (CD274), PD-L2 (PDCD1LG2), Galectin-9 (LGALS9), HHLA2, and VISTA (C10orf54) (Figure 7A-B). Gene set variation analysis was next used to calculate myeloid cell type scores, and unsupervised clustering revealed an association between ISG.RS and multiple myeloid cell type signatures (Figure 7C). Correlation with the tumor IFN ISG.RS score was strongest for macrophages (R = 0.59), neutrophils (R = 0.56), and dendritic cells (R = 0.57) (supplemental Figure 9B). We found a lower correlation between ISG.RS and T cells (R = 0.43) or regulatory T cells (Tregs) (R = 0.33) (supplemental Figure 9C).
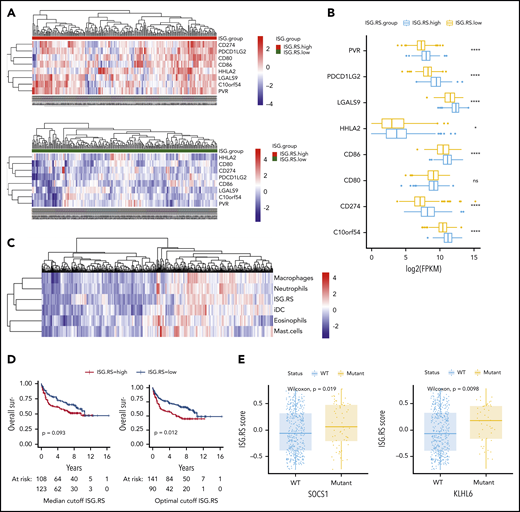
Tumor IFN signaling is associated with the expression of multiple T-cell ligands, myeloid cell signatures, and driver mutations. The NCRCCI-DLBCL data set contains 562 patients, with 475 patients with matched RNA-sequencing and DNA somatic variants data, and survival data for 231 patients treated with R-CHOP–like immunochemotherapy. The ISG.RS signature score was calculated for each patient, and a median score cutoff for the 562 patients was determined to separate ISG.RS high and ISG.RS low groups. (A) Association of ISG.RS with selected T-cell ligands. Top: gene expression of T-cell ligand genes in patients with ISG.RS high. Bottom: ISG.RS low. Included are CD274/PD-L1, PDCD1LG2/PD-L2, CD80/B7-1, CD86/B7-2, HHLA2, LGALS9/Galectin-9, C10orf54/VISTA, and PVR/CD155. (B) Comparison of the median expression of T-cell ligands between ISG.RS high and ISG.RS low. (C) Unbiased clustering of ISG.RS scores with myeloid cell type scores determined by gene set variation analysis. (D) Overall survival of 231 patients treated with R-CHOP stratified according to ISG.RS high vs low. Left: overall survival using the median cutoff as in panels A and B. Right: overall survival using an optimal cutoff (survminer R package). P value by log-rank test. (E) Association of ISG.RS scores with driver mutations. Left: comparison between SOCS1 wild-type (WT) and mutant patients according to ISG.RS score. Right: comparison between KLHL6 WT and mutant according to ISG.RS score. ****P < .0001.
Tumor IFN signaling is associated with the expression of multiple T-cell ligands, myeloid cell signatures, and driver mutations. The NCRCCI-DLBCL data set contains 562 patients, with 475 patients with matched RNA-sequencing and DNA somatic variants data, and survival data for 231 patients treated with R-CHOP–like immunochemotherapy. The ISG.RS signature score was calculated for each patient, and a median score cutoff for the 562 patients was determined to separate ISG.RS high and ISG.RS low groups. (A) Association of ISG.RS with selected T-cell ligands. Top: gene expression of T-cell ligand genes in patients with ISG.RS high. Bottom: ISG.RS low. Included are CD274/PD-L1, PDCD1LG2/PD-L2, CD80/B7-1, CD86/B7-2, HHLA2, LGALS9/Galectin-9, C10orf54/VISTA, and PVR/CD155. (B) Comparison of the median expression of T-cell ligands between ISG.RS high and ISG.RS low. (C) Unbiased clustering of ISG.RS scores with myeloid cell type scores determined by gene set variation analysis. (D) Overall survival of 231 patients treated with R-CHOP stratified according to ISG.RS high vs low. Left: overall survival using the median cutoff as in panels A and B. Right: overall survival using an optimal cutoff (survminer R package). P value by log-rank test. (E) Association of ISG.RS scores with driver mutations. Left: comparison between SOCS1 wild-type (WT) and mutant patients according to ISG.RS score. Right: comparison between KLHL6 WT and mutant according to ISG.RS score. ****P < .0001.
Although the ISG.RS score strongly associated with CAR T-cell resistance (Figure 1), we wanted to know if this signature also identified patients with poorer outcomes with standard therapies. Using the median cutoff, no significant difference in outcome was noted for patients treated with therapies similar to standard frontline R-CHOP (rituximab, cyclophosphamide, doxorubicin, vincristine, prednisone) (P = .09), but optimal cutoff analysis identified a score that predicted poorer outcome for the ISG.RS high group (P = .01) (Figure 7D). To assess the contribution of T cells to outcomes associated with ISG.RS, a multivariable Cox regression including ISG.RS, T cells, and Tregs was performed. In this model, ISG.RS was associated with significantly worse overall survival while T cells and Tregs were not (supplemental Figure 9D). Finally, we sought to identify driver mutations associated with the ISG.RS score (supplemental Table 6). The most significant association between a high ISG.RS score and genetic mutations was for SOCS1 and KLHL6 (Figure 7E).
Discussion
The current study found that the efficacy of axi-cel therapy in LBCL is affected by immune dysregulation. We observed that a lack of durable response to axi-cel is found in patients with tumor inflammation characterized by high levels of IFN target genes and multiple T-cell checkpoint ligands, a systemic inflammatory state characterized by high ferritin, CRP, and IL-6 levels in the peripheral blood, and a high level of circulating suppressive myeloid cells. Patients with tumor IFN signaling or elevated M-MDSCs experienced a lower peak CAR T-cell expansion. Overall, patients with high tumor burden had higher levels of systemic inflammation and greater expression of some IFN gene targets within tumors. These findings suggest a novel mechanistic explanation of the clinical parameters most significantly associated with inability to achieve DR: Eastern Cooperative Oncology Group performance status influenced by systemic inflammation and high International Prognostic Index score influenced by both inflammation (performance status) and tumor burden (stage, extranodal disease, and LDH level).38
Immune dysregulation could affect both the quality of the CAR T-cell product and CAR T-cell function after adoptive transfer. For example, CAR T-cell fitness is related to the quality of the starting T cells obtained by apheresis, which may be affected by tumor and prior therapy.3,39,40 Furthermore, the CAR T-cell manufacturing process can be affected by the presence of non-CAR T cells, particularly suppressive myeloid cells.41-43 It is also known that lymphodepletion and the establishment of an optimal homeostatic cytokine environment is critical for robust CAR T-cell expansion and function.4,44,45 The current study found that cytokine levels at baseline correlate with levels after lymphodepletion and at peak after CAR T-cell infusion. Therefore, immune dysregulation at baseline may impair the establishment of an optimal systemic cytokine environment post-lymphodepletion. Finally, infused CAR T cells may encounter suppressive cells in the peripheral blood, limiting optimal expansion.
We also found that characteristics of the baseline TME were associated with axi-cel outcome. Tumor IFN signaling and macrophage marker expression were associated with NDR, and these processes were correlated, consistent with the finding that tumor IFN and macrophage gene expression correlated in the NCICCR data set. In addition, macrophages in the TME have been associated with relapse in 2 recently reported clinical trials of CD19 CAR T cells in LBCL.46,47 Further study is needed to determine the mechanism by which macrophages affect CAR T-cell function and whether it differs from macrophage suppression of tumor-infiltrating lymphocytes.48 There is also evidence that circulating MDSCs are able to differentiate into macrophages within the TME, and future studies should assess this possibility in LBCL.49
The effect of IFNs on antitumor immunity varies depending on the cell type and whether the exposure to IFN is acute or chronic. On acute exposure to IFN, most immune cells increase their antitumor function.50 However, during viral infections, chronic type I and II IFN signaling can lead to immune suppression and a failure to clear viral infection.51-53 Recently, the Minn group elucidated how chronic IFN signaling mediates immunosuppression and resistance to radiation and immune checkpoint inhibitor therapy in solid tumors.2,24,54 When tumors express a gene signature (ISG.RS) consisting of genes coordinately activated by multiple types of IFN, a multigenic therapy resistance program is activated. One part of this program is to increase tumor expression of multiple T-cell ligands that lead to exhaustion of T cells infiltrating the TME. In this study, we found that IFN genes and the tumor ISG.RS signature associate with NDR. Similarly, using immunofluorescence, tumor expression of PD-L1 and MHC II (tumor IFN controlled ligands for PD-1 and LAG-3 on T cells) were associated with NDR. The expression of multiple T-cell ligands is posited to lead to an exhausted CAR T-cell phenotype. Alternatively, because ISG.RS is a resistance signature for checkpoint inhibitor therapy, it raises the possibility that effective CAR T-cell therapy requires activation of non–CAR T-cell immunity against the tumor. This idea is substantiated by recent immunofluorescence data showing that bystander T cells are activated in the TME after axi-cel therapy.55 In our study, elevated T-cell gene expression signature in baseline tumors was associated with DRs; however, neither CD3 single gene expression nor frequency of CD3+ cells by immunofluorescence was associated with response. Further studies are needed to determine if there are T-cell subsets that may be activated as a bystander and enhance CAR T-cell efficacy.
By interrogating publicly available LBCL data, we identified that the ISG.RS signature is enriched in tumors with SOCS1 and KLHL6 mutations. SOCS1 loss canonically leads to the activation of JAK-STAT-IFN signaling.56,57 Similarly, KLHL6 mutations lead to the messenger RNA degradation of TNFAIP3/A20, a key inhibitor of inflammation.58,59 Moreover, the ISG.RS high tumors expressed multiple ligands that interact with immune checkpoints found on exhausted T cells. These results suggest that a subset of LBCLs rely on tumor IFN signaling to mediate T-cell exhaustion and defend against antitumor immunity.23 This subset of LBCLs may have a poorer outcome after standard therapy, and this biology may therefore be enriched in patients undergoing CAR T-cell therapy, who relapsed multiple times.
High tumor burden is associated with poorer outcomes after axi-cel therapy.37,60 The recently reported ZUMA-1 trial biomarker analysis showed that patients with high tumor burden (measured on conventional computed tomography imaging) required greater CAR T-cell expansion to generate durable responses.60 Higher baseline ferritin, CRP, and IL-6 levels had only weak associations with tumor burden. However, these inflammatory markers were associated with worse efficacy outcomes and a worse effector:target ratio, represented by lower peak CAR T-cell expansion (fewer effectors) in relation to the volume of tumor (more targets). In the current analysis using MTV, a more robust measure of tumor burden, only moderate associations between tumor burden and levels of systemic inflammatory markers were found. Comparing biopsy specimens in a limited set of our patients, those with high tumor burden had greater amounts of some tumor IFN signaling genes compared with patients with low tumor burden. We thus provide evidence for the hypothesis that large and highly avid tumors on positron emission tomography resist CAR T-cell therapy via systemic inflammation and a more suppressive TME. Tumor-mediated abrogation of T-cell function, whether it be T cells collected for manufacture or the CAR T cells themselves after transfer, compounds the effector:target problem because large tumors require the highest expansion. Complex in vitro and in vivo systems may be required to tease out key initiators of this immunosuppressive inflammatory state deleterious to the expansion and function of CAR T cells: do tumors with IFN signaling, which we found can be present at diagnosis, drive more resistant tumors likely to be larger? Alternatively, as tumors escalate in growth rate, size, and metabolic demand, do they increasingly tax the immune environment driving IFN signaling and resistance programs? Regardless, our results are consistent with multivariable analysis of clinical markers in large groups of patients indicating that poor performance status (likely brought on by systemic inflammation) and high LDH levels (related to tumor burden) are the key clinical features independently associated with a lack of durable remission.7
This study was observational in patients receiving axi-cel therapy and is therefore limited to describing associations rather than concluding causal links. Multivariable modeling of clinical outcomes using tumor genetics, peripheral blood cytokines, MTV, TME characteristics, and circulating immune subsets would be ideal, but we were unable to analyze every biomarker in each patient due to constraints in sample collection.
In summary, our observations support that immune dysregulation is associated with resistance to CAR T-cell therapy in patients with LBCL. High circulating cytokine levels, tumor IFN signaling, and M-MDSCs are characteristics of this immune dysregulation, which may be modifiable to reduce relapses that occur after CAR T-cell therapy.
The data reported in this article have been deposited in the Gene Expression Omnibus database (accession number GSE153439).
The online version of this article contains a data supplement.
The publication costs of this article were defrayed in part by page charge payment. Therefore, and solely to indicate this fact, this article is hereby marked “advertisement” in accordance with 18 USC section 1734.
Acknowledgments
The authors greatly appreciate the assistance of staff and resources in the Moffitt Total Cancer Care, Moffitt Tissue Core, Moffitt Molecular Genomics Core, Moffitt Bioinformatics and Biostatistics Shared Resource, Moffitt Flow Cytometry Core, and the Moffitt Advanced Analytical and Digital Laboratory.
This work was supported by the National Institutes of Health, National Cancer Institute (P30 CA076292 and K23-CA201594), and generous donations from Pinellas Partners, The Hyer Family Foundation, The Hoenle Family, and the John Morroni Pinellas County First Responders Ball. H.Z. was supported, in part, by Tianjin University. The visual abstract was created with BioRender (biorender.com) as licensed by the Scientific Development Office of the Moffitt Cancer Center.
Authorship
Contribution: M.D.J., P.C.R., J.R.C.-G., C.A., M.L.D., and F.L.L. designed the work; H.Z., R.A., E.A.D., M.M., K.R., and K.S. performed experiments; M.D.J., B.C., X.W., and F.L.L. analyzed data; M.D.J., R.F., C.B., J.C.C., B.S., A.L., T.N., M.H., R.J.G., J.E.M., M.L.D., and F.L.L. provided patient samples and data; and all authors contributed to the writing of the manuscript.
Conflict-of-interest disclosure: M.D.J. reports a consultancy/advisory role for Kite/Gilead, Novartis, Takeda, and BMS. R.F. has received research funding from Novartis. C.B. reports an advisory role for Kite/Gilead. J.C.C. reports an advisory role for Kite/Gilead, Novartis, Bayer, and Genentech. B.S. reports a consultancy/advisory role for Celgene/Juno, Adaptive, Kite/Gilead, Novartis, Pharmacyclics, Spectrum/Acrotech, and AstraZeneca; and research funding from Jazz and Incyte. A.L. reports an advisory role with EUSA Pharma. T.N. reports research support to institution from Novartis and Karyopharm. J.E.M. has received research funding from Iovance. J.R.C.-G. reports consulting for Leidos; and stock options, sponsored research, and consulting for Compass and Anixa. C.A. reports an advisory role for AIG, Incyte, Kite/Gilead, and CSL Behring; and equity interest in Ionis and Akcea. M.L.D. reports research funding from Celgene, Novartis, and Atara; other financial support from Novartis, Precision Biosciences, Celyad, Bellicum, and GlaxoSmithKline; and stock options from Precision Biosciences, Adaptive, and Anixa. F.L.L. reports an advisory role for Kite/Gilead, BMS/Celgene, Novartis, Amgen, Allogene, Wugen, Calibr, Iovance, Janssen, and GammaDelta Therapeutics; reports a consultancy/advisory role for Cellular Biomedicine Group; and has received research funding from Kite/Gilead. The remaining authors declare no competing financial interests.
Correspondence: Frederick L. Locke, Moffitt Cancer Center, 12902 Magnolia Dr, Tampa, FL 33612; e-mail: frederick.locke@moffitt.org.
