

Key Points
LCH lesions are infiltrated with exhausted and dysfunctional T cells.
Immune checkpoint inhibition decreases disease burden in a preclinical mouse model of LCH and augments responses to MEK inhibition.

Abstract
Langerhans cell histiocytosis (LCH) is an inflammatory myeloid neoplasia characterized by granulomatous lesions containing pathological CD207+ dendritic cells (DCs) with persistent MAPK pathway activation. Standard-of-care chemotherapies are inadequate for most patients with multisystem disease, and optimal strategies for relapsed and refractory disease are not defined. The mechanisms underlying development of inflammation in LCH lesions, the role of inflammation in pathogenesis, and the potential for immunotherapy are unknown. Analysis of the immune infiltrate in LCH lesions identified the most prominent immune cells as T lymphocytes. Both CD8+ and CD4+ T cells exhibited “exhausted” phenotypes with high expression of the immune checkpoint receptors. LCH DCs showed robust expression of ligands to checkpoint receptors. Intralesional CD8+ T cells showed blunted expression of Tc1/Tc2 cytokines and impaired effector function. In contrast, intralesional regulatory T cells demonstrated intact suppressive activity. Treatment of BRAFV600ECD11c LCH mice with anti-PD-1 or MAPK inhibitor reduced lesion size, but with distinct responses. Whereas MAPK inhibitor treatment resulted in reduction of the myeloid compartment, anti-PD-1 treatment was associated with reduction in the lymphoid compartment. Notably, combined treatment with MAPK inhibitor and anti-PD-1 significantly decreased both CD8+ T cells and myeloid LCH cells in a synergistic fashion. These results are consistent with a model that MAPK hyperactivation in myeloid LCH cells drives recruitment of functionally exhausted T cells within the LCH microenvironment, and they highlight combined MAPK and checkpoint inhibition as a potential therapeutic strategy.
Introduction
Langerhans cell histiocytosis (LCH) is an inflammatory myeloid neoplastic disorder characterized by a variable number of myeloid cells with activating MAPK mutations and an inflammatory infiltrate.1-4 The clinical extent of disease is associated with the differentiation capacity of the myeloid precursor cells, although LCH lesions from the spectrum of clinical presentations are histologically indistinguishable. LCH lesions are composed of Langerhans cells (LCs; CD207+ dendritic cells; LCH DCs) and an inflammatory infiltrate that typically constitutes most of the cells.5 The mechanisms that orchestrate recruitment and activation of the inflammatory infiltrate and the role of immune cells in LCH pathogenesis is not known.
A median of 8% of cells within LCH lesions are LCH DCs, and the remainder are inflammatory cells. Exuberant production of proinflammatory cytokines and chemokines has been described in LCH.6 However, the etiology of the inflammatory infiltrate, its precise composition, and its contribution to pathogenesis have not been defined. Enrichment of regulatory T cells (Tregs) in LCH lesions, proximity of Tregs to LCH DCs, and increased PD-L1 expression on CD207+ cells have been described.6-13 However, the mechanisms that underlie Treg enrichment and expression of regulators of checkpoint expression in LCH lesions and the functional consequences of these observations have not been explored.
LCH remains a challenging clinical condition, for which current therapies remain suboptimal because of the rarity of the disorder and lack of understanding of pathogenic mechanisms. The current front-line standard of care is chemotherapy (vinblastine/prednisone) for systemic disease; however, ∼50% of patients with multisystem disease do not respond to the therapy,14,15 and treatment failure is associated with significant long-term morbidity and mortality.16 Salvage therapies with nucleoside analogues may be effective but are associated with considerable rates of treatment-related mortality.17
Single-agent MAPK inhibition experiments in early-phase studies in adults with LCH and related histiocytic disorders have yielded nearly universal responses in adult18-21 and pediatric22,23 early-phase trials and case series. However, the potential for this strategy to cure patients with LCH is uncertain. Cessation of MAPK inhibition is associated with rapid relapse in most cases,22,24 and peripheral blood mononuclear cells (PBMCs) with LCH-associated mutations (eg, BRAFV600E) persist in patients treated with MAPK inhibition where the presumed precursor cells disappear from circulation with successful cytotoxic chemotherapy.5,22,23
A critical role of the immune system in regulating tumorigenesis is highlighted by the dramatic clinical effects of disinhibiting cytotoxic T cells in adult cancers.25 However, the clinical potential for immune-directed therapies in LCH has not yet been investigated. This study therefore was conducted to characterize the composition and functional capacity of immune cells within the LCH lesions. Further, we tested the therapeutic potential of immune checkpoint inhibitors, alone or in combination with MAPK inhibition.
Methods
Study patients and human tissue samples
Biopsy specimens (from liver, bone, or spleen) and blood samples were collected from patients with LCH or control subjects under a protocol approved by the Baylor College of Medicine Institutional Review Board. Clinical data were recorded for each patient (supplemental Table 1, available on the Blood Web site). Samples used in mass cytometry were solid tissue cells obtained from biopsies (n = 6 BRAF WT; n = 9 BRAFV600E) and PBMCs (n = 6). Skin biopsy samples (n = 5), lymph nodes (n = 7), and PBMCs (n = 5) from healthy subjects were used as control samples. All samples, except for control skin tissue, were processed identically into single cells by mechanical disruption over 70-μm mesh (542070; Bio-One EASY strainer; Greiner), washed, and viably stored in aliquots in recovery-cell culture medium (12648-010; Gibco). Control skin tissues were incubated overnight at 37°C in PluriSTEM Dispase-II solution (1 mg/mL; SCM133; Sigma-Aldrich, St Louis, MO) before being stored in aliquots in recovery-cell culture medium. Where indicated, samples were stimulated by anti-CD3 (55329; clone: UCHT1, 1 µg/mL) and CD28 (555725; clone: CD28.2, 1 µg/mL; both from BD Biosciences) for 18 hours before acquisition for mass cytometry, but most samples were stained immediately upon thawing.
Mouse model of LCH
The animal experiments performed in this study were approved by the Institutional Animal Care and Use Committee of Baylor College of Medicine. The animals were housed under pathogen-free conditions and euthanized at various time points. BRAFV600ECD11c mice were created as described previously5,26 by crossing BRAFV600Eca/wt or BRAFV600Eca/ca mice27 with mice expressing cre recombinase under the control of the CD11c promoter (C57BL/6 background; The Jackson Laboratory). A lethal LCH-like syndrome develops in BRAFV600ECD11c mice with 1 BRAFV600ECA allele and 1 CD11c-Cre allele.5
Preclinical studies in the mouse model of LCH
Six-week-old LCH (BRAFV600ECD11c) mice were randomly assigned to the following treatment groups (9 mice per group): no treatment, MAPK inhibitor (MEKi; trametinib; Selleckchem, Houston, TX), MAPK inhibitor vehicle (Veh MEKi), anti-PD-L1 blocking antibody (clone 10F.9G; BioXCell, West Lebanon, NH), PD-L1 isotype (Iso PD-L1, Clone LTF-2; BioXCell), anti-PD-1 antibody (Clone 29F.1A12, BioXCell), or PD-1 isotype (Iso PD-1; Clone LTF2; BioXCell). Mice in the anti-PD-L1, anti-PD-1 or isotype groups were injected intravenously at 20 mg/kg on days 0 and 2, whereas animals in the MEKi group received daily intraperitoneal injection of 3 mg/kg trametinib. The animals were monitored daily for body weight and clinical score, according to previously described parameters.28,29 They were euthanized on day 14, and various tissues were harvested.
Animal tissue processing
Single-cell suspension was obtained from liver and lung of mice after digestion with an Octamacs Tissue dissociator and liver dissociation kit (130-105-807; Miltenyi Biotech). Cells after dissociation were filtered using 100-, 70-, and 50-µm filters (BD Bioscience) and were processed for red blood cell lysis in ACK lysis buffer and then subjected to centrifugation at 1000g for 5 minutes. The cells were counted, aliquoted, and either frozen or used for downstream application. The cells were processed for identification of the markers, as described in “Mass cytometry and data analysis.”
Histology and immunohistochemistry
Histology and immunohistochemistry were performed as described previously.26 Sections were stained with anti-CD4 (D7D2Z; 1:100 dilution) and anti-CD8α (D4W2Z; 1:400 dilution; both from Cell Signaling Technology, Danvers, MA) antibodies overnight at 4°C. The slides were evaluated by a pathologist blinded to the identity of the experimental groups and scored for disease burden. Disease burden was estimated based on the percentage of tumor area (both tumor cells and surrounding lymphocytes) on the entire histology section. Infiltrating CD4+ and CD8+ T cells were imaged with an Ni-E microscope (4×/0.20 Plan Apo ʎ OFN25 WD20; Nikon) and quantified with NISA image analysis software (Nikon). The region of interest was measured from 5 different random stained fields and then the H-score was calculated manually by averaging the object area fraction to calculate the amount of staining per image.
Mass cytometry and data analysis
Cells were initially stained with cisplatin (DVS Sciences) to identify live and dead cells before incubation with metal-tagged antibodies followed by an intercalator (DVS Sciences). A panel of 50 antibodies for human samples and 19 antibodies for mouse samples that encompassed a broad range of immune subsets was used for time-of-flight mass cytometry (CyTOF) in different combinations (supplemental Table 2). All procedures were in accordance with the Maxpar cell-staining protocol (Fluidigm Corporation).30 Samples were analyzed on a CyTOF-II mass cytometer (Fluidigm). Signal was bead normalized by using EQ Four Element Calibration Beads (201078; Fluidigm), according to the manufacturer’s instructions.30 All data files were normalized before analysis and uploaded to cytobank.org in the form of .fcs files. All files were first gated for viability using a gate around the double-positive population on Ir191 vs Ir193. Specific populations were gated further to provide more accurate classification of cell type. After gating, dynamic down sampling and downstream analyses were run based on the CD markers that these populations expressed at high levels.
Suppression assays
The in vitro suppressive capacity of human natural Tregs (positive control) from healthy donors or of Tregs isolated from LCH lesions (LCH-Treg) or control tonsils (Tonsil-Treg), and CD25− cells (negative control) from healthy donors was assessed in a carboxyfluorescein succinimidyl ester (CFSE)–based inhibition assay.31,32 Tregs were isolated by positive selection as CD3+CD4+CD25Bright. For the CD25− cells, CD3+CD4+CD25Low cells were collected by gating out undesired CD3+CD4+CD25Intermediate and CD3+CD4+CD25Bright populations. PBMCs were labeled with 1.5 M CFSE (ThermoFisher Scientific, Carlsbad, CA), according to the manufacturer’s instructions, and then stimulated with irradiated (40 Gy) allogeneic PBMCs (at a 4:1 effector/feeder ratio) and OKT3 (0.5 µg/mL). To assess their suppressive capacity, Tregs and PBMCs were added to the culture at a 1:1 ratio. After 7 days, cells were labeled with PE-conjugated CD4 and APC-conjugated CD8 monoclonal antibodies, and CFSE dilution was analyzed on a FACSCalibur flow cytometer to measure cell proliferation. Suppression was expressed as the percentage of inhibition of T-cell proliferation in the presence of Tregs, compared with proliferation in the absence of any added Tregs.
Mixed lymphocyte reaction assay
Freshly sorted CD3+CD8+ T cells (responders) were purified from LCH lesion biopsies and PBMCs from healthy donors (control) and stained with CFSE as for the suppression assays. Triplicate 10 000 CFSE-labeled responder CD3+CD8+ T cells were seeded in a round-bottomed 96-well plate in RPMI 10% AB serum, either alone or with irradiated (40 Gy) allogeneic PBMCs (stimulators) at 1:1, 2:1, and 5:1 ratios in the presence of CD14+ antigen-presenting cells (isolated from healthy donors by positive selection; CD3/CD14 ratio, 1:5). The cultures were incubated for 3 days at 37°C and 5% CO2. At the end of the incubation, the cells were stained with annexin V/7-AAD (BioLegend, San Diego, CA) according to the manufacturer’s instructions to exclude any dead cells. T-cell proliferation was determined by analyzing CFSE dilution of the responders (annexin-V/7-AAD− population) by flow cytometry (FACSCalibur).
T-cell activation
Tumor-infiltrating lymphocytes were stained with anti-CD3 and -CD8 and were sorted into a CD3+CD8+ population with a FACS-ARIA sorter (BD Biosciences). Recovered T cells were incubated in medium alone or stimulated with phorbol myristate acetate (PMA, 20 ng/mL) and ionomycin (1 µg/mL; both from Sigma-Aldrich). Interferon-γ (IFN-γ), interleukin-10 (IL-10), tumor necrosis factor-α (TNF-α), and IL-17α were measured by Luminex (T helper 1 [Th1]/Th2 custom; Millipore) in the supernatants collected before or 72 hours after T-cell activation.
Statistical analysis
All data are expressed as the mean ± standard deviation (SD). Intergroup comparisons were performed using the unpaired, nonparametric Wilcoxon-Mann-Whitney (WMW) test or 1-way analysis of variance (ANOVA), followed by Tukey’s post hoc test for multiple comparisons. A P < .05 was considered statistically significant.
Results
Phenotypic analysis of LCH lesions
We first analyzed the immune composition using time-of-flight mass cytometry (CyTOF) of patient tissue samples (n = 15; BRAF WT [n = 6] and BRAFV600E [n = 9]) and skin samples from healthy controls (skin CD207+ DCs; n = 5) (Figure 1A-C; supplemental Figure 1A-D). The Immune infiltrate in LCH lesions varied between 50% and 70% with CD3+ T cells and myeloid-derived suppressor cells (MDSCs; CD11b+CD14+HLA-DRlow/−CD15−) as the most abundant populations. Overall, LCH lesion DCs (HLA-DR+CD1A+), T cells, and MDSCs accounted for 25.60% ± 10.72%, 28.20% ± 6.46%, and 31.90% ± 4.02%, respectively. T cells were significantly more abundant in WT BRAF compared with BRAFV600E lesions, consistent with increased LCH DCs (HLA-DR+CD1A+) in the BRAFV600E lesions (supplemental Figure 1A-B,D; supplemental Table 3). By comparison, immune infiltrate in normal skin included 5.00% ± 1.00% LCs, 3.00% ± 1.58% T cells, and 13.60% ± 2.07% MDSCs (Figure 1B-C; supplemental Figure 1C-D). The proportion of T cells compared with MDSCs was significantly larger in the LCH lesions when compared with healthy skin (Figure 1A-C).
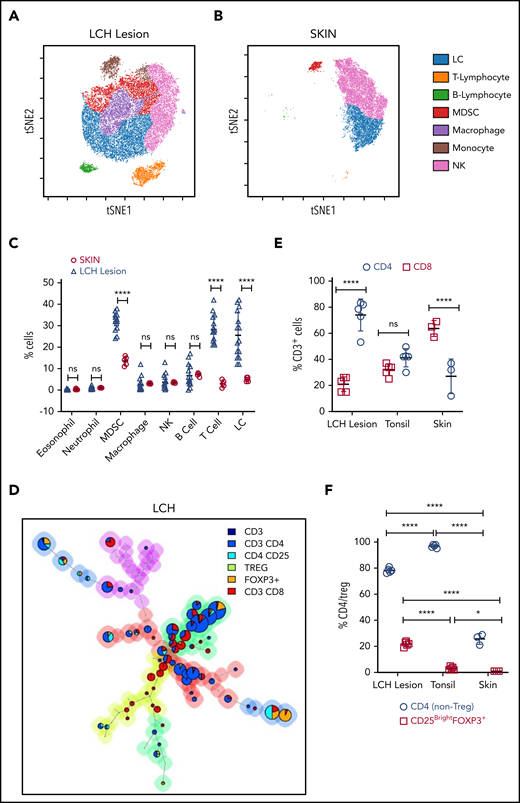
T cells are the major components of the immune infiltrate in LCH lesions. (A-B) viSNE plots of live CD45+ cells from a representative sample of an LCH lesion (A) and a biopsy specimen of control healthy skin (B). Each dot in the viSNE plots represents a single cell, and the axes represent arbitrary units based on the t distributed SNE (t SNE) algorithm. The general phenotype in multidimensional space is represented by the relative position of a cell on the plot. (C) Quantification of LCH lesion-infiltrating cells shown in panel A (n = 15) in comparison with the normal skin specimens shown in panel B (n = 5). (D) Relative T-cell subtypes in LCH. Analyses of CyTOF data were performed with the FlowSOM algorithm and visualized as pie charts, showing the mean values for the indicated markers. The background colors of the nodes result from metaclustering corresponding to an automatic gating procedure to avoid bias in the analyses. The size of the nodes is relative to the percentage of cells present in each cluster. Shown are representative FlowSOM minimal spanning tree (MST) plots for the indicated T-cell types. (E) Quantification of the relative abundance of CD4+ and CD8+ T cells in the LCH lesion infiltrate (n = 5), healthy tonsil control (n = 5), or normal skin (n = 3). (F) CD4/Treg (C25+FOXP3+) ratios in the indicated specimens (n = 5 each for LCH and tonsil; n = 3 for skin control samples). For all panels, LCH lesions were derived from liver, bone, or spleen. For panels C, E, and F, data are mean ± SD. **P < .01; ****P < .0001, ns, not significant (P > .05). WMW test in panel C, 1-way ANOVA with Tukey’s post hoc test in panels E and F. NK cell, natural killer cell; SNE, stochastic neighbor embedding; viSNE, visualization of t distributed SNE.
T cells are the major components of the immune infiltrate in LCH lesions. (A-B) viSNE plots of live CD45+ cells from a representative sample of an LCH lesion (A) and a biopsy specimen of control healthy skin (B). Each dot in the viSNE plots represents a single cell, and the axes represent arbitrary units based on the t distributed SNE (t SNE) algorithm. The general phenotype in multidimensional space is represented by the relative position of a cell on the plot. (C) Quantification of LCH lesion-infiltrating cells shown in panel A (n = 15) in comparison with the normal skin specimens shown in panel B (n = 5). (D) Relative T-cell subtypes in LCH. Analyses of CyTOF data were performed with the FlowSOM algorithm and visualized as pie charts, showing the mean values for the indicated markers. The background colors of the nodes result from metaclustering corresponding to an automatic gating procedure to avoid bias in the analyses. The size of the nodes is relative to the percentage of cells present in each cluster. Shown are representative FlowSOM minimal spanning tree (MST) plots for the indicated T-cell types. (E) Quantification of the relative abundance of CD4+ and CD8+ T cells in the LCH lesion infiltrate (n = 5), healthy tonsil control (n = 5), or normal skin (n = 3). (F) CD4/Treg (C25+FOXP3+) ratios in the indicated specimens (n = 5 each for LCH and tonsil; n = 3 for skin control samples). For all panels, LCH lesions were derived from liver, bone, or spleen. For panels C, E, and F, data are mean ± SD. **P < .01; ****P < .0001, ns, not significant (P > .05). WMW test in panel C, 1-way ANOVA with Tukey’s post hoc test in panels E and F. NK cell, natural killer cell; SNE, stochastic neighbor embedding; viSNE, visualization of t distributed SNE.
The T cells were further characterized by automatic gating with the FlowSOM,33 which allows for multivariate clustering of cells based on the self-organized map (SOM) algorithm and categorizes cells into relevant metaclusters based on their surface markers (Figure 1D, supplemental Figure 2A-C). Within LCH lesions, CD3+CD4+ T cells (74.00% ± 12.26%) were significantly higher than effector CD3+CD8+ T cells (21.00% ± 5.61%; Figure 1D-E) as compared with tonsil control (41.20% ± 7.02% CD4 and 32.00% ± 4.64% CD8; Figure 1E; supplemental Figure 2A), healthy skin (27.00% ± 13.23% CD4 and 63.67% ± 6.11%; Figure 1E; supplemental Figure 2B), or lymph node samples with macrophage activation (Kikuchi lymphadenitis; supplemental Figure 2C). Among CD4+ T cells, the fraction of Tregs was significantly greater in LCH lesions than in the tonsil or skin control specimens (Figure 1F). These results were independent of BRAF mutation status (supplemental Figure 1E-F).
Infiltrating T cells are dysfunctional
In many malignancies, tumor infiltrating CD8+ T cells mediate adaptive immune response against tumor antigen.34 Indeed, frequency of tumor-infiltrating CD8+ T cells has been widely shown to correlate with cancer-free survival time among patients with different tumor types.34 Given the presence of LCH lesion-infiltrating CD8+ T cells, we next assessed their functional capacity and found that they demonstrated attenuated expression of Tc1/Tc2 cytokines, IFN-γ, TNFα, IL-17, or IL-10 in the native state, and after stimulation. By comparison, all 4 cytokines were robustly induced in T cells isolated from healthy tonsil sections (Figure 2A-D). Accordingly, CD8+ T cells within the LCH lesions showed impaired alloreactivity (Figure 2E), consistent with altered effector function along with high CD44 expression and low-to-absent expression of CD127.6 In contrast, Tregs isolated from LCH lesions demonstrated intact suppressive activity (Figure 2F).
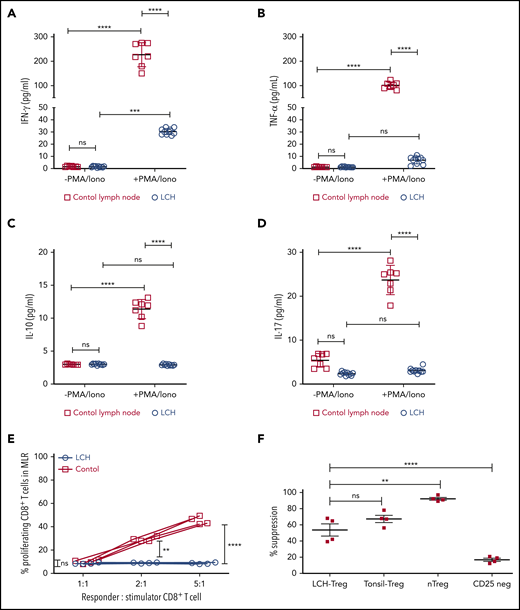
Infiltrating T lymphocytes in the LCH tumor microenvironment are dysfunctional. (A-D) Relative expression of the indicated cytokines in CD8+ T cells isolated from LCH lesions (n = 10) and control lymph nodes from a tonsillectomy (n = 7) before and after activation with PMA and ionomycin (PMA/Iono). Data are means ± SD. (E) CD8+ T cells isolated from LCH lesions, but not PBMCs from healthy donors (control), were dysfunctional, as determined by mixed lymphocyte reaction (MLR) assay. Data points represent averaged triplicate measures from cells isolated from 4 patients with LCH or controls. (F) The inhibitory activity of Tregs isolated from LCH lesions or freshly isolated “natural” Tregs (nTregs; CD3+CD4+CD25Bright), which develop in the thymus during the course of positive and negative selection, Tregs isolated from tonsils obtained from a tonsillectomy, and CD25Dep (CD3+CD4+CD25Low) cells (n = 4 each) were assessed in a CFSE-based suppression assay. Data are the mean ± SD. **P < .01; ***P < .001; ****P < .0001, ns, not significant (P > .05), by 1-way ANOVA with Tukey’s post hoc test.
Infiltrating T lymphocytes in the LCH tumor microenvironment are dysfunctional. (A-D) Relative expression of the indicated cytokines in CD8+ T cells isolated from LCH lesions (n = 10) and control lymph nodes from a tonsillectomy (n = 7) before and after activation with PMA and ionomycin (PMA/Iono). Data are means ± SD. (E) CD8+ T cells isolated from LCH lesions, but not PBMCs from healthy donors (control), were dysfunctional, as determined by mixed lymphocyte reaction (MLR) assay. Data points represent averaged triplicate measures from cells isolated from 4 patients with LCH or controls. (F) The inhibitory activity of Tregs isolated from LCH lesions or freshly isolated “natural” Tregs (nTregs; CD3+CD4+CD25Bright), which develop in the thymus during the course of positive and negative selection, Tregs isolated from tonsils obtained from a tonsillectomy, and CD25Dep (CD3+CD4+CD25Low) cells (n = 4 each) were assessed in a CFSE-based suppression assay. Data are the mean ± SD. **P < .01; ***P < .001; ****P < .0001, ns, not significant (P > .05), by 1-way ANOVA with Tukey’s post hoc test.
Infiltrating T cells in LCH tumor microenvironment exhibit an “exhausted” phenotype
Increased expression of inhibitory immune receptors can raise the threshold for activation, resulting in suppressed immune responses and T-cell exhaustion.35 Hence, to elucidate the mechanisms underlying T-cell dysfunction within LCH lesions, we assessed expression of inhibitory receptors on CD8+ and CD4+ T-cell subsets by using the FlowSOM algorithm. CD8+ T cells residing in the LCH lesions showed higher expression of the inhibitory PD-1 receptors (Figure 3A-B), a T-cell immunoglobulin- and mucin domain–containing molecule (TIM-3; Figure 3A; supplemental Figure 3B), and lymphocyte-activation gene 3 (LAG-3) (Figure 3A; supplemental Figure 3C), but not cytotoxic T-lymphocyte antigen-4 (CTLA-4) (Figure 3A), compared with peripheral CD8+ T cells from the same patients, skin controls, or peripheral CD8+ T cells from the controls (Figure 3B; supplemental Figure 3A-C). Compared with CD8+ T cells from healthy skin tissues, the CD8+ T cells from LCH lesions showed a significantly higher number of PD-1+TIM-3+ and PD-1+TIM-3+LAG-3+ cells, but not PD-1+LAG-3+ or TIM-3+LAG-3+ cells (Figure 3C). CD4+ T cells within the lesion also showed significantly higher expression of PD-1 and TIM-3 than did the peripheral CD4+ T cells from the same patients, skin controls, or peripheral CD4+ T cells from controls (supplemental Figure 3D-E). However, there was no significant difference in the number of PD-1+TIM-3+, PD-1+LAG-3+, TIM-3+LAG-3+, or PD-1+TIM-3+LAG-3+ CD4+ T cells between LCH lesions and healthy skin tissues (supplemental Figure 3F).
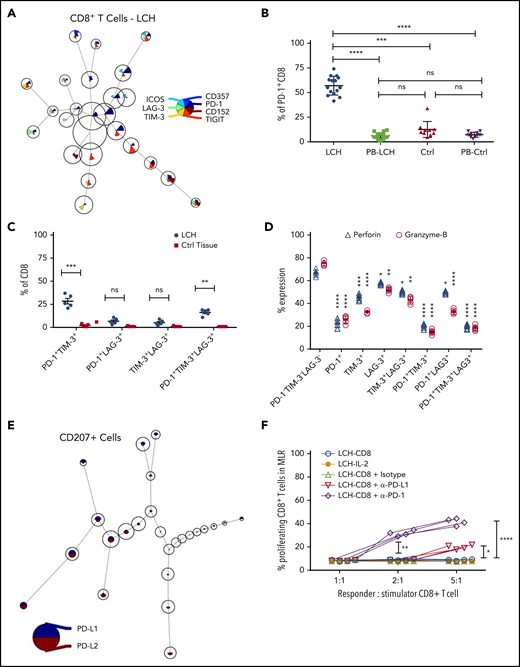
Infiltrating T lymphocytes in the LCH tumor microenvironment exhibit an exhausted phenotype. (A) Expression of different immune checkpoint receptors on LCH lesion-infiltrating CD8+ T cells. Analyses of CyTOF data were performed using the FlowSOM algorithm and visualized as pie charts. (B-C) Quantification of relative expression of PD-1 (n = 15, LCH; n = 10, control) (B) and coexpression of immune checkpoint receptors (n = 5 each) (C) in CD8+ T cells, as determined by CyTOF. Data are the means ± SD. (D) Relative expression of perforin and granzyme B in LCH lesion–infiltrating CD8+ T cells not expressing PD-1, TIM-3, or LAG-3 or expressing 1 or more of the immune checkpoint receptors (n = 5). Data are the mean ± SD. (E) Pie chart representing FlowSOM algorithm–based assessment of PD-L1 and PD-L2 expression on CD207+ gated cells. (F) Effector function of CD8+ T cells was restored after treatment for 24 hours with anti-PD-1 but not with anti-PD-L1 antibody, as determined by mixed lymphocyte reaction (MLR) assay. Data points represent averaged triplicate measures from cells isolated from 4 patients with LCH. For all panels, LCH lesions were derived from liver, bone, or spleen. *P < .05, **P < .01, ***P < .001, ****P < .0001, ns, not significant (P > .05), by 1-way ANOVA with Tukey’s post hoc test.
Infiltrating T lymphocytes in the LCH tumor microenvironment exhibit an exhausted phenotype. (A) Expression of different immune checkpoint receptors on LCH lesion-infiltrating CD8+ T cells. Analyses of CyTOF data were performed using the FlowSOM algorithm and visualized as pie charts. (B-C) Quantification of relative expression of PD-1 (n = 15, LCH; n = 10, control) (B) and coexpression of immune checkpoint receptors (n = 5 each) (C) in CD8+ T cells, as determined by CyTOF. Data are the means ± SD. (D) Relative expression of perforin and granzyme B in LCH lesion–infiltrating CD8+ T cells not expressing PD-1, TIM-3, or LAG-3 or expressing 1 or more of the immune checkpoint receptors (n = 5). Data are the mean ± SD. (E) Pie chart representing FlowSOM algorithm–based assessment of PD-L1 and PD-L2 expression on CD207+ gated cells. (F) Effector function of CD8+ T cells was restored after treatment for 24 hours with anti-PD-1 but not with anti-PD-L1 antibody, as determined by mixed lymphocyte reaction (MLR) assay. Data points represent averaged triplicate measures from cells isolated from 4 patients with LCH. For all panels, LCH lesions were derived from liver, bone, or spleen. *P < .05, **P < .01, ***P < .001, ****P < .0001, ns, not significant (P > .05), by 1-way ANOVA with Tukey’s post hoc test.
Compared with the PD-1−TIM-3−LAG-3−CD8+ T cells, the PD-1+, TIM-3+, LAG-3+, PD-1+TIM-3+, and PD-1+TIM-3+LAG-3+ CD8+ T cells presented significantly decreased granzyme B and perforin secretion (Figure 3D), indicating a whole-spectrum immunosuppression in these cells. The expression of PD-1 ligands PD-L1 and PD-L2 were significantly elevated in CD207+ DCs from LCH lesions compared with healthy skin (Figure 3E; supplemental Figure 3G).
These results suggest that immobilized PD-L1 or PD-L2-expressing CD207+ cells may engage the T cells because of their high PD-1, resulting in accumulation of exhausted T cells in the lesions. Alternatively, CD207 may induce T cells to express PD-1, in turn engaging them and eventually preventing them from performing effector functions. Thus, we next evaluated whether PD-1 blockade would restore T-cell function in LCH lesions and found that treatment of patient-derived LCH lesion CD8+ T cells with anti-PD-1 antibody for 24 hours significantly rescued their effector functions (Figure 3F). Taken together, these results suggested that PD-1 blockade could influence the immune dysfunction induced by LCH DCs.
The tumor immune microenvironment in a mouse model of LCH is comparable to that in a human LCH lesion
To determine whether ex vivo observations would translate to decreased LCH disease burden in vivo, we used our previously characterized BRAFV600ECD11c multisystem LCH mouse model, which develops an aggressive, high-risk, LCH-like disease phenotype starting at 6 weeks of age. Broad destruction of tissue architecture appears by 16 to 18 weeks of age with 100% penetrance and decreased lifespan.5 We sought initially to determine whether the LCH-like lesions in mice reflect the immune profile described earlier in human LCH. The most abundant cells in the immune infiltrate within LCH-like lung lesions were MDSCs and T cells (Figure 4A; supplemental Figure 4A). As in human lesion-infiltrating T cells, CD3+CD4+ T cells were more numerous than effector CD3+CD8+ T cells (Figure 4B; supplemental Figure 4B). Compared with Cre−/− littermate control mice there was a significantly higher number of PD-1+ and TIM-3+ CD8+ T cells in lung lesions in BRAFV600ECD11c mice (Figure 4C-D). However, we did not observe a significant difference in the number of PD-1+TIM-3+ or PD-1+TIM-3+LAG-3+ CD8+ T cells between the Cre−/− littermate control and BRAFV600ECD11c mice (Figure 4D), as was observed in LCH lesion-infiltrating CD8+ T cells (Figure 3C). A similar observation was made for the lesion-infiltrating CD4+ T cells (Figure 4E-F). The expression of PD-L1 was significantly elevated in CD11C cells within lung lesions of BRAFV600ECD11c mice (Figure 4G). Lung-lesion–infiltrating CD8+ T cells from BRAFV600ECD11c mice demonstrated attenuated expression of Tc1/Tc2 cytokines in the native state and after stimulation, in comparison with Cre−/− littermate control mice (supplemental Figure 4C). CD8+ T cells within the lung lesion of BRAFV600ECD11c mice showed impaired alloreactivity (supplemental Figure 4D). Similar observations were made for lesions within liver and spleen (data not shown). Cumulatively, this finding indicated that both the lesion and the tumor-infiltrating cells in BRAFV600ECD11c mice have similar phenotypic and functional properties, as observed in samples of patients with LCH.
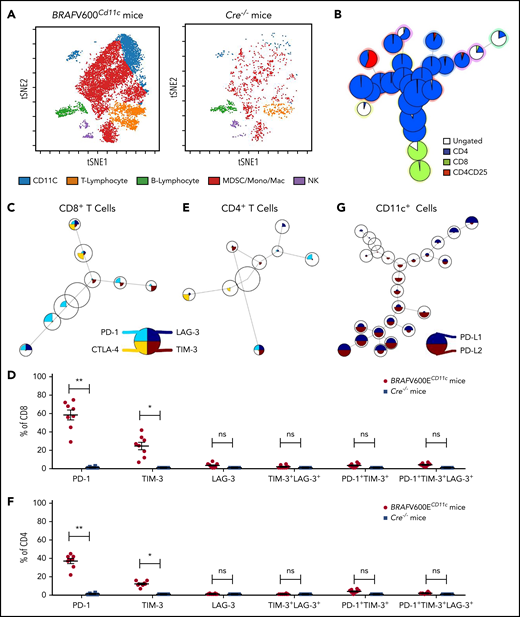
High PD-1 and PD-L1 expression is conserved in lesion-infiltrating CD8+ T cells and Cd11b+ DCs in BRAFV600ECD11cmultisystem LCH mice. (A) viSNE plot of live cells from representative lesion biopsy specimens from lungs of BRAFV600ECD11c and Cre−/− littermate control mice. (B) Relative T-cell subtypes in lesion biopsy specimens from lung of BRAFV600ECD11c mice depicted by FlowSOM analysis. (C) Expression of different immune checkpoint receptors on lung lesion-infiltrating CD8+ T cells was performed with FlowSOM analysis and visualized as pie charts. (D) Quantification of relative expression of immune checkpoint receptors in lesion-infiltrating CD8+ T cells in BRAFV600ECD11c mice and Cre−/− littermate control mice (n = 8 each). *P < .05; **P < .01; ns, not significant (P > .05), by WMW test. (E-F) Same as panels C and D, respectively, but for CD4+ T cells (n = 8 each). *P < .05; **P < .01; ns, not significant (P > .05), by the WMW test. (G) FlowSOM grid plots of CyTOF data of PD-L1 and PD-L2 expression on CD11C-gated cells.
High PD-1 and PD-L1 expression is conserved in lesion-infiltrating CD8+ T cells and Cd11b+ DCs in BRAFV600ECD11cmultisystem LCH mice. (A) viSNE plot of live cells from representative lesion biopsy specimens from lungs of BRAFV600ECD11c and Cre−/− littermate control mice. (B) Relative T-cell subtypes in lesion biopsy specimens from lung of BRAFV600ECD11c mice depicted by FlowSOM analysis. (C) Expression of different immune checkpoint receptors on lung lesion-infiltrating CD8+ T cells was performed with FlowSOM analysis and visualized as pie charts. (D) Quantification of relative expression of immune checkpoint receptors in lesion-infiltrating CD8+ T cells in BRAFV600ECD11c mice and Cre−/− littermate control mice (n = 8 each). *P < .05; **P < .01; ns, not significant (P > .05), by WMW test. (E-F) Same as panels C and D, respectively, but for CD4+ T cells (n = 8 each). *P < .05; **P < .01; ns, not significant (P > .05), by the WMW test. (G) FlowSOM grid plots of CyTOF data of PD-L1 and PD-L2 expression on CD11C-gated cells.
Testing the impacts of checkpoint inhibition on LCH-like lesions and MAPK inhibition on immune infiltrate in vivo
Identifying PD-1 expression on infiltrating lymphocytes and PD-L1 on CD11C+ cells in BRAFV600ECD11c mice prompted us to assess the impact of immune checkpoint inhibitors as a therapeutic option in the preclinical LCH model. BRAFV600ECD11c mice were treated with anti-PD-L1, anti-PD-1 antibody, or their respective isotype controls (Figure 5A). Treatment with anti-PD-1, but not anti-PD-L1 or the controls significantly decreased gross organ weight of lung (Figure 5B), liver (Figure 5C), and spleen (Figure 5D). Anti-PD-1, but not PD-L1 significantly decreased the disease burden in both lung (Figure 5E) and liver (Figure 5F). These outcomes were evidenced by decreased classic granulomatous tissue, including the multinucleated giant cell formation frequently observed in human LCH,5,36 as well as reduced histiocytic infiltration of alveoli and peribronchiolar stroma in the lungs (Figure 5G) and significantly reduced sinusoidal distension and periportal cellular infiltration in the liver (Figure 5H).
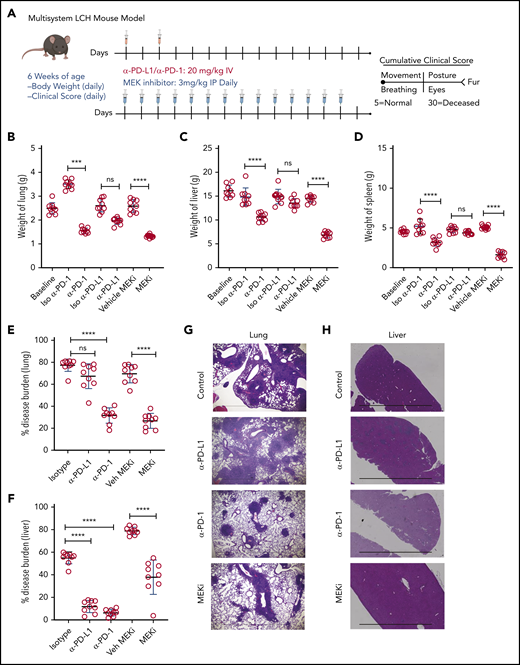
Treatment with a MEK inhibitor or anti-PD-1 antibody decreases disease burden in a mouse model of LCH. (A) Treatment and evaluation schema for intervention with PD-L1 or PD-1 blocking antibodies and anti-MEKi. (B-D) Organ weight of lung (B), liver (C), and spleen (D) from BRAFV600ECD11c mice treated with MEKi, vehicle control, isotype control, anti-PD-L1, or anti-PD-1. Data are the mean ± SD. ***P < .001, ****P < .0001, ns, not significant (P > .05), by WMW test. (E, F) Disease burden significantly decreased in lung (E) and liver (F) of BRAFV600ECD11c mice treated with MEKi or anti-PD-1, but not anti-PD-L1 antibody, compared with isotype control. Data are the mean ± SD. ***P < .001, ****P < .0001, ns, not significant (P > .05), by 1-way ANOVA with Tukey’s post hoc test. (G, H) Hematoxylin and eosin–stained lung (G) and liver (H) specimens from BRAFV600ECD11c mice after treatment with MEKi or anti-PD-1, but not anti-PD-L1, compared with the corresponding isotype control groups. Bars represent 100 µm. For panels B-F, n = 9 mice per group.
Treatment with a MEK inhibitor or anti-PD-1 antibody decreases disease burden in a mouse model of LCH. (A) Treatment and evaluation schema for intervention with PD-L1 or PD-1 blocking antibodies and anti-MEKi. (B-D) Organ weight of lung (B), liver (C), and spleen (D) from BRAFV600ECD11c mice treated with MEKi, vehicle control, isotype control, anti-PD-L1, or anti-PD-1. Data are the mean ± SD. ***P < .001, ****P < .0001, ns, not significant (P > .05), by WMW test. (E, F) Disease burden significantly decreased in lung (E) and liver (F) of BRAFV600ECD11c mice treated with MEKi or anti-PD-1, but not anti-PD-L1 antibody, compared with isotype control. Data are the mean ± SD. ***P < .001, ****P < .0001, ns, not significant (P > .05), by 1-way ANOVA with Tukey’s post hoc test. (G, H) Hematoxylin and eosin–stained lung (G) and liver (H) specimens from BRAFV600ECD11c mice after treatment with MEKi or anti-PD-1, but not anti-PD-L1, compared with the corresponding isotype control groups. Bars represent 100 µm. For panels B-F, n = 9 mice per group.
Given that universal ERK activation is observed in patients with LCH and pharmacological MAPK inhibition restored migration and apoptosis potential in a mouse model of LCH,26 2 groups of BRAFV600ECD11c mice were also treated with either the MAPK pathway inhibitor (MEKi, trametinib; Selleckchem, Houston, TX) or vehicle control (Figure 5A). Treatment with MEKi significantly decreased gross organ weight (Figure 5B-D), disease burden (Figure 5E-F), histiocytic infiltration of alveoli and peribronchiolar stroma in the lungs (Figure 5G), and sinusoidal distension and periportal cellular infiltration in the liver (Figure 5H). No difference in clinical score was observed among the different treatments (MEKi, anti-PD-L1, and anti-PD-1) groups (data not shown).
Analysis of the bulk lung lesions with the FlowSOM algorithm revealed that, compared with the isotype treatment, monotherapy with anti-PD-1 antibody significantly decreased infiltration of lymphoid cells while having a nominal effect on the myeloid compartment (Figure 6A-B). Monotherapy with anti-PD-L1 antibody did not decrease either the myeloid or lymphoid compartments (Figure 6C-D). On the other hand, MEKi treatment decreased the myeloid CD11b+ population (myeloid DC precursors expressing BRAFV600E), but also resulted in an increased number of infiltrating CD4+ and CD8+ T cells (Figure 6E-F). Immunohistochemical analysis confirmed the CyTOF analysis in lungs (Figure 6G-H) and liver (supplemental Figure 5A-B). Collectively, these results indicate that an optimal outcome is not achieved with monotherapy with immune checkpoint inhibitor(s) or MEKi.
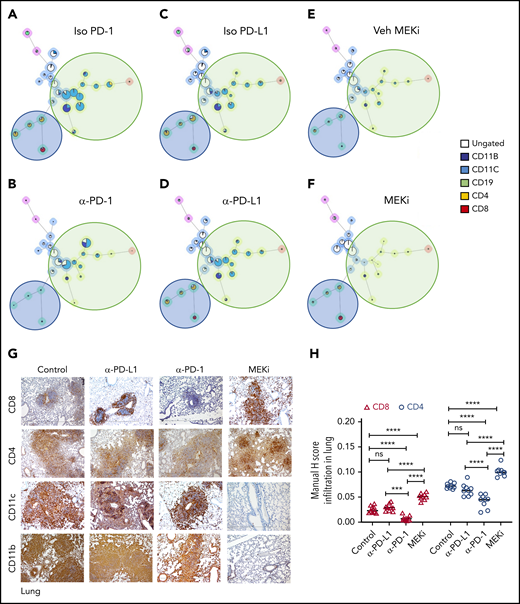
Distinct effect of MEKi and anti-PD-1 on myeloid lesional cells and intralesional lymphoid cells. (A-F) FlowSOM analysis of representative lesion biopsy specimens from lung of BRAFV600ECD11c mice in the indicated experimental groups. Green circle, myeloid compartment; blue circle, lymphoid compartment. (G) Representative immunohistochemistry images of infiltrating T cells (CD8+ and CD4+), and DCs (CD11b+ and CD11c+) in lungs of the different experimental groups. Bars represent 100 µm. (H) Quantification of lesion infiltrating CD8+ and CD4+ T cells in the indicated experimental groups. Data are the means ± SD (n = 9 mice per group); ***P < .001; ****P < .0001; ns, not significant (P > .05), by 1-way ANOVA with Tukey’s post hoc test.
Distinct effect of MEKi and anti-PD-1 on myeloid lesional cells and intralesional lymphoid cells. (A-F) FlowSOM analysis of representative lesion biopsy specimens from lung of BRAFV600ECD11c mice in the indicated experimental groups. Green circle, myeloid compartment; blue circle, lymphoid compartment. (G) Representative immunohistochemistry images of infiltrating T cells (CD8+ and CD4+), and DCs (CD11b+ and CD11c+) in lungs of the different experimental groups. Bars represent 100 µm. (H) Quantification of lesion infiltrating CD8+ and CD4+ T cells in the indicated experimental groups. Data are the means ± SD (n = 9 mice per group); ***P < .001; ****P < .0001; ns, not significant (P > .05), by 1-way ANOVA with Tukey’s post hoc test.
Combined targeted therapy using MEKi and immunotherapy using anti-PD-1 are clinically synergistic in the LCH mouse model
Given our observations with MAPK inhibitor alone or anti-PD-L1 and anti-PD-1 monotherapies, we tested whether concomitant targeted immunotherapy with anti-PD-1 or anti-PD-L1 and inhibition of MAPK activation would improve clinical outcomes (Figure 7A). Combination of MEKi with anti-PD-1, but not with anti-PD-L1, had a synergetic effect on decreasing organ weight (Figure 7B-D) and disease burden in lung (Figure 7E,G) and liver (Figure 7F-G). No difference in clinical score was observed among the different combination groups (data not shown). In comparison to vehicle or combined MEKi and anti-PD-L1 therapy, combined MEKi and anti-PD-1 therapy significantly reduced infiltration of CD8+ and CD4+ T cells in lung (Figure 7H-J, top; supplemental Figure 6A-B) and liver lesions (supplemental Figure 6C- D), as well as tissue LCH DC accumulation (Figure 7H-J; bottom; supplemental Figure 6A,C). In addition, the combined MEKi and anti-PD-1 therapy significantly decreased the abundance of PD-1–expressing CD8+ T cells (supplemental Figure 7A-D) and PD-L1 expression by lesional CD11c+ cells (supplemental Figure 7E) and restored the function of the lesion-infiltrating CD8+ cells, as assessed by expression of Tc1/Tc2 cytokines (supplemental Figure 8). Collectively, these results indicate that immune checkpoint inhibitor therapy with anti-PD-1 enhances clinical responses to inhibition of the MAPK pathway.
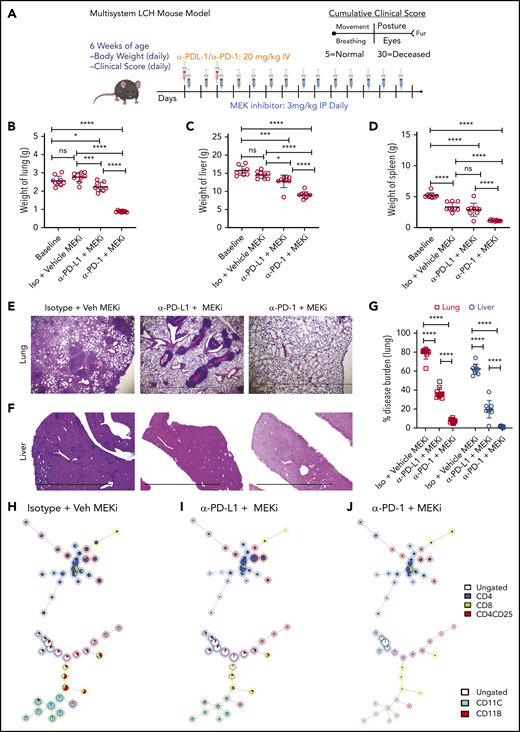
Synergistic effect on disease outcome in a preclinical LCH model with combined PD-1 blockade and targeted MAPK inhibition. (A) Treatment and evaluation schema for intervention with anti-MEKi, -PD-L1, and/or -PD-1 blocking antibodies. (B-D) Organ weight of lung (B), liver (C), and spleen (D) from BRAFV600ECD11c mice treated with the different combinations indicated. (E, F) Hematoxylin and eosin–stained lung (E) and liver (F) specimens from BRAFV600ECD11c mice after the indicated treatment regimens compared with the corresponding control groups. The disease burden significantly decreased in lung and liver of BRAFV600ECD11c mice cotreated with MEKi and anti-PD-1 compared with the other regimens (G). (H-J) FlowSOM minimal spanning tree (MST) plots of lymphoid (top) and myeloid (bottom) cells from representative lesion biopsy specimens of lung of BRAFV600ECD11c mice in isotype+vehicle MEKi (H), anti-PD-L1+MEKi (I), and anti-PD-1+MEKi (J) groups. For panels B-D and G, data are the means ± SD (n = 9 mice per group). *P < .05; ***P < .001, ****P < .0001, ns, not significant (P > .05), by 1-way ANOVA with Tukey’s post hoc test.
Synergistic effect on disease outcome in a preclinical LCH model with combined PD-1 blockade and targeted MAPK inhibition. (A) Treatment and evaluation schema for intervention with anti-MEKi, -PD-L1, and/or -PD-1 blocking antibodies. (B-D) Organ weight of lung (B), liver (C), and spleen (D) from BRAFV600ECD11c mice treated with the different combinations indicated. (E, F) Hematoxylin and eosin–stained lung (E) and liver (F) specimens from BRAFV600ECD11c mice after the indicated treatment regimens compared with the corresponding control groups. The disease burden significantly decreased in lung and liver of BRAFV600ECD11c mice cotreated with MEKi and anti-PD-1 compared with the other regimens (G). (H-J) FlowSOM minimal spanning tree (MST) plots of lymphoid (top) and myeloid (bottom) cells from representative lesion biopsy specimens of lung of BRAFV600ECD11c mice in isotype+vehicle MEKi (H), anti-PD-L1+MEKi (I), and anti-PD-1+MEKi (J) groups. For panels B-D and G, data are the means ± SD (n = 9 mice per group). *P < .05; ***P < .001, ****P < .0001, ns, not significant (P > .05), by 1-way ANOVA with Tukey’s post hoc test.
Discussion
Current therapies for LCH are based on empiric chemotherapy, curing <50% of patients treated with front-line standard-of-care vinblastine/prednisone. Optimal salvage therapies have not been defined, and failure of treatment is associated with increased risks of morbidity and mortality. Much of the research focus on LCH in the past decade has been on origins and genetic alterations of the pathologic LCs, which constitute a minority population in the LCH lesion. This study focused on characterizing the composition and functional capacity of the immune infiltrate to enhance understanding of pathogenic mechanisms of LCH and to identify novel therapeutic opportunities.
Previous studies have described a lymphocyte-rich microenvironment in LCH lesions with an abundance of T cells and regulatory Th cells.6,8,10-12 However, the function of these tumor-infiltrating lymphocytes and their contribution to pathogenesis is not known. In this study, LCH lesional CD207+ cells had high expression of PD-L1 and the lesion-infiltrating T cells in human and mouse models of LCH expressed excess checkpoint inhibitor proteins and signaling molecules that inhibited T-cell function and negatively regulated normal T-cell responses. Indeed, the infiltrating CD8+ T cells in LCH lesions were dysfunctional. This study provides preclinical evidence of a synergistic effect of MAPK inhibition and PD-1 blockade on LCH disease outcome and support a novel immunotherapeutic strategy for the treatment of LCH. However, it remains to be determined in future studies whether the lesion-infiltrating T cells in LCH are truly tumor reactive or merely bystanders. T cells may contribute to LCH pathogenesis, either through direct tissue damage or through modulation of the survival and function of BRAFV600E DCs or other myeloid cells that accumulate in LCH lesions and further promote tissue damage. In addition, the mechanisms underlying recruitment, activation, and expansion of T cells in LCH and how each of these is affected by the constitutive MAPK activation observed in the pathogenic CD207+ DCs have to be defined.
The mechanisms of Treg-mediated immune suppression and checkpoint regulation in LCH may be distinct from cancer paradigms such as melanoma where tumor-directed lymphocytes are held at bay. This dissimilarity between LCH and other neoplastic disorders may be caused by their vast differences in mutational load and/or neoantigens, as well as the intrinsic nature of LCH cells.4 In the case of LCH, the pathogenic myeloid cells with unopposed MAPK activation differentiate with features of a professional antigen-presenting cell.37 The interactions between T cells and pathogenic DCs may therefore reflect distinct mechanisms of immune cell dysregulation. LCH is a unique neoplastic disorder, as the pathologic CD207+ cell has features of a professional antigen-presenting cell. Naive (CD8+) T cells require antigen binding by their T-cell receptor and costimulatory signals for activation. LCH lesional cells express the costimulatory receptors CD40,38-40 CD80,39,41,42 ICOS ligand,10 and CD86.39,40 LCH cells express similar levels of CD40, CD80, and CD86 messenger RNA, when compared with normal epidermal CD207+ LCs,43,44 and confer high expression of genes that are relevant to antigen presentation (including CD1E) and genes encoding members of the HLA complex.45 Cumulatively, this finding suggests that LCH lesional DCs should impact T-cell responses. In fact, the results of this study show that the lesion-infiltrating T cells were exhausted and dysfunctional. It is plausible that the infiltrating T cells are exhausted by prolonged exposure to antigenic stimulation within the LCH lesion. However, alternate mechanisms such as an immunosuppressive cytokine environment6,9-13,46 potentiated by the high number of lesion-infiltrating MDSCs and Tregs, as we observed, may also lead to exhausted T cells.
Clinical trials for PD-1 and PD-L1 blockade for patients with advanced melanoma and Hodgkin’s lymphoma have demonstrated consistent therapeutic responses.47-50 We have shown in previous studies that, in the absence of augmented proliferation, constitutive ERK activation results in accumulation and persistence of pathological DCs by downregulating expression of CCR7, effectively trapping the DCs at the site of disease, recruiting activated T cells, and together producing mediators of inflammation and tissue destruction.6,26 In this study, treatment of BRAFV600ECD11c mice with anti-PD-1 decreased the number of infiltrating T cells. Nevertheless, the CD11c+BRAFV600E+ DC population was not substantially altered, even though overall lesion size significantly decreased. This result suggests that the PD-L1/PD-1 interaction plays a role in the accumulation and activation of T cells that contribute to local and systemic pathologic inflammation. However, these results are less consistent with restoration of CD8+ T cell antitumor (eg, anti-CD11c+ DC) activity.
Single-agent MAPK inhibition studies in early phase studies in adults with LCH and related disorders have yielded nearly universal clinical responses.18-20,22,23,51 However, the potential for a durable “cure” is uncertain, as many patients have improved but persistent disease, and relapse almost always occurs after cessation of therapy.24 In this study, MEK inhibition decreased the myeloid compartment but resulted in an increase of CD8+ T cells. Although not an expected result, this phenomenon has been observed in other tumors. In pancreatic cancer, depletion of MDSC or macrophage subsets results in increased infiltration and activation of CD8+ T cells.52 In this context, it was reported that myeloid cells regulate expression of PD-L1 in tumor cells that then suppress antitumor immune responses mediated by CD8+ cells and that treatment with MAPK inhibitors lowered the intratumoral expression of PD-L1, rendering the tumor susceptible to PD-1 blockade. Observations from this study support the potential for MAPK activation in LCH DCs, inducing expression of PD-L1. Therefore, in addition to affecting LCH DC migration and survival,26 MEK inhibition may enhance CD8+ T-cell function. This may be because of the increased transcription of genes involved in cellular activation and inflammatory cytokine production, as has been shown after a single cycle of combined checkpoint blockade in melanoma.53
The past decade has elucidated the broad strokes of LCH pathogenesis: MAPK activation in differentiating myeloid precursors. However, the mechanisms that regulate recruitment, retention, and activation of immune cells to lesions are not known, and the role of inflammation in pathogenesis is undefined. To identify optimal curative therapies for patients with LCH, various strategies may first have to be tested in preclinical models to prioritize for testing in clinical trials. The results of the present study provide novel insights into the character and function of lesion-infiltrating T cells in LCH. Given that neither character and function of lesion-infiltrating T cells in LCH nor MEK inhibition is dependent on MAPK pathway mutations,18 the synergistic impact of combined MEK inhibition and checkpoint blockade represent a novel therapeutic strategy that merits clinical development. The findings of this study demonstrate the effect of checkpoint inhibition against LCH, supporting further investigation to refine optimal agents, dosing, and combinations to be tested in clinical trials. The revised conceptualization of LCH as an inflammatory myeloid neoplastic disorder driven by pathologic MAPK activation in myeloid precursor cells coupled with the findings that combination therapy exerts a synergistic effect on disease outcome offers an opportunity to move treatment of LCH beyond empiricism to rational, risk-based strategies.
All data supporting the findings of this study that are not included in the manuscript are available upon request to the corresponding authors.
The online version of this article contains a data supplement.
The publication costs of this article were defrayed in part by page charge payment. Therefore, and solely to indicate this fact, this article is hereby marked “advertisement” in accordance with 18 USC section 1734.
Acknowledgments
The authors thank Jared K. Burks (The University of Texas Anderson Cancer Center Flow Cytometry Core) and Joel Sederstorm (Baylor College of Medicine Flow Cytometry Core) for help with CyTOF and flow cytometry, respectively, and the research coordinators of the Histio/Lymphoma team at Texas Children’s Cancer Center for help with patient sample collection. The TXCH (Texas Children’s Hospital) Histiocytosis Program is supported by a research grant from the HistioCure Foundation.
This work was supported by the Department of Defense through the Peer Reviewed Cancer Research Program under Award W81XWH-19-1-0167 (R.C.), National Institutes of Health (NIH), National Cancer Institute (NCI) grants R01 CA154489 (M.M., C.E.A.), CA154947 (M.M., C.E.A.), NIH Specialized Program of Research Excellence (SPORE) in Lymphoma, NCI grant P50CA126752 (C.E.A.); an Alex’s Lemonade Stand Foundation Young Investigator Grant (R.C.), the American Society of Hematology Scholar Award (R.C.), St. Baldrick’s Foundation Innovation Award (C.E.A), the Leukemia and Lymphoma Society Translational Research Program (C.E.A.), and Cookies for Kids Cancer (C.E.A). This study was a collaborative project with support from St. Baldrick’s Foundation, which sponsors the North American Consortium for Histiocytosis Research (M.M, K.L.M., C.E.A.).
Authorship
Contribution: A.S. performed most of the CyTOF and mouse experiments and analyzed the data; J.V., M.H., T.M.B., H.A., R.R., W.O., and B.S. performed experiments and analyzed the data; W.Y. evaluated and scored the mouse histology sections in a blinded fashion; O.S.E., C.B., C.M.B., M.M., and K.L.M. contributed to the study design; R.C. conceived, designed, performed experiments, analyzed data, and wrote the manuscript; C.E.A. and R.C. supervised the project; and all authors reviewed the final manuscript.
Conflict-of-interest disclosure: The authors declare no competing financial interests.
Correspondence: Rikhia Chakraborty, Texas Medical Center, 1102 Bates St, Ste 1025.21, Houston, TX 77030; e-mail: rxchakra@txch.org; and Carl E. Allen, Texas Medical Center, 1102 Bates St, Ste 1025.21, Houston, TX 77030; e-mail: ceallen@txch.org.
