

Key Points
The mutational landscape of GZL in the thymic niche resembles that of EBV− cHL and PMBCL, suggesting a shared cell of origin.
GZLs occurring outside of the thymic niche have a distinct mutational profile, with a subset of cases carrying TP53 and BCL2 mutations.

Abstract
The mutational landscape of gray zone lymphoma (GZL) has not yet been established, and differences from related entities are largely unknown. Here, we studied coding sequence mutations of 50 Epstein-Barr virus (EBV)-negative GZLs and 20 polymorphic EBV+ diffuse large B-cell lymphoma (DLBCL) not otherwise specified (poly-EBV-L) in comparison with classical Hodgkin lymphoma (cHL), primary mediastinal large B-cell lymphoma (PMBCL), and DLBCL. Exomes of 21 GZL and 7 poly-EBV-L cases, along with paired constitutional DNA, were analyzed as a discovery cohort, followed by targeted sequencing of 217 genes in an extension cohort of 29 GZL and 13 poly-EBV-L cases. GZL cases with thymic niche involvement (anterior mediastinal mass) exhibited a mutation profile closely resembling cHL and PMBCL, with SOCS1 (45%), B2M (45%), TNFAIP3 (35%), GNA13 (35%), LRRN3 (32%), and NFKBIA (29%) being the most recurrently mutated genes. In contrast, GZL cases without thymic niche involvement (n = 18) had a significantly distinct pattern that was enriched in mutations related to apoptosis defects (TP53 [39%], BCL2 [28%], BIRC6 [22%]) and depleted in GNA13, XPO1, or NF-κB signaling pathway mutations (TNFAIP3, NFKBIE, IKBKB, NFKBIA). They also exhibited more BCL2/BCL6 rearrangements compared with thymic GZL. Poly-EBV-L cases presented a distinct mutational profile, including STAT3 mutations and a significantly lower coding mutation load in comparison with EBV− GZL. Our study highlights characteristic mutational patterns in GZL associated with presentation in the thymic niche, suggesting a common cell of origin and disease evolution overlapping with related anterior mediastinal lymphomas.
Introduction
Gray zone lymphoma (GZL) is a rare entity defined as B-cell lymphoma with features intermediate between large B-cell lymphoma (LBCL) and classical Hodgkin lymphoma (cHL). Although pathological features have been characterized extensively,1-3 only a limited number of studies on molecular characteristics have been published in comparison with entities related to GZL. Indeed, several groups1,4-7 have reported on the incidence of specific chromosomal aberrations, such as 9p24 gain/amplification (gain/amp) or rearrangement, 16p rearrangement, and 2p16 gain/amp. A large-scale DNA methylation analysis8 described a distinct epigenetic profile intermediate between cHL and primary mediastinal large B-cell lymphoma (PMBCL) that was different from diffuse large B-cell lymphoma (DLBCL). Recently, using gene expression analysis (GEA), we9 and other investigators10 reported on the predominance of macrophages in the tumor microenvironment (TME) of GZL. Furthermore, it was confirmed that GZLs could be dichotomized into 2 molecular subtypes (ie, “PMBCL-like” GZL and “DLBCL-like” GZL) that strongly associated with the presence or absence of anterior mediastinal–thymic niche involvement.9 Moreover, cases with cHL-like morphology and preserved expression of B-cell markers had a gene expression signature and microenvironment features that favored their inclusion in the GZL spectrum.9 However, to complete the molecular characterization of GZL, a detailed analysis of its mutational landscape and correlation with cHL, PMBCL, and DLBCL is warranted.
Polymorphic Epstein-Barr virus (EBV)+ DLBCL not otherwise specified (poly-EBV-L) possesses histological features overlapping with cHL and GZL,3,11,12 with a variable number of large transformed cells/immunoblasts and Hodgkin/Reed-Sternberg–like cells in a variable mixture of reactive cell types. However, our recent study9 showed that poly-EBV-L can be clearly distinguished from EBV− GZL by GEA highlighting similar distinctions seen in other B-cell lymphomas13,14 based on latent EBV infection status (ie, a specific TME and interferon-γ signature). As with GZL, the mutational landscape of poly-EBV-L has not been described, whereas only some mutational data on monomorphic EBV+ DLBCL cases are available.15,16
To complete the molecular characterization of GZL and poly-EBV-L, we performed exome sequencing analysis, followed by targeted sequencing of an extension cohort in comparison with related entities. Within GZL cases, we highlight a distinct mutational profile based on the presence of thymic involvement, with a landscape closely resembling cHL and PMBCL for thymic cases and enrichment of TP53, BCL2, and CREBBP mutations in nonthymic cases. Poly-EBV-L cases also presented a unique mutational profile with correlation to thymic vs nonthymic involvement.
Methods
Case selection and study flow chart
GZL (all EBV−) and poly-EBV-L cases were centrally reviewed by a panel of experts, as reported.1 As previously described, GZL is part of a spectrum from group 0 (morphology suggesting cHL with preservation of the B-cell program on all tumor cells) to GZL with a more intermediate morphology and discordant phenotype (group 1 with a more cHL-like morphology with sheets of large CD20+ cells and predominant TME; group 2 with more sheets of large CD30+ cells [LBCL-like morphology] in a less predominant TME) (Figure 1; supplemental Methods, available on the Blood Web site). Among the 109 cases initially identified (76 GZL and 33 poly-EBV-L), fresh-frozen tissue (FFT) was available for 29 cases (22 GZL and 7 poly-EBV-L); it was submitted for laser microdissection (LMD) to enrich for tumor cells and extract normal DNA for paired exome analysis (“discovery cohort”; for details on LMD and nucleic acid extraction, see supplemental Methods). Among the 80 samples with available formalin-fixed paraffin-embedded (FFPE) tissue initially selected for the extension cohort, 27 were excluded because of low tumor content (<10%) and/or insufficient DNA to perform library construction.
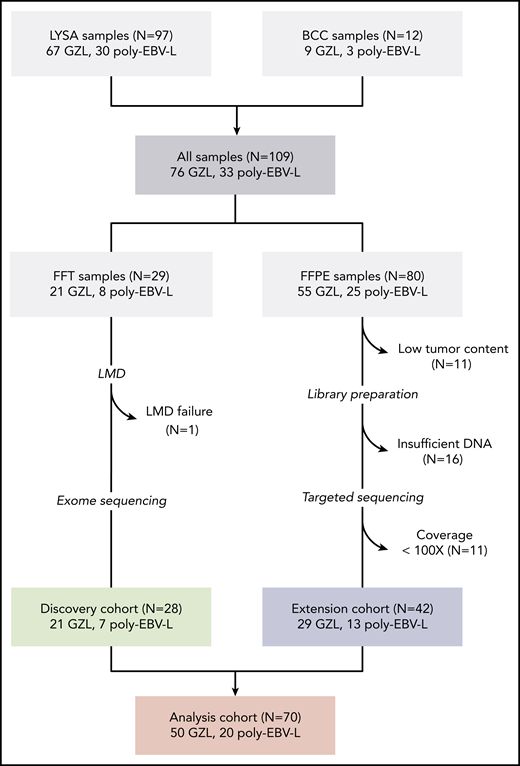
Flow chart of patient inclusion. Cases were centrally reviewed by a panel of LYSA and BC Cancer experts in hematopathology and medical oncology. Inclusion criteria for the GZL cases were based on World Health Organization classification; cases with a cHL-like morphology with strong and diffuse CD20 expression and other B-cell markers were also included (supplemental Methods). Cases with Epstein–Barr virus-encoded small RNAs (EBER) in situ hybridization positivity in >90% of tumor cells were diagnosed as poly-EBV-L. A total of 109 samples were collected, including 29 FFT biopsies submitted for laser microdissection (LMD) (“discovery cohort”) and 80 FFPE samples, of which 53 could be sequenced with a capture target panel of 217 genes (“extension cohort”). Eleven cases with coverage <100× were excluded to reduce false negative results related to low coverage.
Flow chart of patient inclusion. Cases were centrally reviewed by a panel of LYSA and BC Cancer experts in hematopathology and medical oncology. Inclusion criteria for the GZL cases were based on World Health Organization classification; cases with a cHL-like morphology with strong and diffuse CD20 expression and other B-cell markers were also included (supplemental Methods). Cases with Epstein–Barr virus-encoded small RNAs (EBER) in situ hybridization positivity in >90% of tumor cells were diagnosed as poly-EBV-L. A total of 109 samples were collected, including 29 FFT biopsies submitted for laser microdissection (LMD) (“discovery cohort”) and 80 FFPE samples, of which 53 could be sequenced with a capture target panel of 217 genes (“extension cohort”). Eleven cases with coverage <100× were excluded to reduce false negative results related to low coverage.
Capture sequencing and bioinformatics analysis
For the discovery (exome) and extension (target panel) cohorts, capture-based library construction and Illumina paired-end sequencing were applied. All reads were aligned to the human reference genome (hg19) using BWA-MEM.17 Paired variant calling was performed on all tumor-normal or tumor-pooled normal pairs to detect somatic single nucleotide variations and indels (<50 bp) using MuTect,18 Strelka,19 and VarScan.20 For the extension cohort, a capture panel of 217 genes was used, designed based on the results of the discovery analysis and the literature21-30 (supplemental Figure 2). Eleven cases were excluded because of low coverage (<100×) (Figure 1). Copy number alterations were predicted using CNVkit31 and analyzed for significance with GISTIC.32 In the exomes, a list of significantly mutated genes was identified using MutSigCV,33 and included in the capture panel, in conjunction with data from the literature. See supplemental Methods for more details.
Statistical analysis
The incidence of mutations across cohorts was assessed using Fisher’s exact test, followed by false discovery rate (FDR) correction. As a comparator, we used the coding-mutation incidence for genes of interest, as reported in a PMBCL cohort (N = 94)22 and 2 cHL publications (EBV− samples only: Tiacci et al23 [N = 30] and Reichel et al24 [N = 9]).
Disease-specific survival (DSS) and time to progression (TTP) were estimated using Kaplan-Meier curves and compared between groups using log-rank tests and a multivariate Cox regression model (see supplemental Methods for details).
Institutional Review Board approval was granted (Lymphoma Study Association [LYSA]: 2017-0006B, University of British Columbia/British Columbia Cancer: H18-01460), and the study was conducted according to the Declaration of Helsinki.
Results
Clinical characteristics
Across 50 GZL patients with mutation data, the median age was 46 years (range, 14-90), the female/male (F/M) ratio was 1, 63% (n = 31) had anterior mediastinal involvement (referred to as “thymic”), and 48% had Ann Arbor advanced-stage (stage 3/4) disease. Eight cases were classified as group 0, and 42 cases were classified as GZL with intermediate morphology (group 1 [n = 19] and group 2 [n = 23]). Patients with thymic GZL were younger and more frequently had localized bulky disease (supplemental Table 2) compared with nonthymic cases, whose disease occurred more often at extranodal sites. Discovery (n = 21) and extension cohorts (n = 29) had comparable characteristics (Table 1) as did GZL patients with (n = 50) and without (n = 26) mutation data (supplemental Table 1), and there were no differences between included and excluded GZL patients. Among the 20 poly-EBV-L patients, the median age was slightly higher than for those with GZL (55 years, P = .1), the F/M ratio was 0.3, and 5 cases (31%) had thymic involvement (Table 1) (significantly fewer than GZL; P = .02).
GZL and poly-EBV-L clinical characteristics at diagnosis
| Characteristics | GZL all (N = 50) | GZL exome (n = 21) | GZL target (n = 29) | P* (exome vs target) | Poly-EBV-L (n = 20) |
|---|---|---|---|---|---|
| Center | LYSA: n = 44 | LYSA: n = 19 | LYSA: n = 25 | .68 | LYSA: n = 19 |
| BCC: n = 6 | BCC: n = 2 | BCC: n = 4 | BCC: n = 1 | ||
| Age, mean (range), y | 46 (14-90) | (14-76) | (20-90) | .17 | 55 (16-84) |
| Aγε ≥60 y | 14 (28) | 4 (19) | 10 (34) | 8 (40) | |
| F/M, n/n | 25/25 | 13/8 | 12/17 | .15 | 6/14 |
| GZL classification | .95 | Not applicable | |||
| 0 | 8 (16) | 3 (14) | 5 (17) | ||
| 1 | 19 (38) | 8 (38) | 11 (38) | ||
| 2 | 23 (46) | 10 (48) | 13 (45) | ||
| Mediastinal involvement | .3 | ||||
| Thymic | 31 (63) | 15 (71) | 16 (57) | 5 (28) | |
| Nonthymic | 18 (37) | 6 (29) | 12 (43) | 13 (72) | |
| Med-nonthymic | 7 (14) | 2 (10) | 5 (18) | 0 (0) | |
| Nonmediastinal | 11 (23) | 4 (23) | 7 (25) | 13 (72) | |
| NA | 1 | 0 | 1 | 2 | |
| Ann Arbor stage | n = 46 | n = 21 | n = 25 | .23 | n = 16 |
| 1-2 | 24 (52) | 13 (62) | 11 (44) | 7 (44) | |
| 3-4 | 22 (48) | 8 (38) | 14 (56) | 9 (56) | |
| Extranodal site | 19/46 (41) | 6/19 (32) | 13/25 (52) | .17 | 5/16 (31) |
| Spleen | 5 (26)† | 3 † | 3 † | 4 (80)† | |
| Liver | 3 (16)† | 1 † | 2 † | 4 (80)† | |
| Lung | 7 (37)† | 3 † | 4 † | 2 † | |
| Bone marrow | 9 (47)† | 3 † | 6 † | 1 † | |
| LDH above upper limit of normal | 26/46 (59) | 10/20 (50) | 16/24 (67) | .26 | 7/16 (44) |
| Age-adjusted IPI | n = 44 | n = 20 | n = 24 | n = 16 | |
| 0-1 | 26 (61) | 15 (75) | 11 (46) | .06 | 8 (50) |
| 2-3 | 18 (39) | 5 (25) | 13 (54) | 8 (50) |
Unless otherwise noted, data are n (%).
BCC, British Columbia Cancer; IPI, International Prognostic Index; LDH, lactate dehydrogenase; Med, mediastinal; NA, not available.
χ2 test.
Percentage of involved sites.
Mutational landscape of GZL and poly-EBV-L
Among the 28 tumor-normal pairs (21 GZL, 7 poly-EBV-L), the mean coverage of tumor DNA was 96× (42-203×); for normal DNA, it was 76× (13-144×) (supplemental Figure 3). A total of 6499 variants were identified, including 3060 coding, 2735 3′ untranslated region, and 704 5′ untranslated region variants (supplemental Figure 4A), with a mean of 232 (range, 28-2080) and 109 (range, 15-678) total and coding variants per sample, respectively. The overall mutation load in the exome capture space for the GZL cases was 3 mutations per megabase pair, which was significantly greater than for poly-EBV-L cases (1.9 mutations per megabase pair; P = .001). Concordantly, poly-EBV-L cases had fewer coding variants compared with GZL cases (mean, 52 vs 128, P = .03; coverage 75× vs 101×; supplemental Figure 4B-C). We then applied MutSigCV, a tool to identify significantly mutated genes; it revealed 64 candidate oncodriver genes that were mutated in ≥2 cases across GZL and poly-EBV-L cases (P < .05; supplemental Table 3). To comprehensively describe the mutational landscape of GZL, we defined our targeted sequencing panel to include MutSigCV candidates mutated in ≥2 cases, genes mutated in ≥3 exome cases, and genes reported in the literature21-30 as being potential oncodrivers in the related entities of PMBCL, cHL, or DLBCL (supplemental Figure 2).
The mean coverage of the extension cohort (GZL, n = 29; poly-EBV-L, n = 13) was 503× (106-1124×). Within the 217 panel genes, the mean number of coding mutations per case was not different between the discovery and extension cohorts (13.3 vs 11.5, P = .54) (supplemental Figure 6). For 10 FFT cases sequenced in exome and target experiments, 90% of single nucleotide/indel variants were shared, with a linear relationship between variant allele frequencies (P < .0001) (supplemental Figure 5). Of note, in the extension cohort, 2 FFPE LMD samples were included (mean coverage of 50× and 76×) with a variant count (n = 9 each) comparable to that of FFT samples.
Of the 50 GZL cases, 49 had ≥1 coding mutation within the 217 panel genes (mean number of mutated genes per case, 10.7; range, 0-36). The most recurrently mutated genes were SOCS1 (40%), B2M (32%), GNA13 (24%), NFKBIA (22%), TNFAIP3 (20%), LRRN3 (20%), TP53 (18%), and ITPKB, STAT6, NFKBIE, XPO1, KMT2C, and SPEN (16% each) (Figure 2A), with similar frequencies across the discovery and extension cohorts (supplemental Figure 7; supplemental Table 4A) and no significant differences between cohorts after FDR correction. Interestingly, AID motif signature analysis revealed that, among the 217 genes, SOCS1 was significantly enriched in mutations affecting the target guanine-cytosine base pair of AICDA recognition sites (RGYW) (q < 0.001), suggesting a role for aberrant somatic hypermutation.
![Mutational landscape of GZL. (A) Oncoplot of the most recurrently mutated genes within the 50 GZL samples, with clinical annotation [(Ant_Med: anterior mediastinal involvement, pathological group (Path_Class)]. (B) Pairwise (Fisher’s exact test) comparison of the incidence of mutations within group 0, also know as GZL with a cHL morphology and expression of B-cell markers on all tumor cells, vs group 1 and group 2 GZL. The size of the bubble is inversely correlated to the P value. Full analysis and FDR testing are provided in supplemental Table 4. (C) Pairwise (Fisher’s exact test) comparison of the incidence of mutations within group 1, cHL-like GZL, vs group 2, LBCL-like GZL. The size of the bubble is inversely correlated to the P value. Full analysis and FDR testing are provided in supplemental Table 4. After FDR correction, for the 17 genes mutated in >20% of group 1 or group 2 cases, no mutations were significantly enriched in group 1 or 2. (D) GISTIC plot highlighting the main copy number variation in GZL. Data were obtained within the 21 exome cases and showed that the main gain/amp was in the 9p24.1 locus, with 81% of the cases affected.](https://ash.silverchair-cdn.com/ash/content_public/journal/blood/137/13/10.1182_blood.2020007507/1/m_bloodbld2020007507f2.png?Expires=1767712719&Signature=P2bLPjwKfK7D55HuIBgfBg3GHYgjDcotGjA7fM433oMACB8QKyn3o5APADqs0WeYNgAnP6jKYZH52LL05Wx-ZBg-iiFIFFO7OV9W7~IwuQ0cjF-POwsoKew-Kj9OO9BSuRbkxjXXviWZldQ78zi--4oPqbyUR4Ad7mN0xtDX8mXHmc1iH8gstlOBc5lDauIOlFSYaX9HYyo4F5RyukuEWi9D8s0t7yufkctyhn63kYBOs4J~OoN87KqTBTq8HbN3ZfMZ26B06vKuBlHgxTzkcajSYIJwiVKEKA41fSXhHqMDXlkQ~ERCGN50XjbVJbXptxiU-Hvn~uHwvzb3U1ndNQ__&Key-Pair-Id=APKAIE5G5CRDK6RD3PGA)
Mutational landscape of GZL. (A) Oncoplot of the most recurrently mutated genes within the 50 GZL samples, with clinical annotation [(Ant_Med: anterior mediastinal involvement, pathological group (Path_Class)]. (B) Pairwise (Fisher’s exact test) comparison of the incidence of mutations within group 0, also know as GZL with a cHL morphology and expression of B-cell markers on all tumor cells, vs group 1 and group 2 GZL. The size of the bubble is inversely correlated to the P value. Full analysis and FDR testing are provided in supplemental Table 4. (C) Pairwise (Fisher’s exact test) comparison of the incidence of mutations within group 1, cHL-like GZL, vs group 2, LBCL-like GZL. The size of the bubble is inversely correlated to the P value. Full analysis and FDR testing are provided in supplemental Table 4. After FDR correction, for the 17 genes mutated in >20% of group 1 or group 2 cases, no mutations were significantly enriched in group 1 or 2. (D) GISTIC plot highlighting the main copy number variation in GZL. Data were obtained within the 21 exome cases and showed that the main gain/amp was in the 9p24.1 locus, with 81% of the cases affected.
Mutational landscape of GZL. (A) Oncoplot of the most recurrently mutated genes within the 50 GZL samples, with clinical annotation [(Ant_Med: anterior mediastinal involvement, pathological group (Path_Class)]. (B) Pairwise (Fisher’s exact test) comparison of the incidence of mutations within group 0, also know as GZL with a cHL morphology and expression of B-cell markers on all tumor cells, vs group 1 and group 2 GZL. The size of the bubble is inversely correlated to the P value. Full analysis and FDR testing are provided in supplemental Table 4. (C) Pairwise (Fisher’s exact test) comparison of the incidence of mutations within group 1, cHL-like GZL, vs group 2, LBCL-like GZL. The size of the bubble is inversely correlated to the P value. Full analysis and FDR testing are provided in supplemental Table 4. After FDR correction, for the 17 genes mutated in >20% of group 1 or group 2 cases, no mutations were significantly enriched in group 1 or 2. (D) GISTIC plot highlighting the main copy number variation in GZL. Data were obtained within the 21 exome cases and showed that the main gain/amp was in the 9p24.1 locus, with 81% of the cases affected.
Mutations within the epigenetic modifiers KMT2C (16%, with a hotspot in A1685S), CREBBP (as reported in follicular lymphoma34 ), and HIST1H1E (14% each) were also recurrent, affecting 38% of the samples overall; CREBBP and KMT2C mutations were fully mutually exclusive. In contrast, very few GZL samples carried a mutation within members of the My-T-BCR35 pathway: CARD11 (n = 0), MYD88 (n = 1), or CD79B (n = 1). Within the apoptosis regulation pathway, TP53 and BCL2 mutations were significantly co-occurring (supplemental Figure 8A) and tended to be mutually exclusive, with mutations affecting TNFAIP3, B2M, NFKBIE, and NFKBIA; this revealed a split in the sample set that, interestingly, seemed to be associated with the presence of thymic niche involvement (supplemental Figure 8B).
We next looked at the mutations based on pathological classification. After FDR testing, the mutation landscape was not distinct between groups 1 and 2 GZL (n = 42) and group 0 (n = 8) (Figure 2B; supplemental Table 4B). Furthermore, the mutation pattern of group 2 was comparable to that of group 1 after FDR testing for the most recurrently mutated genes (Figure 2C).
Finally, within the 21 GZL exome cases, copy number alterations (CNAs) (Figure 2D) were assessed using CNVkit. To identify regions of significant gain or loss, GISTIC was applied; it revealed gains consistent with those in cHL and PMBCL, including 9p24.1 (JAK2 and PDL1-2; 84%), which was the most recurrent gain, followed by 5q13.2 (GTF2H2 and NAIP; 76%) and 2p16.1 (REL and BCL11A; 67%). The most frequent regions of loss affected 7q11.21, 1p36.32, 4p16.3, or 12q24.33 (NCOR2). Of note, 9p24.1 CNAs assessed by fluorescence in situ hybridization (FISH) were published previously for this cohort,9 without any observable differences between thymic and nonthymic cases.
Thymic niche involvement is an important determinant for gene mutational patterns
Within the exome cohort, thymic GZL had a greater mutational burden than nonthymic GZL (3.6 vs 1.25 mutations per megabase pair; P = .03; Figure 3A). Within the entire cohort, thymic GZL cases also had significantly more coding mutations (16.4 vs 8.3; P = .005) (Figure 3B). Importantly, the coding mutational landscape was different in thymic and nonthymic cases: TNFAIP3, LRRN3, B2M, GNA13, NFKBIE, ITPKB, and ZNF217 mutations were significantly enriched in thymic cases (referred to as “thymic mutations”) compared with TP53, BCL2, and CREBBP in nonthymic cases (Figure 3C; supplemental Table 4C); the results remained significant after FDR testing was applied for the most recurrently mutated genes (≥20% within each group, n = 14). By contrast, CNAs were not significantly different between thymic (n = 15) and nonthymic (n = 6) GZL cases (supplemental Figure 9), with the caveat of low numbers.
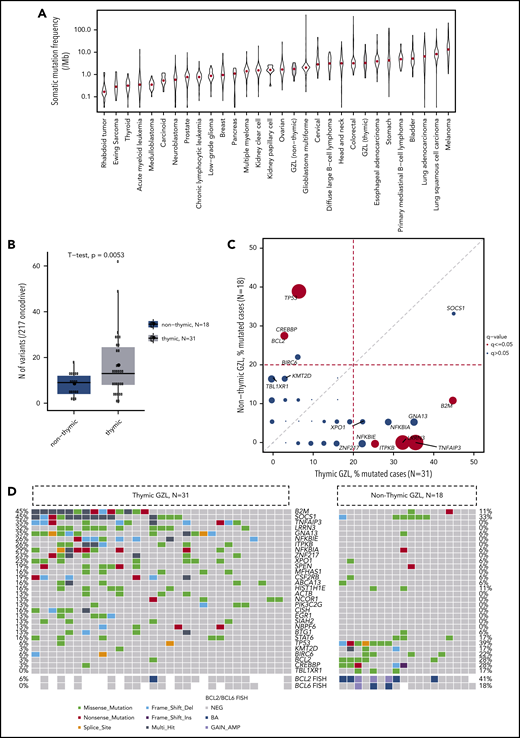
Mutational landscape by thymic vs nonthymic involvement. (A) Mutation burden in the exome capture space. Thymic GZL (n = 15) had a greater mutation burden than nonthymic GZL (n = 6). Data were generated using the Cancer Genome Atlas data set.33 (B) Coding mutation count within the 217 target genes. Thymic GZL (n = 31) had more coding mutations compared with nonthymic GZL (n = 18). (C) Pairwise comparison of incidence of mutations within thymic GZL vs nonthymic GZL. The comparison was done using Fisher’s exact test among the most recurrently mutated genes, between thymic and nonthymic cases. The size of the bubble is inversely correlated with the P value. Significant results after FDR correction (q < 0.05) are colored in red. Full analysis and FDR testing are provided in supplemental Table 4. (D) Co-oncoplot of the most recurrently mutated genes and BCL2/BCL6 FISH rearrangement status within thymic and nonthymic GZL. Thymic GZL was characterized by the presence of mutations typically seen in PMBCL/cHL and the absence of TP53/BCL2/BIRC6 or BCL2/BCL6 rearrangements in the majority of the samples. Within nonthymic cases, 6 of 18 cases are characterized by the presence of SOCS1/B2M variants, and 7 of 18 cases are characterized by TP53/BCL2/BIRC6. BCL2 and BCL6 rearrangements tended to be enriched in nonthymic GZL cases with TP53/BCL2 mutations. BA, break-apart; GAIN_AMP, gain or amplification; NEG, no FISH abnormality.
Mutational landscape by thymic vs nonthymic involvement. (A) Mutation burden in the exome capture space. Thymic GZL (n = 15) had a greater mutation burden than nonthymic GZL (n = 6). Data were generated using the Cancer Genome Atlas data set.33 (B) Coding mutation count within the 217 target genes. Thymic GZL (n = 31) had more coding mutations compared with nonthymic GZL (n = 18). (C) Pairwise comparison of incidence of mutations within thymic GZL vs nonthymic GZL. The comparison was done using Fisher’s exact test among the most recurrently mutated genes, between thymic and nonthymic cases. The size of the bubble is inversely correlated with the P value. Significant results after FDR correction (q < 0.05) are colored in red. Full analysis and FDR testing are provided in supplemental Table 4. (D) Co-oncoplot of the most recurrently mutated genes and BCL2/BCL6 FISH rearrangement status within thymic and nonthymic GZL. Thymic GZL was characterized by the presence of mutations typically seen in PMBCL/cHL and the absence of TP53/BCL2/BIRC6 or BCL2/BCL6 rearrangements in the majority of the samples. Within nonthymic cases, 6 of 18 cases are characterized by the presence of SOCS1/B2M variants, and 7 of 18 cases are characterized by TP53/BCL2/BIRC6. BCL2 and BCL6 rearrangements tended to be enriched in nonthymic GZL cases with TP53/BCL2 mutations. BA, break-apart; GAIN_AMP, gain or amplification; NEG, no FISH abnormality.
Within nonthymic cases, a split based on the presence of SOCS1 or TP53 mutations was observed (Figure 3D). Indeed, 7 samples had a SOCS1, STAT6, and/or B2M mutation, whereas 8 others presented apoptosis defect–related mutations (TP53, BCL2, or BIRC6). This split was not related to pathological classification, with a similar pathological group repartition among SOCS1- or TP53-mutated and wild-type cases (P = .4 and .5, respectively). Interestingly, the 6 SOCS1-mutated nonthymic cases were depleted in the co-occurring mutations found in SOCS1-mutated thymic GZL (TNFAIP3, ITPKB, or NFKBIA/E), whereas half carried CREBBP mutations. Finally, 5 of 6 (83%) nonthymic cases with SOCS1 mutations had a missense variant vs only 4 of 14 (29%) thymic cases (P = .02).
We next investigated BCL2 and BCL6 aberrations by FISH and found a higher incidence among nonthymic GZL than among thymic GZL (41% and 18% vs 6% and 0% of BCL2 and BCL6 aberrations, respectively; P = .01 and .2) (supplemental Table 5). Within nonthymic GZL, BCL2-mutated cases had a high incidence of BCL2 translocations (3/5 cases and 4 CNVs) and no BCL6 translocation. These findings are consistent with aberration patterns reported in DLBCL.36
Comparison with cHL, PMBCL, and DLBCL mutation landscapes
To further understand the distinctions between thymic and nonthymic GZL, we analyzed correlations with the related entities of PMBCL22 and cHL23,24 (Figure 4A). As shown in Figure 4B and C, the pattern of mutations observed in thymic GZL was very similar to cHL and PMBCL, without any significant differences after FDR testing for the most recurrently mutated genes (≥20% within each cohort). However, a few distinctions were noted: the incidence of NFKBIA mutations (non-sense/frameshift) within thymic GZL (29%) was higher compared with cHL (2.5%; P = .003) and PMBCL (12%; P = .04), and NBPF6 mutations were found in 13% of GZL cases (MutSigCV gene; P = .0008) but were not reported in cHL or PMBCL. On the other hand, mutations in IL4R, a gene recurrently mutated in PMBCL,37 but not in cHL, were significantly lower in thymic GZL (4%) vs PMBCL (32%; P = .0007).
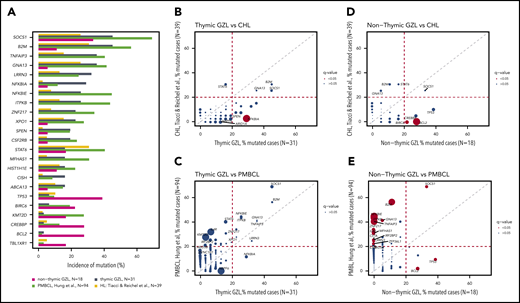
Comparison of GZL with pathologically related entities. (A) Bar plot showing the most recurrently affected genes within thymic and nonthymic GZL. The incidence of mutations in PMBCL and cHL is based on data from the literature. (B) Pairwise (Fisher’s exact test) comparison of the incidence of mutations within thymic GZL and cHL. The size of the bubble is inversely correlated with the P value. Significant results after FDR correction (q < 0.05) are colored in red. Full analysis is provided in supplemental Table 4. Pairwise (Fisher’s exact test) comparison of the incidence of mutations within thymic GZL and PMBCL (C), within nonthymic GZL and cHL (D), and within nonthymic GZL and PMBCL (E).
Comparison of GZL with pathologically related entities. (A) Bar plot showing the most recurrently affected genes within thymic and nonthymic GZL. The incidence of mutations in PMBCL and cHL is based on data from the literature. (B) Pairwise (Fisher’s exact test) comparison of the incidence of mutations within thymic GZL and cHL. The size of the bubble is inversely correlated with the P value. Significant results after FDR correction (q < 0.05) are colored in red. Full analysis is provided in supplemental Table 4. Pairwise (Fisher’s exact test) comparison of the incidence of mutations within thymic GZL and PMBCL (C), within nonthymic GZL and cHL (D), and within nonthymic GZL and PMBCL (E).
Among nonthymic cases (N = 18), BCL2 and TP53 mutations were significantly enriched (28% and 39%, respectively) compared with PMBCL (2% and 9.5%; P = .001 and .004 respectively; Figure 4E) and cHL (0% and 10%; P = .002 and .03 respectively; Figure 4D) after FDR adjustment. Finally, the most recurrently mutated genes within nonthymic GZL, such as SOCS1 (33%), CREBBP (28%), BCL2 (28%), and STAT6 (16%), are commonly found in the germinal center B-cell–like subtype of DLBCL (supplemental Figure 10; supplemental Table 4C).
A gene expression phenotype reminiscent of PMBCL is associated with “thymic mutations”
To further examine the molecular phenotype of GZL at the expression level, 37 of the 42 GZL cases with intermediate morphology (ie, groups 1 and 2, group 0 not included given the lower percentage of tumor cells) in this sequencing cohort, along with 14 PMBCL cases, were analyzed using RNA sequencing, as reported previously.9 PMBCL and DLBCL signature scores for each sample were calculated by taking the mean expression (normalized and log transformed) of the Lymph3Cx signature genes.38 Thymic cases (GZL and PMBCL) had significantly greater expression of the PMBCL gene signature (P = 1.5e−5) compared with nonthymic GZL cases; the opposite was true in regard to the DLBCL gene signature (P = .007). Importantly, the presence of some “thymic mutations” described in our analysis above (Figure 3C; TNFAIP3, B2M, GNA13, or NFKBIE) correlated with a high PMBCL score and a low DLBCL score (Figure 5; supplemental Figure 11).
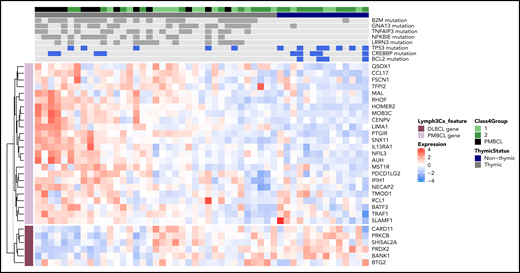
Integration of mutational data with PMBCL/DLBCL gene expression signatures. For 37 of the 42 group 1-2 GZLs in this cohort and 14 PMBCLs, RNA sequencing data have been reported previously.10 For each sample (columns), the heat map shows expression (normalized and log-transformed counts) of genes (rows) comprising the Lymph3Cx38 gene signature that distinguishes PMBCL from DLBCL (with PMBCL genes in light purple and DLBCL genes in dark purple). DLBCL-related genes and PMBCL-related genes formed 2 uniform clusters according to tumor cell expression patterns. For the mutation track, genes were selected based on their enrichment in thymic GZL (LRRN3, NFKBIE, TNFAIP3, GNA13, B2M) and nonthymic GZL (CREBBP, TP53, BCL2). Filled boxes (dark gray or blue) represent cases with mutations present, and light gray boxes represent no mutation.
Integration of mutational data with PMBCL/DLBCL gene expression signatures. For 37 of the 42 group 1-2 GZLs in this cohort and 14 PMBCLs, RNA sequencing data have been reported previously.10 For each sample (columns), the heat map shows expression (normalized and log-transformed counts) of genes (rows) comprising the Lymph3Cx38 gene signature that distinguishes PMBCL from DLBCL (with PMBCL genes in light purple and DLBCL genes in dark purple). DLBCL-related genes and PMBCL-related genes formed 2 uniform clusters according to tumor cell expression patterns. For the mutation track, genes were selected based on their enrichment in thymic GZL (LRRN3, NFKBIE, TNFAIP3, GNA13, B2M) and nonthymic GZL (CREBBP, TP53, BCL2). Filled boxes (dark gray or blue) represent cases with mutations present, and light gray boxes represent no mutation.
Comparison of mutational patterns between poly-EBV-L and GZL
To explore mutational correlates associated with an EBV-driven pathogenetic mechanism, and given the morphological similarity observed between poly-EBV-L and GZL,1,11 we contrasted their mutational landscapes. Poly-EBV-L cases carried fewer potential oncodrivers (within our 217 gene panel) compared with GZL cases (mean, 10.7 vs 7.4; P = .1). Some specific genes were more differentially affected (Figure 6A-B; supplemental Table 4D). Indeed, poly-EBV-L did not have any HLA-B mutations and only 1 B2M start-loss mutation vs 32% of the B2M/HLA-B GZL cases. Poly-EBV-L cases did not have mutated NFKBIA (vs 22% in GZL, P = .02), NFKBIE (vs 16% in GZL), TRAF-1,2,3 (vs 12% in GZL), ITPKB (vs 16% in GZL), or XPO1 (vs 16% in GZL). In contrast, STAT3 (all within the STATα domain) mutations were found in 15% of poly-EBV-L cases, but STAT3 was not mutated in GZL cases (P = .02).
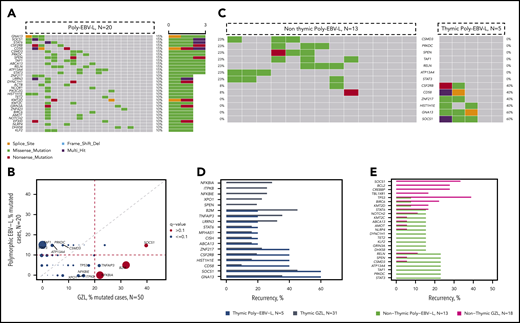
Comparison of poly-EBV-L and GZL. (A) Oncoplot of mutations within polymorphic EBV DLBCL. (B) Pairwise (Fisher’s exact test) comparison of the incidence of mutations within GZL and polymorphic EBV DLBCL. The size of the bubble is inversely correlated with the P value. Significant results (P < .05 and q < 0.1) are colored in red. Full analysis is provided in supplemental Table 4D. (C) Co-oncoplot of the most recurrent mutations within poly-EBV-L, based on the presence of thymic involvement: thymic poly-EBV-L (n = 5) and nonthymic poly-EBV-L (n = 13). Genes have been selected based on the recurrence within thymic and nonthymic poly-EBV-L (>20% in either cohort or in both). (D) Bar plot showing incidence of mutations within thymic poly-EBV-L (blue) and thymic GZL (gray). (E) Bar plot showing incidence of mutations within nonthymic poly-EBV-L (green) and nonthymic GZL (purple).
Comparison of poly-EBV-L and GZL. (A) Oncoplot of mutations within polymorphic EBV DLBCL. (B) Pairwise (Fisher’s exact test) comparison of the incidence of mutations within GZL and polymorphic EBV DLBCL. The size of the bubble is inversely correlated with the P value. Significant results (P < .05 and q < 0.1) are colored in red. Full analysis is provided in supplemental Table 4D. (C) Co-oncoplot of the most recurrent mutations within poly-EBV-L, based on the presence of thymic involvement: thymic poly-EBV-L (n = 5) and nonthymic poly-EBV-L (n = 13). Genes have been selected based on the recurrence within thymic and nonthymic poly-EBV-L (>20% in either cohort or in both). (D) Bar plot showing incidence of mutations within thymic poly-EBV-L (blue) and thymic GZL (gray). (E) Bar plot showing incidence of mutations within nonthymic poly-EBV-L (green) and nonthymic GZL (purple).
We further explored gene mutation correlates of thymic involvement within poly-EBV-L cases and found that mutations in SOCS1 and GNA13, recurrent in thymic GZL, were present in 60% of the 5 thymic poly-EBV-L cases but absent from the 13 nonthymic poly-EBV-L cases (Figure 6C-D). On the other hand, STAT3 mutations were present only in nonthymic poly-EBV-L cases (23%), and gene mutational patterns were dissimilar between nonthymic poly-EBV-L and nonthymic GZL (Figure 6E).
MYD88, CD79B, and CARD11 mutations were absent in poly-EBV-L cases, consistent with the low frequencies reported in a study on monomorphic EBV+-DLBCL.15 However, TET2, TNFRSF14, and KMT2D, which were recurrently mutated in the same study,15 were mutated in only 10%, 0%, and 0% of our polymorphic cases, respectively.
We then contrasted mutations of poly-EBV-L with those identified in pediatric EBV+-Burkitt lymphoma (BL),39 even though pathological definitions are distinct. Poly-EBV-L cases did not have mutations in genes recurrently mutated in EBV-BL (DDX3X, MYC, CCND3, RHOA, ARID1A, or FOXO1, mutated in only 1 case each) (supplemental Figure 12). ID3 and FBXO11, mutated in EBV-BL, were not included in our panel. However, these genes were not mutated in any of the 7 poly-EBV-L cases from the discovery exome cohort. As in EBV-BL, apoptosis-related genes, such as FAS, TP53, and BIRC6, were mutated at very low frequencies (0%, 5%, and 10%, respectively).
Outcome correlates with clinical parameters and gene mutational data
Outcome data were available for 65 patients (17/20 poly-EBV-L and 48/50 GZL). The majority of the patients were treated with a rituximab and polychemotherapy combination (n = 53; 83%), and the remaining patients were treated with polychemotherapy alone (supplemental Table 6). No outcome differences were observed based on treatment with and without rituximab (P = .5 and .4 for TTP and DSS, respectively). GZL and poly-EBV-L cases had similar outcomes (3-year TTP, 64% and 65%, P = .72 and 3-year DSS, 84% and 77%, P = .29 for GZL and poly-EBV-L, respectively; supplemental Figures 13 and 14). Among the clinical parameters, an Eastern Cooperative Oncology Group Performance Status (ECOG PS) >2 was associated with a shorter TTP (P = .0005; hazard ratio [HR], 3.5; 95% confidence interval [95% CI], 1.5-8.5), whereas thymic involvement, gender, bulky disease, anemia (hemoglobin < 120 g/L), stage, and age-adjusted International Prognostic Index were not (supplemental Figures 12 and 13; supplemental Table 7). The total number of mutations (“mutation burden”) was associated with a shorter TTP (P = .008, continuous variable). Indeed, patients with >17 variants (n = 13) had a 3-year TTP of 25% (standard error, 13.8%) vs 74% (standard error, 6%) (P = .006; HR, 3.4; 95% CI, 1.4-7.9) for those presenting with <17 variants (n = 52). Among the most recurrently mutated genes (ie, >15% of the full data set), SOCS1 (P = .024), B2M (P = .01), and LRRN3 (P = .04) were associated with a shorter TTP (supplemental Figures 13 and 14). Furthermore, the presence of SOCS1 or B2M mutations could identify a group (n = 28) with a 3-year TTP of 41% (95% CI, 26-68%) vs 81% (95% CI, 68-94%). In a Cox regression model (including ECOG-PS, number of mutations, and the presence of SOCS1/B2M and LRRN3 mutations), ECOG-PS (HR, 3.1) and the presence of SOCS1/B2M mutations (HR, 2.8) remained independently associated with TTP (supplemental Figure 15). None of these parameters were associated with DSS.
Discussion
Based on the analysis of an exome discovery cohort of paired LMD samples followed by deep sequencing of an extension cohort, we provide a comprehensive characterization of the mutational landscape of GZL. We show that GZL and poly-EBV-L have contrasting mutational profiles and that thymic niche involvement is associated with a distinct profile. These mutational data strengthen the biological rationale for the dichotomization of GZL based on anatomical disease presentation.9 Indeed, the mutational landscape of thymic GZL largely overlaps with that described in cHL and PMBCL. By contrast, in nonthymic GZL, half of all cases carried abnormalities affecting apoptosis-related genes, whereas NF-κB (NFKBIE/A, TNFAPI3) and GNA13 pathway mutations, typically seen in (anterior) mediastinal lymphomas, were only rarely observed.
The limits of our study are dictated by the rarity of the disease, with relatively low case numbers and the absence of exome-level data for the entire cohort. However, the exome cohort included 42% of the samples, and the consistency of results between the exome and extension cohort with characterization of 217 genes provides confidence in the accuracy of these data.
The mutation landscape analysis of GZL highlights SOCS1, B2M, GNA13, and NFKBIA as the most recurrently mutated genes, as well as apoptosis and epigenetic modifiers as being recurrently affected. On the other hand, some of the highly mutated genes in DLBCL were not observed in GZL (activated B-cell type: CARD11, MYD88, CD79B; or germinal center–type: EZH2). We also demonstrated that there was no distinctive mutational landscape based on morphological subtyping (ie, groups 0-2) of GZL. This supports our previous findings based on GEA,9 suggesting that EBV− thymic GZL constitutes a relatively homogeneous disease entity, irrespective of morphological features. Indeed, integration of gene expression and mutation data illustrates stable mutation-phenotype associations with thymic vs nonthymic involvement. In particular, we show that thymic GZL relies on the same mutation spectrum as cHL23,24,29 and PMBCL,21,22,25 with the incidence of SOCS1, B2M, or GNA13 mutations comparable among the 3 entities and the virtual absence of BCL2/BCL6 rearrangement.
Regarding nonthymic GZL, several aspects of the landscape were intriguing. First, the mutation burden was significantly lower compared with thymic GZL, suggesting different lymphomagenesis processes and cells of origin in the 2 entities. Second, BCL2, TP53, and CREBBP mutations were highlighted as significantly more recurrent in nonthymic cases as opposed to mutations within several NF-κB pathway genes (ITPKB, NFKBIE/NFKBIA/TNFAIP3) or GNA13, which were more recurrent in thymic cases. The higher incidence of GNA13 or XPO1 mutations in thymic GZL vs nonthymic GZL might reflect the higher frequency observed in PMBCL compared with DLBCL.25 Furthermore, the comparison with PMBCL and cHL highlighted BCL2 and TP53 as more specific to nonthymic GZL. The pivotal role of the apoptotic pathway within nonthymic GZL was further emphasized by a split within the cases, with 44% having a mutation in TP53, BIRC6, or BCL2 that tended to be mutually exclusive with SOCS1 or STAT6 mutations, which were present in another 39% of cases. Furthermore, BCL2 and BCL6 rearrangements tended to be enriched in the TP53/BCL2-mutated cases. These data do not suggest a unique cell of origin for nonthymic GZL. Composite lymphomas involving both cHL and DLBCL components at diagnosis are rare but have been reported in the literature, and molecular analysis of such cases would help in understanding the lymphomagenesis of nonthymic GZL.40 A theory on the origin of (nonthymic) GZL was raised in 2009; it postulates that GZL arises as a transformed disease from a previously undiagnosed indolent malignancy and subsequent immunophenotypic change at the time of transformation.41
We also highlighted in this study a fully distinct pattern of mutations between poly-EBV-L and GZL, despite their closely related pathological features. First, poly-EBV-L cases had fewer coding mutations than did GZL cases, a finding consistent with data reported in cHL,23,24,29 BL,39 and DLBCL,15 suggesting that EBV-driven pathogenesis relies on only a limited number of additional driver mutations. Second, the pattern of mutations was consistent with the literature15,23,29,39,42,43 in other EBV+ B-cell lymphomas regarding the “absence” of variants within B2M/HLA-B genes, as well as the NF-κB or TP53 pathways. Key mutations reported in EBV-BL39 were absent in poly-EBV-L; compared with other EBV+ DLBCLs, we did not observe the high frequency of mutations within TET2, TNFRSF14, KMT2D, and BCL6 reported by Kataoka et al.15 However, these data require confirmation, because exome analysis was performed in only 35% (7/20) of our poly-EBV-L cases. The observed difference might also be related to the underlying morphology of the cases (polymorphic in our series). The incidence of thymic involvement (25%) was in line with other cohorts.11,12 The presence of SOCS1, GNA13, and CSF2RB mutations in poly-EBV-L with a thymic involvement requires confirmation in a larger cohort. Lymphomas between EBV+ cHL and EBV+ DLBCL have been described in the literature. Of note, Quintanilla-Martinez et al reported on 4 EBV+ cases with mediastinal involvement and cHL/PMBCL morphology.41 Taken together, these data suggest strong molecular heterogeneity in EBV-related B-cell lymphomas, and indicate that a small subset of EBV+ tumors tend to share molecular hallmarks with EBV− GZL and, therefore, might need to be considered as part of the “thymic-niche lymphoma” spectrum.
Our outcome data need to be interpreted with caution given that the treatment was not homogeneous. Poly-EBV-L and GZL have comparable outcomes, in line with other studies on EBV-DLBCL.42,44 Among the clinical and genomic factors, ECOG PS and either SOCS1/B2M mutation were independently associated with TTP. The role of SOCS1 mutations as activators of JAK/STAT signaling has already been assessed in cHL and PMBCL,45 as has its prognostic value in DLBCL.46
In summary, we report the first mutational landscape description of GZL and poly-EBV-L. Although both entities have very distinct mutational patterns, we highlight that thymic niche involvement is a major determinant of the genomic abnormalities acquired in GZL. Mutations found in thymic GZL are closely aligned with the cHL/PMBCL spectrum, whereas those found in nonthymic GZL revealed a split based on the presence of TP53 mutations. Our results suggest distinct cells-of-origin and modes of disease evolution within the GZL spectrum.
The exomes and targeted sequencing samples that were analyzed in this study have been deposited to the European Genome-Phenome Archive (accession number EGAS00001004482).
Data sharing requests should be sent to Christian Steidl (csteidl@bccancer.bc.ca).
The online version of this article contains a data supplement.
The publication costs of this article were defrayed in part by page charge payment. Therefore, and solely to indicate this fact, this article is hereby marked “advertisement” in accordance with 18 USC section 1734.
Acknowledgments
The authors thank BC Cancer’s Centre for Lymphoid Cancer, the Lymphopath Consortium, and the CeVi Collection Project from the CALYM Carnot Institute (funded by the French National Research Council) for sending samples. The authors also thank The Lymphoma Academic Research Organisation and the LYSA-Pathology group, including Véronique Jalloux, Nadine Vailhen, Emeline Mollaret, Aurélie Gaultier, Pauline Desormeaux, Lauriane Brand, and Cassandre Houdin.
This study was supported by the Allen Frontiers Group (Allen Distinguished Investigator Award) (C. Steidl), the Terry Fox Research Institute (team grant #1061), and the BC Cancer Foundation. The platform for digital slides of the Institut Mondor de Recherche Biomedical was supported by the Agence de Recherche Contre le Cancer (ARC) Foundation and is under a validation plan executed by The Lymphoma Academic Research Organisation. C. Sarkozy is supported by the Nuovo Soldati Foundation and a fellowship grant from Plan Cancer 2014-2019, Soutien 2017 de l'Institut Thématique Multi-Organisme (ITMO) Cancer pour la Formation à la Recherche Translationnelle en Cancérologie 2017 (allocation ASC17021CSA, projet C17021CS). D.W.S. is supported by the Michael Smith Foundation for Health Research (Health Professional-Investigator Award). C. Steidl is supported by the Michael Smith Foundation for Health Research (Career Investigator Award) and the Canadian Institutes of Health Research (New Investigator Award).
Authorship
Contribution: C. Sarkozy, S.S.H., A.T.-G., and C. Steidl designed and performed the research, analyzed and interpreted data, and wrote the manuscript; E.A.C. constructed libraries and performed RNA sequencing; K.T., T.M.-T., P.F., A.M., A.T.-G., P.D., G.W.S., and D.D. contributed to the pathological review of the cases; K.T., T.M.-T., and P.F. stained and scored immunohistochemistry samples; G.D. and L.C.C. provided bioinformatics analysis; C. Sarkozy and A.T. performed RNA extractions; S.B.-N. performed FISH analysis; T.A. performed laser microdissection; A.J. provided statistical analysis; C.L., P.D., T.J.M., P.F., G.A.S., G.W.S., and A.T.-G. provided patients samples; C. Sarkozy, D.W.S., R.-O.C., and K.J.S. treated the patients and collected the clinical data; and C. Steidl supervised the study.
Conflict-of-interest disclosure: C. Steidl has acted as a consultant for Seattle Genetics, Curis Inc., Roche, AbbVie, Juno Therapeutics, and Bayer and has received research funding from Bristol Myers Squibb and Trillium Therapeutics Inc. C. Sarkozy has received research funding from Takeda and Roche. R.-O.C. has acted as a consultant for Roche, Takeda, BMS, Merck, Gilead, and AbbVie and has received research funding from Roche, Gilead, and Takeda. D.W.S. has acted as a consultant for AbbVie, Janssen Pharmaceuticals, and Celgene and has received research funding from Roche/Genentech, Janssen Pharmaceuticals, and NanoString Technologies. K.J.S. has received honoraria/acted as a consultant for Seattle Genetics, Bristol Myers Squibb, Merck, AbbVie, Astra Zeneca, and Gilead; has acted as a consultant for Servier; and has received institutional research funds from Roche. The remaining authors declare no competing financial interests.
Correspondence: Christian Steidl, 675 W. 10th Ave, Vancouver, BC V5Z 1L3, Canada; e-mail: csteidl@bccancer.bc.ca.

This feature is available to Subscribers Only
Sign In or Create an Account Close Modal