

Key Points
Achieving undetectable MRD overcomes the dismal prognosis of transplant-eligible multiple myeloma patients with high risk cytogenetics.
Characterization of MRD cells reveals greater clonal selection in standard-risk MM and ROS-mediated drug resistance in high-risk MM.

Abstract
Patients with multiple myeloma (MM) carrying standard- or high-risk cytogenetic abnormalities (CAs) achieve similar complete response (CR) rates, but the later have inferior progression-free survival (PFS). This questions the legitimacy of CR as a treatment endpoint and represents a biological conundrum regarding the nature of tumor reservoirs that persist after therapy in high-risk MM. We used next-generation flow (NGF) cytometry to evaluate measurable residual disease (MRD) in MM patients with standard- vs high-risk CAs (n = 300 and 90, respectively) enrolled in the PETHEMA/GEM2012MENOS65 trial, and to identify mechanisms that determine MRD resistance in both patient subgroups (n = 40). The 36-month PFS rates were higher than 90% in patients with standard- or high-risk CAs achieving undetectable MRD. Persistent MRD resulted in a median PFS of ∼3 and 2 years in patients with standard- and high-risk CAs, respectively. Further use of NGF to isolate MRD, followed by whole-exome sequencing of paired diagnostic and MRD tumor cells, revealed greater clonal selection in patients with standard-risk CAs, higher genomic instability with acquisition of new mutations in high-risk MM, and no unifying genetic event driving MRD resistance. Conversely, RNA sequencing of diagnostic and MRD tumor cells uncovered the selection of MRD clones with singular transcriptional programs and reactive oxygen species–mediated MRD resistance in high-risk MM. Our study supports undetectable MRD as a treatment endpoint for patients with MM who have high-risk CAs and proposes characterizing MRD clones to understand and overcome MRD resistance. This trial is registered at www.clinicaltrials.gov as #NCT01916252.
Introduction
Multiple myeloma (MM) is the second most common hematologic cancer and is characterized by great clinical heterogeneity, with some patients having dismal survival, while others can be cured.1-3 The variable course of the disease prompted the quest for personalized treatment to maximize outcomes, but to date, the choice of therapy for an individual patient is mostly based on clinical factors (eg, age and comorbidities).4
Cytogenetic abnormalities (CAs) have indisputable prognostic value in MM.5 Accordingly, the International Myeloma Working Group renewed the International Staging System (ISS) with the incorporation of lactate dehydrogenase and CAs, to develop the revised ISS (R-ISS), a simple and reliable tool to stratify patients with MM at diagnosis.6 Namely, t(4;14), t(14;16), and del(17p13) were selected as high-risk CAs in consonance with their ability to identify patients with inferior survival time in multiple clinical trials.6 Interestingly though, some studies have revealed that patients with standard- and high-risk CAs are equally sensitive to treatment, despite having different outcomes.7-10 Thus, it remains an unexplained clinical paradox that patients with high-risk CAs have inferior survival time, despite achieving similar complete response (CR) rates when compared with patients with standard-risk CAs.7-10 This raises questions about the legitimacy of CR as a treatment end point for high-risk MM and represents a biological conundrum regarding the nature of tumor reservoirs that persist after therapy in patients with standard- and high-risk CAs.
Growing evidence supports risk stratification according to measurable residual disease (MRD) over conventional response criteria.11-13 Accordingly, unsustained CR has been associated with the persistence of MRD,14 and previous data based on low-sensitivity MRD assessment suggest that attaining an MRD response could be of paramount importance to improve outcomes in patients with high-risk CAs.13 However, there is limited information about the impact of MRD in patients with high-risk MM treated with optimal therapies and monitored with next-generation techniques.15,16 There are even fewer data on the biological landscape of MRD cells17 to aid in understanding whether a shorter duration of CR in patients with high-risk CAs is a consequence of the persistence of greater MRD levels after treatment, the result of different modes of MRD resistance, or both.
In this study, high-sensitivity assessment of MRD helped resolve clinical heterogeneity of risk stratification according to CAs. Persistence of MRD shortened the survival of patients with standard-risk MM, whereas undetectable MRD overcame the dismal prognosis of high-risk MM. Further, the use of next-generation flow (NGF) cytometry to isolate MRD followed by whole-exome and RNA sequencing (RNA-seq) of paired diagnostic and MRD tumor cells revealed greater clonal selection in standard-risk MM and reactive oxygen species (ROS)–mediated drug resistance in high-risk patients.
Patients and methods
Study design
The Programa Español de Tratamientos en Hematología/Grupo Español de Mieloma 2012MENOS65 (PETHEMA/GEM2012MENOS65) clinical trial was an open-label, phase 3 study that included 458 patients who received 6 induction cycles of bortezomib, lenalidomide, and dexamethasone (VRD); underwent autologous stem cell transplantation (ASCT) conditioned with busulfan-melphalan or melphalan-200 (high-dose therapy [HDT]); and received 2 consolidation cycles of VRD.18 Afterward, patients were enrolled in the PETHEMA/GEM2014MAIN clinical trial, which involved randomized maintenance with lenalidomide-dexamethasone (RD) or RD plus ixazomib for 2 years, after which patients continued with RD for 3 additional years, if MRD+, or stopped therapy, if MRD− (Figure 1A). Each study site’s independent ethics committee approved the protocol and the informed consent forms, which were required before patient enrollment. Studies were registered at www.clinicaltrials.gov (NCT01916252, NCT02406144) and EudraCT (2012-005683-10, 2014-000554-10) and were conducted according to the ethical principles of the Declaration of Helsinki. The median follow-up was 40 months.
![MRD status according to cytogenetic risk in the PETHEMA/GEM2012MENOS65 clinical trial. (A) Design of the study, including prespecified time points for prospective evaluation of CAs by FISH and MRD. BUMEL, busulfan-melphalan; I, ixazomib; MEL, melphalan; VRD, bortezomib, lenalidomide, dexamethasone. (B) Rates of persistent and undetectable MRD in patients with standard- vs high-risk CAs [t(4;14), t(14;16), and/or del(17p13)]. Patients with persistent MRD were grouped according to the logarithmic range of detectable MRD (ie, ≥2 × 10⁻⁶ to <10−5, ≥10−5 to <10−4, and ≥10−4). *P = .04, by 2-sided χ2 test.](https://ash.silverchair-cdn.com/ash/content_public/journal/blood/137/1/10.1182_blood.2020006731/1/m_bloodbld2020006731f1.png?Expires=1770471218&Signature=u1P4xFhKrV~0VENJqssWOISldQjgjUbTFXwzGqWNzo6zykEMBHuwWTE6D1nc3kf4ZBn3TURJ~-uXJ2oOXme89gWJE8za-cQCfrGtHp0jUmq0HjC0hf1kuvsDufnU7iGZBH3abuOm4c84zTNHjoOz0jX-5I1ZbR7BZJvUZouUbVkOf5e6NYeEQ0~wxPaayh5pkVCHhycWdys6RyuucyeREIjzQd4Byoo~8AnIecN0RJKzbFdamjSC1i9ez~~-xA6ykkitP-m~rqrz0BQYkZ4OXyiVUpsoSIBQPxy3OBcsUcpFsVHVXYWoO66cja-QumPg~iz11NDnfrJ8hZMQxqAx0Q__&Key-Pair-Id=APKAIE5G5CRDK6RD3PGA)
MRD status according to cytogenetic risk in the PETHEMA/GEM2012MENOS65 clinical trial. (A) Design of the study, including prespecified time points for prospective evaluation of CAs by FISH and MRD. BUMEL, busulfan-melphalan; I, ixazomib; MEL, melphalan; VRD, bortezomib, lenalidomide, dexamethasone. (B) Rates of persistent and undetectable MRD in patients with standard- vs high-risk CAs [t(4;14), t(14;16), and/or del(17p13)]. Patients with persistent MRD were grouped according to the logarithmic range of detectable MRD (ie, ≥2 × 10⁻⁶ to <10−5, ≥10−5 to <10−4, and ≥10−4). *P = .04, by 2-sided χ2 test.
MRD status according to cytogenetic risk in the PETHEMA/GEM2012MENOS65 clinical trial. (A) Design of the study, including prespecified time points for prospective evaluation of CAs by FISH and MRD. BUMEL, busulfan-melphalan; I, ixazomib; MEL, melphalan; VRD, bortezomib, lenalidomide, dexamethasone. (B) Rates of persistent and undetectable MRD in patients with standard- vs high-risk CAs [t(4;14), t(14;16), and/or del(17p13)]. Patients with persistent MRD were grouped according to the logarithmic range of detectable MRD (ie, ≥2 × 10⁻⁶ to <10−5, ≥10−5 to <10−4, and ≥10−4). *P = .04, by 2-sided χ2 test.
MRD assessment
MRD was predefined to be assessed at the time of suspected CR, after induction, at day 100 after HDT-ASCT, and after consolidation, regardless of the patient’s response status. Of the 458 patients enrolled, 397 had at least 1 assessment of MRD performed after ≥1 of the treatment phases defined previously. The 61 patients without assessment of MRD discontinued treatment during induction. Another 26 patients discontinued therapy during intensification. Overall, 377, 352, and 357 patients had MRD that was evaluable after induction, HDT-ASCT, and consolidation, respectively. Sustained MRD negativity was defined as having undetectable MRD after induction that continued to be negative at day 100 after HDT-ASCT and at the end of consolidation.
NGF cytometry
MRD was assessed by using the NGF method developed by EuroFlow for highly sensitive and standardized MRD detection in MM.19 In brief, the method is based on a lyse-wash-and-stain protocol and an optimized 8-color, 2-tube antibody panel, for accurate identification of phenotypically aberrant, clonal plasma cells (PCs). The 2-tube strategy allows for detection of MRD with specific confirmation of light-chain (mono)clonality on phenotypically aberrant PCs, identified by antigen underexpression (CD19, CD27, CD38, CD45, and CD81) or overexpression (CD56, CD117, and CD138), as compared with normal PCs. Data acquisition was performed on a FACSCanto II flow cytometer (Becton Dickinson) equipped with FACSDiva 6.1 software (BD). Data analysis was performed with Infinicyt software (Cytognos SL). The number of viable nucleated cells was systematically registered, and the limit of detection (LOD) achieved by NGF was determined in each sample according to the formula (20/viable nucleated cells) × 100. Patients were thought to have detectable MRD whenever the percentage of phenotypically aberrant clonal PCs was equal to or greater than the LOD achieved in the corresponding sample. Conversely, patients were considered to have undetectable MRD when phenotypically aberrant clonal PCs were either absent or present at percentages below the LOD achieved in the corresponding sample. MRD assessments were performed blinded to clinical outcomes in 3 PETHEMA/GEM laboratories, and data were centralized for MRD analyses.
Fluorescence-activated cell sorting
Patient-specific aberrant phenotypes identified with NGF were used for highly purified fluorescence-activated cell sorting (FACS; FACSAria IIb flow cytometer; Becton Dickinson) of clonal PCs at diagnosis and after treatment (ie, MRD), based on the same protocol (except for cell fixation) with the antibody combinations described in “NGF cytometry” (except for intracellular staining of κ and λ). At diagnosis, peripheral blood T cells were sorted by flow cytometry as a control for germline variants. Type of CA, depth of conventional response, and MRD levels of patients in whom MRD cells were isolated by FACS are described in supplemental Table 1, available on the Blood Web site.
Whole-exome sequencing
The quality of genomic DNA extracted from tumor and T cells (coisolation of DNA and RNA; supplemental Methods) was evaluated by a 4200 TapeStation, using the Genomic DNA ScreenTape system (Agilent), and DNA concentration was quantified with the Qubit System (Thermo Fisher Scientific). Genomic DNA (∼2.4-3.6 ng) was captured for each sample on a 10X Chromium instrument, using the Chromium Genome Reagent Kit v2 for Exome Assays (10X Genomics). DNA was then fragmented to an average size of 225 in a Covaris S220 ultrasonicator (Covaris) and subjected to DNA library construction, using the Chromium Genome Reagent Kit v2 for Exome Assays (10X Genomics). Target enrichment was performed with the SureSelectXT Human All Exon v6 Capture Library (Agilent) and sequence targets were captured and amplified in accordance with the manufacturer’s recommendations. Enriched libraries were used for 150-base sequencing in a NovaSeq 6000 (Illumina) according to the manufacturer’s instructions. Sequencing resulted in a mean read depth of 114x (range, 70-184x). Whole-exome data analysis is described in the supplemental Methods.
Bulk RNA-seq
Because of the low number of sorted MRD cells (median, 25 600), we used a 3′ end RNA-seq method optimized for generating libraries from low-input starting material (MAR-Seq), adapted for bulk RNA-seq20,21 with minor modifications. Poly-A RNA was selected with Dynabeads Oligo (dT) (Thermo Fisher Scientific) and reverse transcribed with AffinityScript Multiple Temperature Reverse Transcriptase (Agilent) using poly-dT oligos carrying a 7-bp index. Up to 8 samples with similar overall RNA content were pooled and subjected to linear amplification by in vitro transcription (IVT), with the HiScribe T7 High Yield RNA Synthesis Kit (New England Biolabs). Next, antisense RNA was fragmented into 250- to 350-bp fragments by using RNA Fragmentation Reagents (Thermo Fisher Scientific) and dephosphorylated with FastAP (Thermo Fisher Scientific), according to the manufacturer’s instructions. Partial Illumina adaptor sequences20 were ligated with T4 RNA Ligase 1 (New England Biolabs), followed by a second reverse transcription reaction. Full Illumina adaptor sequences were added during final library amplification with KAPA HiFi DNA Polymerase (Kapa Biosystems). RNA-seq library quality controls consisted of quantification with the Qubit 3.0 Fluorometer (Thermo Fisher Scientific) and size profile examination with the 4200 TapeStation System. Libraries, pooled at equimolar concentrations, were sequenced with the NextSeq 500 (Illumina). Sequencing resulted in a mean depth of 10.5 million reads per sample. RNA-seq data analysis is described in supplemental Methods.
Single-cell RNA-seq and analysis
For single-cell RNA-seq (scRNA-seq), clonal PCs were sorted by FACS, and viable cells were loaded into the Chromium instrument (10X Genomics). scRNA-seq libraries were prepared according to the recommended protocol of 10X-Genomics, version 2. Final libraries were sequenced with a NextSeq 500 (Illumina). Demultiplexing, alignment, and gene counts were performed with the Cell Ranger Single-Cell Software Suite (v3.01; 10X Genomics), using GRCh38 as reference genome. Cells with <200 genes and/or >10% mitochondrial genes were removed. Downstream analyses, including normalization with SCTransform, linear dimensional reduction, graph-based clustering, and Uniform Manifold Approximation and Projection visualization were performed with the Seurat R Package (v3.03).22 Contaminating cells were excluded from the analysis. For cancer stem cell (CSC) scores, the average expression of CSC-related genes (SOX2, KLF4, EPCAM, TWIST1, SNAI1, SNAI2, ZEB1, ZEB2, NOTCH1, MSI, ALDH, CD44, and CD47) was calculated with AddModuleScore function.
Measurement of ROS levels
Total ROS levels were measured by flow cytometry with a kit from Enzo Life Sciences and H2DCFDA. For the Enzo Life Sciences kit, all cell lines were grown in 6-well plates (3 × 10⁵ cell per well) for 24 hours. As a negative control, the cells were treated with 50 µM of ascorbic acid overnight, and, as a positive control, cells were treated with 300 µM of pyocyanin for 1 hour. Cells were stained with an oxidative stress detection reagent (Enzo Life Sciences), incubated at 37°C for 1 hour, and ROS levels were measured on a FACSCantoII (BD Biosciences). To measure total ROS with H2DCFDA, cells were grown in 96-well plates (105 cell/well) for 24 hours and then stained with H2DCFDA (Thermo Fisher Scientific) at a concentration of 2.5 µM and incubated for 30 minutes at 37°C. The cells where washed twice in phosphate-buffered saline and stained with ToPro3 as the dead-cell indicator (Thermo Fisher Scientific). ROS levels were measured with a FACSCantoII (BD Biosciences). The resulting FCS files were analyzed with FlowJo (v10) and Prism (GraphPad) software.
Cytogenetic characterization
Fluorescence in situ hybridization (FISH) was performed at diagnosis in the same 3 PETHEMA/GEM laboratories that performed MRD monitoring. Immunomagnetically enriched PCs from 390 of 458 patients were tested for chromosome 1 alterations, IGH translocations, and del(17p13). Patients were considered positive for any of these abnormalities if present in ≥10% of CD138+ PCs. Patients with t(4;14), t(14;16), and/or del(17p13) were classified as high risk (n = 90); the others were classified as standard risk (n = 300).
Statistical analyses
To avoid narrowing the study by considering only those patients responding to treatment (ie, favorable disease course), MRD results were analyzed in the intent-to-treat population with available FISH cytogenetics (n = 390). Thus, patients with active disease, who discontinued treatment were regarded as having detectable MRD at that moment and thereafter (consort diagram available in supplemental Figure 1). Patients without an assessment of MRD at a specific time point for reasons other than discontinued treatment were also regarded as having detectable MRD at that time point. MRD status of patients with standard- and high-risk CAs at the 3 time points is described in supplemental Table 2. To estimate survival probabilities in all patients stratified at diagnosis by CA, we defined progression-free survival (PFS) as the time from study entrance until disease progression or death from any cause and overall survival (OS) as the time from study entrance until death. Survival probabilities according to persistent vs undetectable MRD after consolidation were estimated by the Kaplan-Meier method. Differences were tested for statistical significance with the (2-sided) log-rank test, and hazard ratio with 2-sided 95% confidence interval (CI) was estimated with a Cox regression model. Statistical analyses and survival curves were performed with the R packages survival23 and survminer.24 RNA-seq data (n = 553) from tumor PCs of patients with newly diagnosed MM who were enrolled in the CoMMpass study (version IA11) was kindly provided by the Multiple Myeloma Research Foundation to investigate the prognostic value of ROS-related genes found to be deregulated in MRD cells.
Results
Undetectable MRD overcomes the dismal survival of patients with high-risk CA
The baseline characteristics of the 390 patients in whom FISH was successfully performed (Table 1) were similar to those of the intent-to-treat population in the PETHEMA/GEM2012MENOS65 clinical trial.18 MRD was evaluated in 906 bone marrow samples, achieving a median limit of detection of 3 × 10⁻⁶.
Baseline characteristics of patients enrolled in the PETHEMA/GEM2012MENOS65 clinical trial with data on CAs
| Total (N = 390) | |
|---|---|
| Median age (range), y | 58 (31-65) |
| Sex, n (%) | |
| Male | 207 (53) |
| Female | 183 (47) |
| ECOG performance status, n (%) | |
| 0 | 160 (41) |
| 1 | 156 (40) |
| 2 | 55 (14) |
| 3 | 15 (4) |
| Data missing | 4 (1) |
| M-protein type, n (%) | |
| IgG | 231 (59) |
| IgA | 94 (24) |
| Light chain | 56 (15) |
| IgD | 4 (1) |
| Nonsecretory | 5 (1) |
| ISS stage, n (%) | |
| I | 155 (40) |
| II | 134 (34) |
| III | 96 (25) |
| Data missing | 5 (1) |
| R-ISS stage, n (%) | |
| I | 114 (29) |
| II | 234 (60) |
| III | 23 (6) |
| Data missing | 19 (5) |
| High-risk CAs, n (%) | |
| t(4;14) | 42 (47) |
| t(14;16) | 10 (11) |
| del(17p13) | 38 (42) |
| Median follow-up, months | 40 |
ECOG, Eastern Cooperative Oncology Group.
There were no significant differences (P = .388) in CR rates between patients with standard- vs high-risk (187 of 300; 62% and 51 of 9; 57%, respectively) CAs. However, the percentage of patients with undetectable MRD was significantly higher (P = .04) in those with standard- vs high-risk disease (148 of 300; 49% and 33 of 90; 37%, respectively; Figure 1B). Among the latter, the likelihood of undetectable MRD was higher in patients with t(4;14) (18 of 42; 43%) vs those with del(17p13) (9 of 38; 24%; P = .02). Only 10 patients had a t(14;16), and 4 were MRD+. Overall, these findings reinforce the higher sensitivity of NGF over conventional methods19 and disclose that the depth of MRD response remains inferior in high-risk MM, despite optimal and intensive therapy.
Despite the lower rates of undetectable MRD in high-risk MM, the percentage of sustained MRD negativity from induction to consolidation was similar between patients with standard- and high-risk CAs (71 of 300; 24% and 17 of 90; 19%, respectively; P = .3415). This result suggests that a reduced number of patients with high-risk CAs who attain undetectable MRD could show favorable outcomes based on durable MRD response. Accordingly, the 36-month PFS rate was higher than 90% in patients with undetectable MRD, with no significant differences (P = .569) between patients with standard- vs high-risk CAs (91% vs 97%, respectively; Figure 2A). Similar results were observed for OS (Figure 2B). By contrast, persistent MRD significantly reduced 36-month PFS rates in patients with standard- and high-risk CAs (60% and 37%, respectively; P < .001). Both patient subgroups also displayed significantly inferior OS (36-month OS rate of 82% and 52%, respectively; P < .001) when compared with those with undetectable MRD, regardless of cytogenetic risk (36-month OS rate, ≥96%).
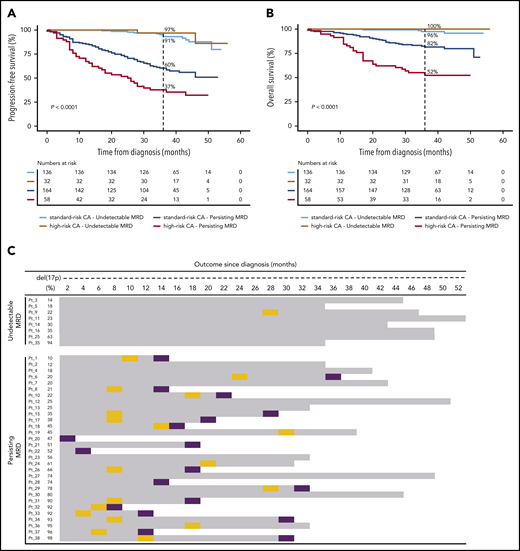
Undetectable MRD overcomes the dismal survival of patients with MM with high-risk CAs. Impact on PFS (A) and OS (B), according to MRD status in patients with standard- and high-risk CAs. (C) Patients with del(17p13) are listed according to the percentage of tumor cells having each CA (from lower to higher), MRD status at the latest evaluation time point, and outcome. OS is represented by gray bars, and progression and deaths are identified by orange and purple boxes, respectively. P values were determined by the 2-sided log-rank test.
Undetectable MRD overcomes the dismal survival of patients with MM with high-risk CAs. Impact on PFS (A) and OS (B), according to MRD status in patients with standard- and high-risk CAs. (C) Patients with del(17p13) are listed according to the percentage of tumor cells having each CA (from lower to higher), MRD status at the latest evaluation time point, and outcome. OS is represented by gray bars, and progression and deaths are identified by orange and purple boxes, respectively. P values were determined by the 2-sided log-rank test.
There were no significant differences in the outcome of patients with undetectable MRD when stratified by the presence of t(4;14), t(14;16), and del(17p13) (36-month PFS rates of 100%, 100%, and 89%, respectively; P ≥ .317; supplemental Figure 2A-B). Conversely, 36-month PFS rates in patients with persistent MRD significantly decreased in comparison with rates in those having standard-risk CAs and those with t(4;14) and del(17p13) (60%, 45%, and 27%, respectively; (supplemental Figure 2C-D). Similar findings were observed when patients were stratified according to chromosome 1 alterations (supplemental Figure 3), ISS and R-ISS (supplemental Figure 4) stages. Taken together, these results suggest that achieving undetectable MRD overcomes the poor prognosis of patients with t(4;14), t(14;16)+1q, del(1p32), or del(17p13), as well as those with ISS and R-ISS stage III. A subanalysis in patients with del(17p13) confirmed that this effect was observed, regardless of the percentage of CD138+ PCs having this CA (Figure 2C).
Therapy induces greater clonal selection of MRD tumor cells in standard- vs high-risk MM
MRD levels were higher in patients with high- vs standard-risk CAs (median, 0.006% vs 0.004%; P = .035). Differences in MRD levels between patients with t(4;14) and del(17p13) did not reach statistical significance (medians, 0.004% vs 0.02%, respectively; P = .159). No statistically significant differences were found when comparing distribution in patients per logarithmic range of detectable MRD (Figure 1B); however, inferior PFS was observed in patients with high-risk CAs, even after stratification according to logarithmic ranges of persistent MRD (ie, ≥2 × 10⁻⁶ to <10−5, ≥10−5 to <10−4, and ≥10−4; supplemental Figure 5). That the presence of high- vs standard-risk CAs conferred poorer outcomes in patients with similar MRD (log) levels, ignited further interest in the mode of MRD resistance in the 2 subgroups.
We used NGF to detect and isolate MRD tumor cells based on patient-specific aberrant phenotypes for subsequent whole-exome sequencing of matched diagnostic and tumor cells persisting after VRD induction (n = 14). Overall, 308 of 772 (40%) mutations and 48 of 67 (72%) copy number alterations (CNAs) were detectable at both time points (Figure 3A-D). Notably, potentially actionable mutations25 in genes such as KRAS, BRAF, CCND1, and ROS1, were present in MRD tumor cells whenever detectable at diagnosis, but others in genes, such as NRAS or FLT3, became undetectable at MRD stages (supplemental Table 3; supplemental Figure 6). Interestingly, most mutations and CNAs that became undetectable in MRD tumor cells were observed in patients with standard-risk MM; by contrast, patients with high-risk CAs displayed more new mutations after treatment (Figure 3E-F). These findings revealed greater clonal selection in standard-risk MM (Figure 4), whereas potentially higher genomic instability26 may have facilitated the acquisition of more mutations in MRD tumor cells of patients with high-risk CAs.
![Genomic landscape of diagnostic and MRD tumor cells in standard- vs high-risk MM. Number and frequency of shared vs private mutations (A) and CNA (B) in paired diagnostic and MRD tumor cells are indicated in Venn diagrams (n = 14). Oncoprint of genomic mutations (single-nucleotide variants [SNVs] and insertions/deletions) (C) and CNA and loss of heterozygosity (LOH) (D) in patients with standard- and high-risk (both n = 7) CAs. Genes are distributed in rows, and columns represent paired diagnostic and MRD tumor cells of each patient. Two-dimensional density plots showing tumor cell clustering according to mutations (E) and CNAs (F) detectable in paired diagnostic and MRD tumor cells (x- and y-axis, respectively). Private events at diagnosis are highlighted in green and at MRD stages in red; persistent events are in orange. Stacked plots represent the percentage of tumor cells showing private and persistent genetic events. CCF, cancer-cell fraction.](https://ash.silverchair-cdn.com/ash/content_public/journal/blood/137/1/10.1182_blood.2020006731/1/m_bloodbld2020006731f3.png?Expires=1770471218&Signature=QJm-JQO8yq4UDsmAtyw~AVC5g2jRXta7fYHfy71VZyP~fREwLWhbIl3OtBQVDLEXQafBRrNhTFHVEgnP8KyHa89zemhvCxqEWRgq9lI42gD4DJAU5BiFC~0xMnF63VDIHKuRcBchlqcUduFLKoZ4qo9YfCGXliNWYVrzUf6WY~7Pvipmc8aQwpLEqxA6TbhxgVjr0jWyi3pAf5n6CXjJoDIaLfiEAR4OBq6GLGg09xNbzr9slvterj4Mfuu0u8lhUqHSzKEf35bMyuqAV5HvO1765~LVqEGQk7TE6H1jbiC2kgFZF4nEx2MURRSKaPI1Q5fbIQ97mQ5gJ1k3~hOgfA__&Key-Pair-Id=APKAIE5G5CRDK6RD3PGA)
Genomic landscape of diagnostic and MRD tumor cells in standard- vs high-risk MM. Number and frequency of shared vs private mutations (A) and CNA (B) in paired diagnostic and MRD tumor cells are indicated in Venn diagrams (n = 14). Oncoprint of genomic mutations (single-nucleotide variants [SNVs] and insertions/deletions) (C) and CNA and loss of heterozygosity (LOH) (D) in patients with standard- and high-risk (both n = 7) CAs. Genes are distributed in rows, and columns represent paired diagnostic and MRD tumor cells of each patient. Two-dimensional density plots showing tumor cell clustering according to mutations (E) and CNAs (F) detectable in paired diagnostic and MRD tumor cells (x- and y-axis, respectively). Private events at diagnosis are highlighted in green and at MRD stages in red; persistent events are in orange. Stacked plots represent the percentage of tumor cells showing private and persistent genetic events. CCF, cancer-cell fraction.
Genomic landscape of diagnostic and MRD tumor cells in standard- vs high-risk MM. Number and frequency of shared vs private mutations (A) and CNA (B) in paired diagnostic and MRD tumor cells are indicated in Venn diagrams (n = 14). Oncoprint of genomic mutations (single-nucleotide variants [SNVs] and insertions/deletions) (C) and CNA and loss of heterozygosity (LOH) (D) in patients with standard- and high-risk (both n = 7) CAs. Genes are distributed in rows, and columns represent paired diagnostic and MRD tumor cells of each patient. Two-dimensional density plots showing tumor cell clustering according to mutations (E) and CNAs (F) detectable in paired diagnostic and MRD tumor cells (x- and y-axis, respectively). Private events at diagnosis are highlighted in green and at MRD stages in red; persistent events are in orange. Stacked plots represent the percentage of tumor cells showing private and persistent genetic events. CCF, cancer-cell fraction.
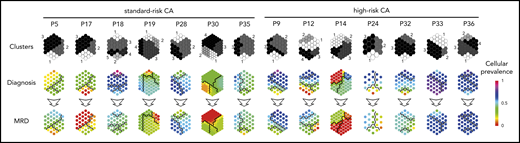
Therapy-induced selection of MRD clones in standard- vs high-risk MM. Suprahexagonal maps showing mutation metaclusters in black and white and changes in cellular prevalence between diagnosis and MRD tumor cells, inferred by PyClone based on detectable mutations.
Therapy-induced selection of MRD clones in standard- vs high-risk MM. Suprahexagonal maps showing mutation metaclusters in black and white and changes in cellular prevalence between diagnosis and MRD tumor cells, inferred by PyClone based on detectable mutations.
Antioxidative gene circuitries are upregulated in MRD tumor cells with high-risk CAs
The extent of clonal selection induced by therapeutic pressure could reflect the degree of clonal heterogeneity at diagnosis in standard- and high-risk MM. However, scRNA-seq revealed a similar number of transcriptional clones in patients with newly diagnosed MM having standard- and high-risk disease (n = 3 each; means of 6.3 and 5.6, respectively; supplemental Figure 7). By contrast, when we compared the transcriptional profile of diagnostic vs MRD tumor cells persisting after VRD induction in patients with standard- and high-risk CAs (n = 26 and 14, respectively), we found an almost 2-fold higher number of genes deregulated in MRD tumor cells of the former subgroup (Figure 5A). Furthermore, gene set enrichment analysis showed pathways differentially altered in standard- vs high-risk MM (Figure 5B). Because there was a specific enrichment of the ROS pathway in MRD tumor cells of patients with high-risk CAs, together with preliminary data suggesting a role for bortezomib-induced, ROS-mediated MM cell death,27-29 we specifically evaluated whether reduced ROS activity is related to MRD resistance in high-risk MM. We first measured ROS by flow cytometry in MM cell lines with high-risk CAs that developed resistance to bortezomib or dexamethasone. As compared with parental cells, we found significantly lower total ROS levels in MM cells resistant to bortezomib, but not to dexamethasone (supplemental Figure 8A-B).
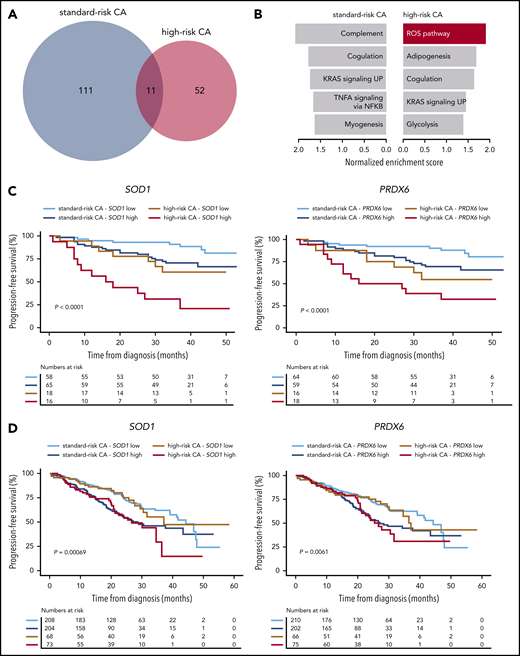
Antioxidative gene circuitries are upregulated in MRD cells with high-risk CAs. (A) The number of differentially expressed genes between diagnostic and MRD tumor cells of patients with standard- vs high-risk (n = 26 and 14, respectively) CAs. (B) The Hallmarks of Cancer data set was used for Gene Set Enrichment Analysis (GSEA), based on gene expression in diagnostic and MRD tumor cells of patients with standard- and high-risk CAs. The most enriched pathways (nominal P < .1) are represented for each group (top). (C) PFS according to the messenger RNA (mRNA) expression (high or low, if above or below the median expression) of SOD1 and PRDX6 in diagnostic tumor cells of patients with MM with standard- and high-risk CAs enrolled in the PETHEMA/GEM2012MENOS65 study (n = 157). ***P < .001 by 2-sided log-rank test. (D) PFS according to the mRNA expression (high or low if above or below the median expression) of SOD1 and PRDX6 in diagnostic tumor cells of patients with MM with standard- and high-risk CAs who were enrolled in the CoMMpass study (N = 553). *P < .01, by 2-sided log-rank test.
Antioxidative gene circuitries are upregulated in MRD cells with high-risk CAs. (A) The number of differentially expressed genes between diagnostic and MRD tumor cells of patients with standard- vs high-risk (n = 26 and 14, respectively) CAs. (B) The Hallmarks of Cancer data set was used for Gene Set Enrichment Analysis (GSEA), based on gene expression in diagnostic and MRD tumor cells of patients with standard- and high-risk CAs. The most enriched pathways (nominal P < .1) are represented for each group (top). (C) PFS according to the messenger RNA (mRNA) expression (high or low, if above or below the median expression) of SOD1 and PRDX6 in diagnostic tumor cells of patients with MM with standard- and high-risk CAs enrolled in the PETHEMA/GEM2012MENOS65 study (n = 157). ***P < .001 by 2-sided log-rank test. (D) PFS according to the mRNA expression (high or low if above or below the median expression) of SOD1 and PRDX6 in diagnostic tumor cells of patients with MM with standard- and high-risk CAs who were enrolled in the CoMMpass study (N = 553). *P < .01, by 2-sided log-rank test.
Next, we evaluated whether the expression of antioxidant genes could identify patients with newly diagnosed MM with enrichment of tumor cells capable of countering ROS-induced cytotoxicity29-31 (ie, MRD phenotype). If the hypothesis was correct, these patients would have inferior outcomes when treated with bortezomib-based regimens. In a multivariate analysis including the 20 genes responsible for the specific enrichment of the ROS pathway in MRD tumor cells, the expression levels of SOD1 and PRDX6 at diagnosis in patients enrolled in the PETHEMA/GEM2012MENOS65 clinical trial (n = 157) showed the strongest association with PFS (supplemental Figure 8C). Namely, increased expression of SOD1 and PRDX6 resulted in significantly inferior PFS of patients with high-risk CAs. These results are confirmed in our data set (Figure 5C) and an external data set (CoMMpass; n = 553; Figure 5D). Then, we used scRNA-seq to investigate whether the expression of these antioxidative genes was restricted to singular clones, but we found no clustering of SOD1- and PRDX6-expressing tumor cells with standard- and high-risk CAs (supplemental Figure 8D). Because, in addition to these results, no unifying lost or acquired genetic abnormalities were identified in MRD cells (Figure 3), our findings suggest that MRD resistance emerges from selection of tumor cells that transcriptionally evolve to resist therapy rather than from selection of clones with well-defined genetic abnormalities.
Transcriptional profile of MRD clones
To investigate common mechanisms of MRD resistance regardless of cytogenetics, we compared the transcriptional profile of diagnostic vs MRD clones persisting after induction of VRD in all patients (n = 40). We found 762 significantly deregulated genes (Figure 6A), including overexpression of IL8 and CHI3L1, which have been linked to drug resistance and poor prognosis in MM.32-34 The number of differentially expressed genes from diagnostic to MRD cells was higher in patients who achieved very good partial response or better, as compared with the remaining patients (data not shown). A functional network analysis showed downregulation of gene circuitries linked to RNA splicing, nonsense-mediated decay, and proteasome activity (Figure 6B). These data suggest that the few tumor cells detectable after treatment have a transcriptional program enriched in general hallmarks of resistance,35-37 but also have molecular programs related to the drug mechanisms that persist (ie, downregulation of proteasome-related genes in response to proteasome inhibition).38-40 Also, MRD cells displayed impaired mitochondrial translation and metabolic gene expression pathways (Figure 6B), suggestive of a quiescent transcriptional program. Interestingly, bortezomib-resistant MM cell lines with high-risk CAs exhibited a reduced level of mitochondrial oxidative phosphorylation that was not observed in dexamethasone-resistant MM cells (supplemental Figure 9).
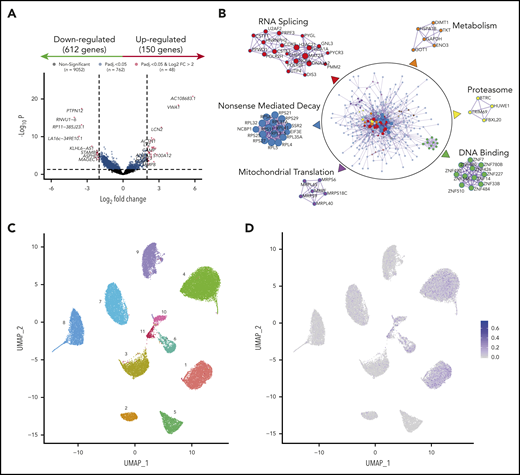
Transcriptional profile of MRD clones. (A) Volcano plot based on RNA-seq of paired diagnostic and MRD tumor cells (n = 40). Each dot corresponds to an individual gene. Differentially expressed genes (150 upregulated and 612 downregulated in MRD cells) with a log2 fold change ≤2 are shown in blue, and differentially expressed genes with a log2 fold change >2 are in red. Padj < .05. (B) Functional networks based on genes deregulated in MRD cells. Protein-protein physical interactions based on the 762 differentially expressed genes were identified according to the BioGrid, InWe_IMM, and OmniPath databases. The algorithm MCODE (Minimal Common Oncology Data Elements) was used for identification of densely connected networks. (C) UMAP (Uniform Manifold Approximation and Projection) representation of single bone marrow tumor plasma cells (n = 21 991) isolated by FACS from 11 patients with newly diagnosed MM. Each patient is represented by a unique color and number. (D) CSC scores per cell are projected onto UMAP plots.
Transcriptional profile of MRD clones. (A) Volcano plot based on RNA-seq of paired diagnostic and MRD tumor cells (n = 40). Each dot corresponds to an individual gene. Differentially expressed genes (150 upregulated and 612 downregulated in MRD cells) with a log2 fold change ≤2 are shown in blue, and differentially expressed genes with a log2 fold change >2 are in red. Padj < .05. (B) Functional networks based on genes deregulated in MRD cells. Protein-protein physical interactions based on the 762 differentially expressed genes were identified according to the BioGrid, InWe_IMM, and OmniPath databases. The algorithm MCODE (Minimal Common Oncology Data Elements) was used for identification of densely connected networks. (C) UMAP (Uniform Manifold Approximation and Projection) representation of single bone marrow tumor plasma cells (n = 21 991) isolated by FACS from 11 patients with newly diagnosed MM. Each patient is represented by a unique color and number. (D) CSC scores per cell are projected onto UMAP plots.
Discussion
Successful treatment of high-risk patients is an essential step toward improving OS in MM. Our results confirm that transplant-eligible patients with high-risk CAs, who achieve undetectable MRD after VRD induction and consolidation, have outcomes similar to those of patients with standard-risk disease.13,15 By contrast, in patients with persistent MRD, regardless of logarithmic levels, presence of high-risk CAs conferred poorer outcomes. These findings have 3 clinical consequences: (1) undetectable MRD should be regarded as a therapeutic end point for patients with standard- and high-risk CAs13,41 ; (2) risk stratification must be reassessed after treatment, because patients with an adverse prognosis may shift into a favorable one upon achieving and maintaining deep responses after intensive therapy; and (3) prospective clinical trials should incorporate MRD end points to obtain a fast reading on the efficacy of new regimens in patients with high-risk CAs. The importance of the third consideration is stressed by the fact that although the induction and consolidation regimens were optimized, patients with high-risk CAs continued to have lower rates of undetectable MRD and even of persistent MRD at very low levels (i.e.: 10−6 logarithmic range; Figure 1B). Of note, persistence of MRD in patients with high-risk CAs resulted in median PFS and OS of ∼2 and 3 years, respectively. This observation is clinically meaningful, because these patients should be offered alternative treatment strategies before inevitable disease progression.
There is expectation that detection, profiling, and targeting MRD may improve outcomes in cancer.42 It is noteworthy that our results revealed that potentially actionable mutations and CNAs may become undetectable at MRD stages, emphasizing that targeted therapies for MRD-positive patients may require reassessment of genetic alterations in sorted chemoresistant tumor cells. Although de facto characterization of MRD clones has been insurmountable because of the technical challenge of detecting and isolating rare tumor cells,42 our methodological approach can be a framework for new studies seeking to investigate the genomic landscape of MRD. Accordingly, we showed for the first time that patients with standard- vs high-risk CAs display variable levels of clonal selection at MRD stages, and reproduced preliminary findings suggesting the absence of common genetic events determining MRD resistance.17
There is a longstanding connection between quiescence in CSCs and how, because of these and other properties, they are (1) resistant to treatment, (2) become enriched at MRD stages, and (3) drive tumor relapse.43 Noteworthy, we were unable to identify small clusters of tumor cells with CSC signatures derived from other tumors43-46 in patients with newly diagnosed MM (Figure 6C-D). These findings further support the notion that drug resistance results from reprogramming of rare tumor cells with unrelated genetic background (ie, development of an MRD phenotype) and must be studied in treatment-resistant tumor cells. Accordingly, MRD tumor cells that persisted after VRD induction displayed a transcriptional profile reflecting potential adaptation to proteasome inhibition, suggesting that future studies in larger series from other clinical trials could generate knowledge of the mechanisms driving MRD resistance to specific drugs or regimens. Interestingly, these cells appeared to be in a quiescent transcriptional state. These results warrant further research, since metabolically inactive MRD tumor cells may not uptake 18F-FDG and render false-negative MRD results by positron emission tomography/computed tomography.47,48
Beyond the clinical significance of our findings, deep characterization of MRD clones could yield novel insight into molecular mechanisms of ultraresistance of treatment. Such knowledge may lead to the identification of as yet unknown vulnerabilities that eradicate persistent MRD. If therapies targeted against MRD clones are empowered to induce higher rates of undetectable MRD, it would be of paramount importance for prolonging survival of patients with standard- and high-risk MM, as shown in our study.
The data reported in this article have been deposited in the Gene Expression Omnibus (accession number GSE147165) and in the European Genome-Phenome Archive (accession number EGAS00001004558).
Original data are available in response to an e-mail request to the corresponding author.
The online version of this article contains a data supplement.
The publication costs of this article were defrayed in part by page charge payment. Therefore, and solely to indicate this fact, this article is hereby marked “advertisement” in accordance with 18 USC section 1734.
Acknowledgments
The authors thank all investigators and participating centers of the PETHEMA/GEM Cooperative Study Group; Alfonso Santiago and Carmen Carrero for supportive administration by PETHEMA; and Roberto Maldonado and Arturo Touchard for data management.
This study was supported by CIBERONC, Instituto de Salud Carlos III (grants CB16/12/00369, CB16/12/00400 and CB16/12/00284); Instituto de Salud Carlos III/Subdirección General de Investigación Sanitaria (grants FIS PI15/01956 and PI15/02049 and FIS PI15/02062, PI18/01709, and PI19/01451); Asociación Española Contra el Cáncer (grant GCB120981SAN and an Accelerator Award); Beca Leonardo a Investigadores y Creadores Culturales 2017; Fundación BBVA (Banco Bilbao Vizcaya Argentaria grant IN[17]_BBM_TRA_0236); the Qatar National Research Fund (grant QNRF; 7-916-3-237); the AACR-Millennium Fellowship in Multiple Myeloma Research (grant 15-40-38-PAIV); the Leukemia Research Foundation; the Black Swan Research Initiative of the International Myeloma Foundation; the Research Fellow Award from the Multiple Myeloma Research Foundation; and a European Research Council (ERC) 2015 starting grant (MYELOMANEXT).
Authorship
Contribution: I.G., J.S.M., and B.P. were responsible for the conception and design of the study; I.G., L.B., D.L.-A., A.V.-Z., D. Alignani, I.R., S.S., V.F., J.C., D. Alameda, J.J.G., S.R., and B.P. developed the study methodology; N.P., M.-T.C., L.C., M.-B.V., J.F.-M, N.C.G., M.-J.C, M.-L.M.R., R.G.-S., J.M.-L., A. Oriol, R.R., J.M.-S., R.M.-M., J.S., M.-T.H., J.d.l.R., I.K., J.-M.M., L.P., J.B., J.-A.M.-C., A. Orfao, L.R., M.-V.M., J.-J.L., J.B., J.S.M., and B.P. provided study samples and/or patients; I.G. and B.P. analyzed and interpreted the data; I.G. and B.P. wrote the manuscript; and all authors reviewed and approved the manuscript.
Conflict-of-interest disclosure: A. Oriol reports consultancy for and membership on boards of directors, advisory committees, or speakers bureaus of Amgen, Celgene, Takeda, and Janssen. R.R. reports consultancy for Amgen, Celgene, Janssen, and Takeda. J.M.M. reports membership on advisory committees of Gilead, Celgene, and Takeda. A. Orfao is one of the inventors on the EuroFlow-owned patent PCT/NL/2013/050420; US 62/072498 (methods, reagents, and kits for detecting minimal residual disease). This patent is licensed to Cytognos, which pays royalties to the EuroFlow Consortium. L.R. reports honoraria from Janssen, Celgene, Amgen, and Takeda. M.-V.M. reports consultancy for, honoraria from, and membership on boards of directors or advisory committees of Janssen, Celgene, GSK, Takeda, and Amgen. J.B. reports honoraria from Celgene, Amgen, and Janssen. J.S.M. reports consultancy for Bristol-Myers Squibb, Celgene, Novartis, Takeda, Amgen, MSD, Janssen, and Sanofi and membership on boards of directors and advisory committees of Takeda. J.-J.L. reports honoraria from and membership on boards of directors or advisory committees with Takeda, Amgen, Celgene, and Janssen. B.P. reports honoraria for lectures from and membership on advisory boards of Amgen, Bristol-Myers Squibb, Celgene, Janssen, Merck, Novartis, Roche, and Sanofi; unrestricted grants from Celgene, EngMab, Sanofi, and Takeda; and consultancy for Celgene, Janssen, and Sanofi. The remaining authors declare no competing financial interests.
A complete list of the investigators in the PETHEMA/GEM cooperative study group appears in the supplemental Appendix.
Correspondence: Bruno Paiva, Clínica Universidad de Navarra; CIMA, Av Pío XII 55, 31008 Pamplona, Spain; e-mail: bpaiva@unav.es.
