

Key Points
Integrin α6–mediated adhesion promotes the survival of chemotherapy-treated B-ALL.
Integrin α6 is evaluated as a therapeutic target for B-ALL.

Abstract
Resistance to multimodal chemotherapy continues to limit the prognosis of acute lymphoblastic leukemia (ALL). This occurs in part through a process called adhesion-mediated drug resistance, which depends on ALL cell adhesion to the stroma through adhesion molecules, including integrins. Integrin α6 has been implicated in minimal residual disease in ALL and in the migration of ALL cells to the central nervous system. However, it has not been evaluated in the context of chemotherapeutic resistance. Here, we show that the anti-human α6-blocking Ab P5G10 induces apoptosis in primary ALL cells in vitro and sensitizes primary ALL cells to chemotherapy or tyrosine kinase inhibition in vitro and in vivo. We further analyzed the underlying mechanism of α6-associated apoptosis using a conditional knockout model of α6 in murine BCR-ABL1+ B-cell ALL cells and showed that α6-deficient ALL cells underwent apoptosis. In vivo deletion of α6 in combination with tyrosine kinase inhibitor (TKI) treatment was more effective in eradicating ALL than treatment with a TKI (nilotinib) alone. Proteomic analysis revealed that α6 deletion in murine ALL was associated with changes in Src signaling, including the upregulation of phosphorylated Lyn (pTyr507) and Fyn (pTyr530). Thus, our data support α6 as a novel therapeutic target for ALL.
Introduction
Despite much progress over the last several decades, the overall survival of patients with acute lymphoblastic leukemia (ALL) has plateaued at approximately 40% for adults and approximately 90% for children.1,2 Bone marrow (BM) is the most frequent site of relapse for ALL,3,4 and BM relapse is associated with a worse prognosis than isolated extramedullary relapse.3,5 In vitro studies show that contact of leukemia cells with stromal cells promotes cell adhesion-mediated drug resistance (CAM-DR),6,7 which prevents the apoptosis of ALL cells8-10 and contributes to the survival of ALL cells.11 The term minimal residual disease (MRD) refers to a situation in which clinical remission has been achieved, but residual leukemia cells remain detectable by flow cytometry or polymerase chain reaction (PCR) assays.12,13 The identity of the adhesion molecules that mediate CAM-DR to sustain MRD despite treatment remains elusive.
Integrins, a family of glycoprotein adhesion cell surface receptors composed of α and β subunits,14,15 are critical for cell adhesion to the extracellular matrix (ECM) in the BM environment. Hematopoietic stem cells (HSCs) bind via integrin α6, also known as CD49f or Itga6 and hereafter called α6, to several isoforms of the ECM protein laminin, a heterotrimer of α, β, and γ chains.16 Notta et al16 showed that high expression of α6 indicates the presence of immature HSCs in cord blood. By using proteomics and transcriptomics approaches, α6 was identified as a leukemic stem cell (LSC) marker in acute myeloid leukemia (AML),17 and α6 was associated with drug resistance in AML.18 In ALL, α6 was detected by flow cytometry in B-cell ALL (B-ALL) patients19 and has been proposed for addition to the MRD flow cytometry marker panel for ALL.13 Importantly, α6-laminin interactions mediate the migration of ALL cells toward the cerebrospinal fluid in vitro, and xenografts of 2 B-ALL cell lines treated with a commercially available α6 integrin–neutralizing antibody (Ab) showed reduced central nervous system involvement.20 These findings indicate the need to functionally analyze the role of α6 in B-ALL in the context of resistance to chemotherapy. We hypothesized that α6 represents more than a disease biomarker, and therefore, we proceeded to study the effects of the functional loss of α6 in genetic and pharmacologic models of patient-derived (primary) B-ALL to assess whether α6 can be targeted to eradicate ALL.
Methods
Correlation of α6 gene expression on leukemic blasts with the clinical outcomes of B-ALL patients
Clinical and gene expression microarray data from 207 high-risk B-precursor ALL patients from the Children’s Oncology Group (COG) Clinical Trial P9906 were obtained from the Gene Expression Omnibus database (GSE11877).21 The patients were treated uniformly with a modified augmented Berlin-Frankfurt-Münster Study Group regimen, and individuals with very high-risk features (BCR-ABL1 or hypodiploidy) were excluded from the study. Cryopreserved residual pretreatment leukemia specimens were available for a representative cohort of 207 patients, including 131 BM and 76 peripheral blood (PB) samples. RNA was purified from these pretreatment diagnostic samples, which contained more than 80% blasts. The majority of patients (n = 191) had MRD, as assessed by flow cytometry; patients were defined as MRD-positive or MRD-negative at the end of induction therapy (day 29) using a threshold of 0.01% (the presence of ≥0.01% or <5% ALL cells was defined as MRD). The comparison of α6 expression in the MRD-positive and MRD-negative patient groups was performed using the Wilcoxon test in the R package (R Development Core Team; http://www.R-project.org/).
Patient samples
BM and PB samples from ALL patients were acquired in compliance with the institutional review board regulations of each institution. Informed consent for cell banking was obtained from all human patients. Leukemia cells were processed and cultured as previously described.22 Human studies were conducted in accordance with the Declaration of Helsinki.
De-adhesion of primary ALL and murine α6fl/flp210 cells
Primary B-ALL cells were cultured on human laminin (hlaminin) or murine OP9 stroma cells for 4 hours at 37°C in 5% CO2 and subsequently incubated overnight with anti-α6 Ab (clone P5G10, a gift from Elizabeth Wayner) or isotype control immunoglobulin G1 (IgG1) (BioLegend). Cells suspended in the supernatant were removed. Adherent cells were detached by pipetting with phosphate-buffered saline (PBS) and counted after trypan blue exclusion staining of dead cells. Murine α6fl/fl BCR-ABL1+p210 EmptyERT2 and CreERT2 cell production is described in the supplemental Data (available on the Blood Web site). Murine cells were treated with tamoxifen for the indicated number of days to induce deletion followed by plating and incubation of the cells on murine laminin (mlaminin) overnight.
In vitro drug assay
Human B-ALL cells plated on hlaminin-1 or OP9 cells were treated with vincristine, dexamethasone, and L-asparaginase (VDL) (vincristine; Hospira, Inc; dexamethasone, Fresenius Kabi USA; and L-asparaginase, KRS Global Technologies) at the indicated concentrations for indicated times, with anti-α6 Ab P5G10 (20 µg/mL),23 J8H (20 µg/mL) (Sanquin Blood Supply Foundation, Amsterdam, The Netherlands), or IgG1 control Ab (BioLegend). BCR-ABL+ ALL was treated with nilotinib at the indicated concentrations. Murine α6fl/fl BCR-ABL1+p210 EmptyERT2 and CreERT2 cells cultured on mlaminin were treated with tyrosine kinase inhibitor (TKI) nilotinib (0.02 µM or 0.2 µM) for 4 days. Viability was determined by using trypan blue exclusion staining; annexin V/7-aminoactinomycin D (7-AAD) or propidium iodide staining was performed as indicated. All cells were harvested from the wells, and the stromal cells were distinguished from the leukemia cells by their characteristic shape and larger sizes under a light microscope.
PCR and qRT-PCR
Genomic DNA from α6fl/flp210 EmptyERT2 or CreERT2 cells at 6 days after tamoxifen (Sigma-Aldrich) treatment was extracted using the DNeasy Blood & Tissue Kit (QIAGEN). For quantitative reverse transcription PCR (qRT-PCR), total RNA was extracted using RNeasy Plus Micro and Mini Kits (QIAGEN) and reverse-transcribed into complementary DNA (cDNA) by SuperScript III (Invitrogen). qRT-PCR was performed with an ABI7900HT real-time PCR system (Applied Biosystems). Primers are listed in supplemental Table 2.
Flow cytometry
Primary B-ALL cells were stained with Abs against CD19, CD45, and CD49f (BD Biosciences). Murine α6fl/flp210 EmptyERT2 and CreERT2 cells were stained with Abs against murine CD19, CD45, and CD49f (eBioscience). Apoptosis or cell viability was analyzed with annexin V-phycoerythrin (PE) or 7-AAD staining (BD Biosciences). Cell cycle analysis was performed using anti-bromodeoxyuridine (BrdU) allophycocyanin Abs. BrdU incorporation and DNA content (7-AAD) were measured in fixed and permeabilized cells (BD Biosciences). Abs and isotype controls are listed in supplemental Table 3.
siRNA transfection
Transfection with Lyn-, Fyn-, or Csk-specific or negative control ON-TARGETplus short interfering RNA (siRNA; scrambled siRNA [Scr]; Dharmacon) (50 nM) was performed using DharmaFect reagent according to the manufacturer’s instructions. The siRNAs were added to the cell culture media for the indicated times. Western blot analysis (data are shown for Csk siRNA but not for Lyn or Fyn siRNA) was performed to confirm the knockdown effects of the siRNAs on gene expression at 48 hours after transfection.
Western blotting
Cells were lysed in Mammalian Protein Extraction Reagent (M-PER) buffer (Thermo Fisher Scientific) supplemented with a 1% protease inhibitor cocktail (Thermo Fisher Scientific), and the proteins were separated by 4% to 12% sodium dodecyl sulfate polyacrylamide gel electrophoresis and electrotransferred to polyvinylidene difluoride membranes (Invitrogen) as described previously.24 The Abs are listed in supplemental Table 3.
Immunohistochemistry
BM biopsies from the patients were immersed in 4% paraformaldehyde (Sigma-Aldrich) for 4 hours and transferred into PBS before being embedded in paraffin. The 5-μm sections were stained with Abs against CD79a (Leica Biosystems) and CD49f/α6 (Abcam) and visualized by a Bond Polymer Refine Detection Kit (Leica Microsystems). The details are described in the supplemental Data. The Abs used are listed in supplemental Table 3.
Phosphoproteomic profiling of phosphotyrosines by high-pressure liquid chromatography
The phosphotyrosine proteomics analysis sample preparation was performed as described previously25 with some modifications that are described in the supplemental Data.
In vivo mobilization of human primary ALL cells
Primary ALL cells (2.5 × 10⁶ cells per mouse) were injected intravenously into NOD.Cg-PrkdcscidIl2rgtm1Wjl/SzJ (NSG) mice (The Jackson Laboratory). The mice then received 2 injections of 30 mg/kg P5G10, PBS, or the IgG1 control intravenously or intraperitoneally on day 27 and day 29 (LAX7R), day 38 and day 40 (TXL3), and day 18 and day 20 (PDX2) after ALL injection. The percentages of human CD45+ and CD19+ cells in the PB were analyzed by flow cytometry22 before, and at 1 and 3 days after P5G10 treatment. All animal studies were approved by the Institutional Animal Care and Use Committee at Children’s Hospital Los Angeles.
In vivo treatment of human ALL cells with anti-human α6 Ab (P5G10) and chemotherapy
Primary ALL LAX7R cells labeled with firefly luciferase (LUC) by transduction with pCCL-MNDU3-LUC viral supernatant were intravenously injected into sublethally irradiated (250 cGy) NSG mice (0.05 × 10⁶ cells per mouse).26 Vincristine (0.5 mg/kg) was administered once per week, and dexamethasone (10.5 mg/kg) and L-asparaginase (1500 IU/kg) were administered intraperitoneally 5 days per week.27 P5G10 (30 mg/kg) was administered intravenously once per week for 4 weeks.
In vitro and in vivo models of BCR-ABL1–transformed α6fl/fl ALL cells and bioluminescence imaging
Mononuclear cells (MNCs) from whole BM of α6fl/fl mice were isolated by red blood cell lysis using BD Lysis Buffer and were retrovirally transduced with BCR-ABL1 expression vectors25 in the presence of 10 ng/mL murine interleukin-7 (Peprotech) on retronectin (Takara Bio USA)–coated plates. After cytokine-independent proliferation, the BCR-ABL1–transformed α6fl/fl cells were transduced retrovirally with EmptyERT2 or CreERT2 followed by selection with puromycin (1 µg/mL) (Invitrogen). After selection with 1 µg/mL puromycin, α6 deletion was induced in vitro by the addition of 1.5 µM tamoxifen (Sigma-Aldrich). For the in vivo deletion of α6, 0.5 × 10⁶ luciferase-labeled α6fl/fl BCR-ABL1+ EmptyERT2 or CreERT2 ALL cells were injected via the tail vein into sublethally irradiated (250 cGy) NOD/SCID mice. α6 in vivo deletion was induced by daily administration of 100 to ∼150 mg/kg tamoxifen via oral gavage on days 3 to 8 and days 16 to 20 after leukemia cell transfer. For bioluminescent imaging, these cells were also transduced with a lentiviral vector (pCCL-MNDU3-LUC) encoding firefly luciferase and a neomycin selection marker in 24-well plates coated with retronectin (Takara Bio USA) for 48 hours as described previously.6 Additional details are provided in the supplemental Data.
Microarray and statistical analyses
Itga6 expression was analyzed in murine B-cell progenitor cells using ImmGen (http://rstats.immgen.org/Skyline_microarray/skyline.html). A Student t test was performed to compare the differences between 2 groups for the in vitro studies. One-way analysis of variance with post hoc analysis (Tukey test) was used to compare multiple groups. The log-rank test was used to evaluate differences in the median survival time (MST) for the in vivo studies. A value of P < .05 indicated a significant difference.
Results
High expression levels of α6 at the time of diagnosis predict positive MRD on day 29
To determine the significance of integrin α6 expression in ALL patients, we correlated the expression of α6 with clinical outcomes in 191 high-risk (excluding BCR/ABL1+ patients) B-ALL patients uniformly treated according to the regimen used by the COG P9906 clinical trial.21 Patients with ALL blasts with α6high expression at diagnosis were less likely to achieve deep remission by day 29 (MRD-positive) than patients with ALL blasts with α6low expression (MRD-negative) (P = .0005 and P = .001, respectively, for the 2 α6 probe sets) (Figure 1A). Interestingly, we found that BM biopsies with MRD-positive but not MRD-negative samples revealed α6 costaining with CD79a as a marker of B-lineage cells, confirming α6 as a marker of MRD in primary samples (Figure 1B). Cell surface expression of α6 was further analyzed by flow cytometry for 10 patient-derived (primary) B-ALL cells from patients with different karyotypes (supplemental Table 1). Virtually all ALL samples were α6+ (Figure 1C), but quantitative differences in mean fluorescence intensity were noted (Figure 1D). In contrast, CD19+ B cells from healthy BM donors had relatively low expression of α6. To examine this in more detail, we analyzed messenger RNA (mRNA) expression using ImmGen-Skyline with a data set from normal murine progenitor cells and found expression of α6 in B-lineage precursors (supplemental Figure 1A). We also performed more detailed flow cytometry analysis confirming the low expression of α6 on BM-derived murine precursor B cells of C57Bl6/J mice (mCD19+B220+CD25+CD43+)28 (8.17% ± 0.18%) (n = 2) and on normal human precursor B cells (hCD19+CD45+CD20–IgM–CD34–CD10+)29 (3.24% ± 1.21%) (n = 3) (supplemental Figure 1B-D).
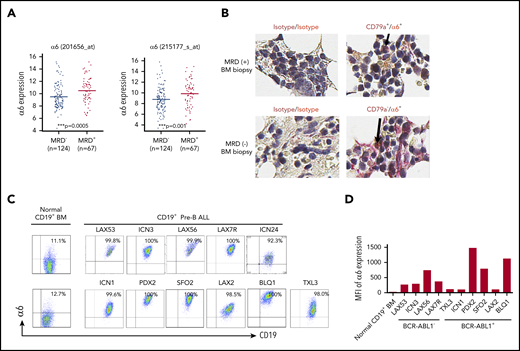
Integrin α6 is highly expressed in primary B-ALL. (A) Two probe sets for integrin α6 (ITGA6) in patients with MRD+ and MRD– ALL from COG study P9906 were analyzed. MRD was measured by flow cytometry at the end of induction therapy (day 29) using patients’ BM or PB samples. RNA was purified from 191 pretreatment diagnostic samples with more than 80% blasts (131 BM; 76 PB). The horizontal bars indicate the average levels of integrin α6 expression. P values were obtained by using the Wilcoxon test for each probe set. ***P = .0005 for probe 201656_at; ***P = .001 for probe 215177_s_at. (B) Immunohistochemical staining of isotype controls (left panel) or CD79a (brown) and α6 (red) expression (right panel) in MRD+ and MRD– biopsy specimens. Original magnification, ×630. (C) Representative dot plots of cell-surface α6 expression in B-ALL and normal BM CD19+ B-cell samples. One of 3 experiments is shown. (D) Representative mean fluorescence intensity (MFI) of α6 expression in CD19+ B-ALL and normal BM CD19+ B cells. One of 3 experiments is shown.
Integrin α6 is highly expressed in primary B-ALL. (A) Two probe sets for integrin α6 (ITGA6) in patients with MRD+ and MRD– ALL from COG study P9906 were analyzed. MRD was measured by flow cytometry at the end of induction therapy (day 29) using patients’ BM or PB samples. RNA was purified from 191 pretreatment diagnostic samples with more than 80% blasts (131 BM; 76 PB). The horizontal bars indicate the average levels of integrin α6 expression. P values were obtained by using the Wilcoxon test for each probe set. ***P = .0005 for probe 201656_at; ***P = .001 for probe 215177_s_at. (B) Immunohistochemical staining of isotype controls (left panel) or CD79a (brown) and α6 (red) expression (right panel) in MRD+ and MRD– biopsy specimens. Original magnification, ×630. (C) Representative dot plots of cell-surface α6 expression in B-ALL and normal BM CD19+ B-cell samples. One of 3 experiments is shown. (D) Representative mean fluorescence intensity (MFI) of α6 expression in CD19+ B-ALL and normal BM CD19+ B cells. One of 3 experiments is shown.
Integrin α6 blockade deadheres B-ALL cells from their ligand laminin-1 and stromal cells
To evaluate whether blocking α6-mediated adhesion can overcome CAM-DR, we first analyzed the adhesion of B-ALL cells to several laminins, which are ligands of α6, using an anti-α6 blocking Ab approach. We determined that 20 µg/mL P5G1023 saturates binding of α6 in primary ALL cells (supplemental Figure 2). A concentration of 50 µg/mL hlaminin-1, which is a specific ligand of α6, stimulated the adherence of approximately 90% of ALL cells (supplemental Figure 3); higher concentrations were not tested. We found that P5G10 deadhered ALL cells from 3 different hlaminin isoforms, namely, laminin-111 (hereafter referred to as laminin-1), laminin-511 (also known as laminin-10), and laminin-521 (also known as laminin-11) (supplemental Figure 4A-B), all of which are expressed in normal human BM.30 Because the level of deadhesion from different laminin isoforms was similar, laminin-1 was used for subsequent studies. Five primary ALL cell lines (LAX7R, LAX53, PDX2, TXL3, and SFO2) with different karyotypes (supplemental Table 1) were plated onto laminin-1 or OP9 cells. Murine stroma–derived OP9 cells were chosen because they support the viability and growth of primary ALL cells.22 The expression of mlaminin was confirmed by western blotting (supplemental Figure 4C). The P5G10 Ab23 deadhered all 8 ALL cell lines from laminin-1, unlike the control-treated ALL cells, but was less effective at deadhering the ALL cells from OP9 (Figure 2A-E). These experiments indicate that adhesion to OP9 cells is mediated through additional adhesion molecules besides α6 but that α6 is a relevant laminin receptor on ALL cells.
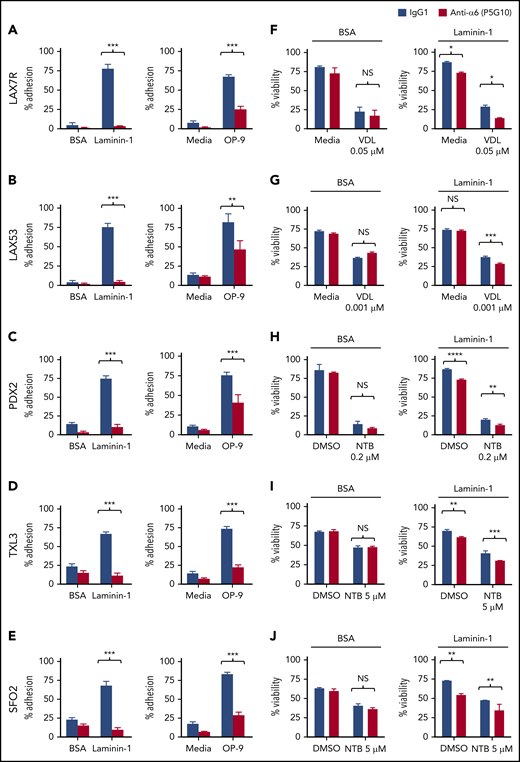

Integrin α6 blockade using the anti-α6 mAb P5G10 deadheres primary ALL cells and sensitizes the cells to chemotherapy. Six primary B-ALL cell lines (LAX7R, LAX53, PDX2, TXL3, SFO2, ICN24) and 2 B-ALL cell lines (Kasumi-2 and BEL-1) were preincubated with purified anti-human α6 Ab P5G10 (red bars) or its isotype control IgG1 (white bars) on plates coated with hlaminin-1. Adhesion of ALL cells to the bovine serum albumin (BSA) control, laminin-1 (A-E, left panels), cell culture media (media) or OP9 stroma cells (A-E, right panels) was assessed after overnight incubation. The viability of the ALL cells LAX7R (F), LAX53 (G), PDX2 (H), TXL3 (I), SFO2 (J), and ICN24 (K), plated on BSA (left panel) or laminin-1 (right panel) and treated with or without α6 blockade (P5G10) combined with nilotinib (NTB) or VDL for 2 days is shown. Viability of B-ALL cell lines Kasumi-2 (L) and BEL-1 cells (M) plated on BSA (left panel) or laminin-1 (right panel) treated with VDL combined with P5G10 for 3 days is shown. Three primary ALL cell lines, LAX7R (KRASG12V) (N), SFO2 (BCR-ABL1+) (O), and TXL3 (BCR-ABL1+) (P), were cocultured with OP9 cells and incubated with P5G10 (red bars) or its isotype control IgG1 (white bar) combined with NTB or VDL for 5 days. VDL was used at indicated concentrations (0.005 μM: 5 nM vincristine, 50 pM dexamethasone, and 0.0025 IU L-asparaginase; 0.001 μM: 1 nM vincristine, 10 pM dexamethasone, and 0.005 IU L-asparaginase; 0.05 μM: 50 nM vincristine, 500 pM dexamethasone, and 0.025 IU L-asparaginase). Viability was measured via the exclusion of dead cells based on trypan blue staining. LAX7R cells (Q-R) were plated on laminin-1 or OP9 cells and treated with the following antibodies: α6 function-blocking J8H (gray bars; 20 µg/mL), α6 adhesion- and function-blocking P5G10 (red bars; 20 µg/mL), or IgG1 (white bar; 20 µg/mL). Adhesion (overnight incubation) (Q) and viability (2 days incubation) (R) were determined by trypan blue exclusion staining. Means ± standard deviations are shown. One experiment of 3 is shown. Each experiment was performed in triplicate. *P < .05; **P < .01; ***P < .001 by 1-way analysis of variance (ANOVA) with post hoc analysis (Tukey test). DMSO, dimethyl sulfoxide; NS, not significant.
Integrin α6 blockade using the anti-α6 mAb P5G10 deadheres primary ALL cells and sensitizes the cells to chemotherapy. Six primary B-ALL cell lines (LAX7R, LAX53, PDX2, TXL3, SFO2, ICN24) and 2 B-ALL cell lines (Kasumi-2 and BEL-1) were preincubated with purified anti-human α6 Ab P5G10 (red bars) or its isotype control IgG1 (white bars) on plates coated with hlaminin-1. Adhesion of ALL cells to the bovine serum albumin (BSA) control, laminin-1 (A-E, left panels), cell culture media (media) or OP9 stroma cells (A-E, right panels) was assessed after overnight incubation. The viability of the ALL cells LAX7R (F), LAX53 (G), PDX2 (H), TXL3 (I), SFO2 (J), and ICN24 (K), plated on BSA (left panel) or laminin-1 (right panel) and treated with or without α6 blockade (P5G10) combined with nilotinib (NTB) or VDL for 2 days is shown. Viability of B-ALL cell lines Kasumi-2 (L) and BEL-1 cells (M) plated on BSA (left panel) or laminin-1 (right panel) treated with VDL combined with P5G10 for 3 days is shown. Three primary ALL cell lines, LAX7R (KRASG12V) (N), SFO2 (BCR-ABL1+) (O), and TXL3 (BCR-ABL1+) (P), were cocultured with OP9 cells and incubated with P5G10 (red bars) or its isotype control IgG1 (white bar) combined with NTB or VDL for 5 days. VDL was used at indicated concentrations (0.005 μM: 5 nM vincristine, 50 pM dexamethasone, and 0.0025 IU L-asparaginase; 0.001 μM: 1 nM vincristine, 10 pM dexamethasone, and 0.005 IU L-asparaginase; 0.05 μM: 50 nM vincristine, 500 pM dexamethasone, and 0.025 IU L-asparaginase). Viability was measured via the exclusion of dead cells based on trypan blue staining. LAX7R cells (Q-R) were plated on laminin-1 or OP9 cells and treated with the following antibodies: α6 function-blocking J8H (gray bars; 20 µg/mL), α6 adhesion- and function-blocking P5G10 (red bars; 20 µg/mL), or IgG1 (white bar; 20 µg/mL). Adhesion (overnight incubation) (Q) and viability (2 days incubation) (R) were determined by trypan blue exclusion staining. Means ± standard deviations are shown. One experiment of 3 is shown. Each experiment was performed in triplicate. *P < .05; **P < .01; ***P < .001 by 1-way analysis of variance (ANOVA) with post hoc analysis (Tukey test). DMSO, dimethyl sulfoxide; NS, not significant.
To determine the effect of the inhibition of α6 function on the ability of ALL cells to resist drug treatment, 6 primary B-ALL cell lines (LAX7R, LAX53, PDX2, TXL3, SFO2, ICN24) and 2 B-ALL cell lines (Kasumi-2 and BEL-1) were plated on bovine serum albumin control or laminin-1 and then treated for 2 days with VDL or with nilotinib in Philadelphia chromosome-positive (Ph+) ALL (BCR-ABL1+) with or without P5G10 or its control isotype Ab (IgG1). Four of the 8 ALL cell lines had already shown decreased viability after treatment with P5G10 alone (Figure 2 F,H-J,K-M). Cells from all 8 patients with ALL showed statistically significant but moderate decrease in viability when P5G10-mediated α6 blockade was combined with VDL or TKI treatment compared with treatment with VDL or TKI alone (Figure 2F-J). P5G10 treatment also decreased the viability of ALL cells plated on murine stroma OP9 cells treated in combination with chemotherapy (VDL) or nilotinib (Figure 2N-P).
To determine whether the physical deadhesion associated with P5G10 induces apoptosis or whether apoptosis is independent of deadhesion, we used J8H, which is another anti-human α6 signaling function-blocking Ab.31 LAX7R ALL cells that were adherent to laminin-1 or OP9 cells were almost fully deadhered by P5G10 and were markedly less deadhered by J8H (Figure 2Q), but both anti-α6 Abs decreased the viability of ALL cells compared with that of controls (Figure 2R), indicating that α6-associated apoptosis is induced with 2 different α6 Abs and is partly independent of deadhesion.
Integrin signaling has previously been shown to promote the survival of pre-B-ALL cells by modulating PI3K signaling and the expression of apoptotic regulators, including Bcl2, caspases 3 and 7, and IAP family members.32 To identify the mechanism that underlies apoptosis associated with integrin α6 blockade, LAX7R cells were treated with P5G10 or IgG1 for 1 hour before 48 hours of exposure to VDL or vehicle control (supplemental Figure 5 A-B). Interestingly, the levels of the antiapoptotic IAP family member survivin26 were increased by chemotherapy treatment but reduced by P5G10 treatment, and the levels of cleaved caspase 3 or 7 were not (supplemental Figure 5C).
Integrin α6 blockade eradicates leukemia when combined with chemotherapy in vivo
Next, we determined whether P5G10 can restore the chemotherapy sensitivity of leukemia cells in vivo. NSG mice were treated 3 days after the injection of luciferase-labeled LAX7R cells with 4 once-per-week injections of anti-human α6 P5G10 monoclonal Ab (mAb) or saline with or without VDL (Figure 3A). Mice treated with P5G10 alone survived at rates similar to those of control mice (PBS MST, 39 days vs P5G10 MST, 31 days; P = .65) (Figure 3B). Mice treated with chemotherapy relapsed shortly after the end of treatment and succumbed to leukemia. In marked contrast, 2 of the 5 mice treated with a combination of chemotherapy and P5G10 survived and were apparently disease free (P = .004 compared with VDL-only treatment). In vivo bioluminescence assays also demonstrated a significant decrease in leukemia progression induced by the combination of P5G10 and VDL compared with that induced by VDL alone (Figure 3C). Three animals treated with the combination that succumbed to leukemia or were euthanized on day 185 or day 186 after leukemia injection had BM that was negative for human CD19, according to flow cytometry (Figure 3D). These data indicate that specific treatment with the P5G10 Ab combined with chemotherapy could significantly prolong the survival of leukemic mice and had the potential to induce long-term remission. To exclude nonspecific effects of Abs, different control treatments (PBS, Ig, and IgG1) were administered intraperitoneally once per week for 2 weeks to leukemic mice. Leukemia progression monitored by bioimaging and weight development were similar among control groups (supplemental Figure 6A-D).
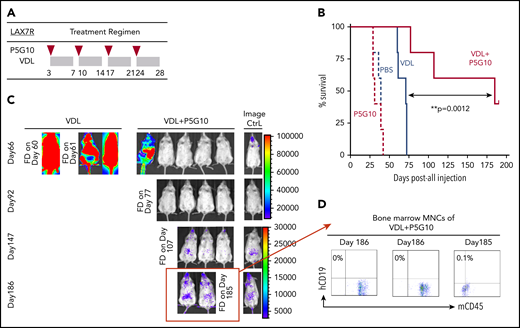
α6 blockade sensitizes leukemia cells to chemotherapy in vivo. (A) The treatment regimen used in NSG mice injected with primary B-ALL cells (LAX7R) consisted of the intraperitoneal administration of PBS (n = 5); an α6-blocking Ab (P5G10) (n = 5) (administered intraperitoneally on days 3, 10, 17, and 24 after leukemia injection as indicated by the red triangles); vincristine (10.5 mg/kg), dexamethasone (8 mg/kg), and L-asparaginase (800 IU/kg) (VDL) (n = 5) (as indicated by the gray rectangles); or VDL + P5G10 (n = 5). (B) The Kaplan-Meier survival curve was analyzed, and the MST was calculated for each group: PBS (MST = 39 days), P5G10 (MST = 31 days), VDL (MST = 71 days), VDL + P5G10 (MST = 185 days). (C) Bioluminescence imaging of mice on days 66, 92, 147, and 186 after leukemia cell transfer. A mouse with no leukemia cell injection treated only with luciferin at the time of imaging was included as a background control (Image Ctrl) (right panel). One experiment is shown. (D) Flow cytometric analysis of human (h) CD19 and murine (m) CD45 in BM mononuclear cells (MNCs) from 3 animals euthanized on day 186 after injection or found dead (FD) on day 185 after injection.
α6 blockade sensitizes leukemia cells to chemotherapy in vivo. (A) The treatment regimen used in NSG mice injected with primary B-ALL cells (LAX7R) consisted of the intraperitoneal administration of PBS (n = 5); an α6-blocking Ab (P5G10) (n = 5) (administered intraperitoneally on days 3, 10, 17, and 24 after leukemia injection as indicated by the red triangles); vincristine (10.5 mg/kg), dexamethasone (8 mg/kg), and L-asparaginase (800 IU/kg) (VDL) (n = 5) (as indicated by the gray rectangles); or VDL + P5G10 (n = 5). (B) The Kaplan-Meier survival curve was analyzed, and the MST was calculated for each group: PBS (MST = 39 days), P5G10 (MST = 31 days), VDL (MST = 71 days), VDL + P5G10 (MST = 185 days). (C) Bioluminescence imaging of mice on days 66, 92, 147, and 186 after leukemia cell transfer. A mouse with no leukemia cell injection treated only with luciferin at the time of imaging was included as a background control (Image Ctrl) (right panel). One experiment is shown. (D) Flow cytometric analysis of human (h) CD19 and murine (m) CD45 in BM mononuclear cells (MNCs) from 3 animals euthanized on day 186 after injection or found dead (FD) on day 185 after injection.
Integrin α6 blockade has the potential to cause modest mobilization of leukemia cells to PB
Integrin blockade can mobilize ALL cells to migrate to the PB, as shown by integrin α4 inhibition in ALL.22 To determine whether α6 blockade functionally induced the mobilization of leukemia cells to migrate to the PB, TXL3 and PDX2 (both BCR-ABL1+) and LAX7R (KRASG12V) patient-derived ALL cells were injected into NSG mice. On day 1 after treatment with P5G10, 2 (LAX7R, PDX2) of 3 mice treated with P5G10 did not show an increase in leukemia cells in the PB compared with the number present before P5G10 treatment (day 0) or compared with the number in control recipient mice (supplemental Figures 7 and 8), 1 of 3 mice did (TXL3). On day 3 after treatment with P5G10, 1 (LAX7R) of 3 mice treated with P5G10 did not show an increase in leukemia cells in the PB (supplemental Figures 7 and 8), but 2 of 3 mice (TXL3, PDX2) did show modest mobilization of leukemia cells to the PB.
α6 deletion deadheres BCR-ABL1+ leukemia cells and induces their apoptosis
To further investigate the pro-survival function of α6, we made use of BCR-ABL1 (p210) ERT2 of α6fl/fl33 B-ALL cells (supplemental Figures 9 and 10), in which the α6 protein can be ablated by tamoxifen treatment. When ERT2-Cre x α6fl/fl B-ALL cells were treated with tamoxifen, α6 expression was lost, as measured by flow cytometric analysis of α6 surface expression (Figure 4A-B) and genomic PCR (Figure 4C). This loss corresponded to cell cycle inhibition, as shown by the decreased percentage of cells in S-phase and the increased percentage of cells in the G0/G1 and G2/M phases compared with that in α6 WT cells (Figure 4D). In concordance with this result, deletion of α6 also caused decreases in proliferation (supplemental Figure 11A-B). As a non-α6fl/fl gene control, we previously showed in a conditional knockout model of murine integrin α4fl/fl BCR/ABL1+ CreERT2 leukemia that tamoxifen treatment did not lead to apoptosis in vitro,22 and we have repeated this experiment in vitro (supplemental Figure 12A-B) to demonstrate that Cre activation in α4fl/fl cells does not cause apoptosis. Therefore, Cre deletion is not generally associated with apoptosis induced from deletion-induced toxicity, supporting the conclusion that α6 deletion is specifically associated with apoptosis.
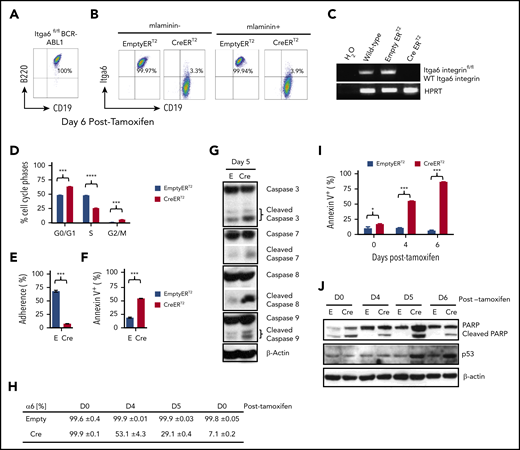
Integrin α6 deletion induces the deadhesion and apoptosis of murine BCR-ABL1+ (p210) ALL cells. (A) Immunophenotype of murine BCR-ABL1 (p210)+ ALL cells. (B) Deletion of α6 induced by tamoxifen (1.5 μM) was confirmed by flow cytometry 6 days after tamoxifen treatment. Left panel: cells not plated on mlaminin-1; right panel: cells plated on mlaminin+. (C) Deletion of α6 was confirmed by genomic PCR. Hypoxanthine-guanine phosphoribosyltransferase (HPRT) was used as a PCR DNA and loading control. (D) Cell cycle analysis of CreERT2 and EmptyERT2 cells on day 5 after deletion by bromodeoxyuridine flow cytometry. ***P < .001 and ****P < .0001 by 1-way ANOVA with post hoc analysis (Tukey test). (E) Percentage of adherent CreERT2 and EmptyERT2 cells on mlaminin-coated plates on day 5. ***P < .001 by Student t test. (F) Apoptosis analysis by annexin V and 7-AAD staining of CreERT2 and EmptyERT2 cells at day 5 after deletion. ***P < .001 by Student t test. (G) Western blot of cleaved caspases 3, 7, 8, and 9 in CreERT2 and EmptyERT2 cell lysates on day 5 after deletion. β-actin, loading control. (H) Percentage of α6 and (I) annexin V expression in CreERT2 and EmptyERT2 cells at various time points after α6 deletion, as determined by flow cytometry. Mean ± standard deviation is shown. *P < .05 and ***P < .001 by 1-way ANOVA with post hoc analysis (Tukey test). (J) Western blot of cleaved poly (ADP-ribose) polymerase (PARP) and p53 in CreERT2 and EmptyERT2 cells on various days (days 0, 4, 5, and 6) after tamoxifen-induced α6 deletion. β-actin, loading control. One of 3 experiments is shown.
Integrin α6 deletion induces the deadhesion and apoptosis of murine BCR-ABL1+ (p210) ALL cells. (A) Immunophenotype of murine BCR-ABL1 (p210)+ ALL cells. (B) Deletion of α6 induced by tamoxifen (1.5 μM) was confirmed by flow cytometry 6 days after tamoxifen treatment. Left panel: cells not plated on mlaminin-1; right panel: cells plated on mlaminin+. (C) Deletion of α6 was confirmed by genomic PCR. Hypoxanthine-guanine phosphoribosyltransferase (HPRT) was used as a PCR DNA and loading control. (D) Cell cycle analysis of CreERT2 and EmptyERT2 cells on day 5 after deletion by bromodeoxyuridine flow cytometry. ***P < .001 and ****P < .0001 by 1-way ANOVA with post hoc analysis (Tukey test). (E) Percentage of adherent CreERT2 and EmptyERT2 cells on mlaminin-coated plates on day 5. ***P < .001 by Student t test. (F) Apoptosis analysis by annexin V and 7-AAD staining of CreERT2 and EmptyERT2 cells at day 5 after deletion. ***P < .001 by Student t test. (G) Western blot of cleaved caspases 3, 7, 8, and 9 in CreERT2 and EmptyERT2 cell lysates on day 5 after deletion. β-actin, loading control. (H) Percentage of α6 and (I) annexin V expression in CreERT2 and EmptyERT2 cells at various time points after α6 deletion, as determined by flow cytometry. Mean ± standard deviation is shown. *P < .05 and ***P < .001 by 1-way ANOVA with post hoc analysis (Tukey test). (J) Western blot of cleaved poly (ADP-ribose) polymerase (PARP) and p53 in CreERT2 and EmptyERT2 cells on various days (days 0, 4, 5, and 6) after tamoxifen-induced α6 deletion. β-actin, loading control. One of 3 experiments is shown.
Adhesion was significantly decreased in α6-deleted cells compared with that in non-deleted control cells by day 5 after tamoxifen treatment (Figure 4E). We observed a further decrease in the cell viability of α6-deleted leukemia cells, as determined by flow cytometry (Figure 4F). Western blotting of α6-deleted cells compared with that of α6-competent cells showed a marked increase in apoptotically cleaved caspases 3, 7, 8, and 9 on day 5 after tamoxifen treatment (Figure 4G). When we analyzed the time course of α6-deleted cells on days 4, 5, and 6 after tamoxifen-induced deletion (Figure 4H), we observed progressive apoptosis over time (Figure 4I) with an increase in cleaved poly (ADP-ribose) polymerase and p53 expression (Figure 4J).
α6 deletion is associated with Src signaling changes in BCR-ABL1+ leukemia
Few studies have focused on signal transduction downstream of integrin α6. Because there is an abundance of literature on Src family kinases and other tyrosine kinases, which play important roles in the signaling of integrins,34-38 we investigated specific changes in total tyrosine phosphorylation in α6-deleted cells. As shown in Figure 5A, cells deleted for α6 showed increased signaling from pTyr-containing proteins of 50 to 60 kDa (red lines) within 24 hours compared with empty vector x α6fl/fl B-ALL cells. To identify the affected proteins, we performed proteomic pTyr analysis and identified increased tyrosine phosphorylation of the docking protein CASL, which assembles signal transduction complexes that include integrins and decreases the phosphorylation of specific Y residues in Src family kinase substrates39 such as SHIP2 (Y623) (at the 16-hour time point), GSK3β (Y216)40 (at both the 16-hour and 3-day time points), Abl (Y413), Crkl (Y92), and Stat5A (90Y) (Figure 5B). Interestingly, increases were noted in pY508 and pY531 in the nonreceptor hematopoietic tyrosine kinases Lyn and Fyn at both the 16-hour and 3-day time points compared with those in non-α6-deleted ALL cells (Figure 5B). Lyn and Fyn are approximately 60 kDa, and these tyrosine residues are significant in that their phosphorylation inhibits the activity of these tyrosine kinases.41-43 Thus, kinases with increased phosphorylation of these residues have reduced tyrosine kinase activity. To further address the significance of Lyn and Fyn, α6 wild-type (nontamoxifon-treated ERT2-Cre α6fl/fl) B-ALL cells were treated with siRNA against Lyn and Fyn. Serum starvation of α6 wild-type murine ALL cells, which makes such cells quiescent, reduced the levels of the phosphorylation of Y418 of Src and increased those of Y507 of Lyn and Y530 of Fyn, which is consistent with downregulation of Src and Lyn tyrosine kinase activity (supplemental Figure 13A). Stimulation of the cells with serum reversed this downregulation, resulting in a decrease in Lyn pY507 and an increase in Src pY418. Interestingly, the activation of both kinases was reduced when cells represented a mixed population with clones that carry α6 deletions and others without deletion using a short-term treatment (16 hours to avoid increasing cell death) with tamoxifen.

Integrin α6 deletion in murine BCR-ABL1+ (p210) B-ALL cells affects Src signaling. (A) α6fl/fl BCR-ABL1+ (p210) x CreERT2 (Cre) and x EmptyERT2 (Emy) cells treated with tamoxifen (TAM) for 24 hours followed by western blot analysis using an anti-phosphotyrosine Ab (clone 4G10). One of 3 experiments is shown. (B) Phosphotyrosine proteomics analysis was performed on murine cells treated for 16 hours or 3 days with tamoxifen. The fold changes (FCs) in the selected phosphotyrosine proteins were plotted. One experiment is shown.
Integrin α6 deletion in murine BCR-ABL1+ (p210) B-ALL cells affects Src signaling. (A) α6fl/fl BCR-ABL1+ (p210) x CreERT2 (Cre) and x EmptyERT2 (Emy) cells treated with tamoxifen (TAM) for 24 hours followed by western blot analysis using an anti-phosphotyrosine Ab (clone 4G10). One of 3 experiments is shown. (B) Phosphotyrosine proteomics analysis was performed on murine cells treated for 16 hours or 3 days with tamoxifen. The fold changes (FCs) in the selected phosphotyrosine proteins were plotted. One experiment is shown.
We also examined the connection between the Src family kinases and α6 in a different setting using human ALL cells cocultured with OP9 cells as a stimulus and the α6 function-blocking mAb P5G10 (supplemental Figure 13B-C). In this system, plating ALL cells on OP9 cells caused an increase in the levels of total Src protein, but cells treated with P5G10 had reduced Src levels. Taken together, these results in human and murine B-ALL cells implicate Src family kinases in the decrease in cell viability that accompanies α6 deletion. In addition, we tested whether inhibition of Csk using siRNA rescued the apoptosis induced by P5G10 (supplemental Figure 14A-B). LAX7R cells were transfected with CSK siRNA and treated with either P5G10 or an IgG1 control 1 hour later. After 3 days, the ALL cells were harvested and analyzed by flow cytometry to measure apoptosis, and the protein lysates were analyzed by western blotting. Interestingly, P5G10 induced apoptosis in the cells treated with scrambled control, but there was no P5G10-associated induction of apoptosis after Csk siRNA treatment. This indicates that inhibition of Csk rescued the P5G10 induced apoptosis.
To test whether Src inhibitors can phenocopy the apoptotic effects of P5G10, primary B-ALL cells (ICN24) were treated with different doses of the 3 different Src inhibitors44-46 for 4 days after plating on OP9 cells (supplemental Figure 15). Cell viability was not affected (supplemental Figure 15A), but all 3 tested Src inhibitors decreased proliferation, as illustrated by the GR50 values (growth rate is reduced by half)47 determined on the basis of the inhibition of 50% of the proliferation of ICN24 cells (supplemental Figure 15 B-C) and the decrease in Src levels (supplemental Figure 15D). Thus, Src inhibitors do not induce apoptosis in a manner similar to that of P5G10 but they do reduce α6 protein expression.
α6 deletion sensitizes murine leukemia cells to tyrosine kinase inhibition
To determine the role of integrin α6 in chemotherapy resistance, BCR-ABL-1+α6fl/fl EmptyERT2 or CreERT2 cells were treated with tamoxifen to induce α6 deletion simultaneously with nilotinib treatment (0.02 and 0.2 μM) or the dissolvent dimethyl sulfoxide (0.1%) as a control. Deletion of α6 (Figure 6A; supplemental Figure 16) markedly decreased the resistance of CreERT2 cells to nilotinib compared with the resistance of EmptyERT2 cells, as demonstrated by the percentage of apoptotic leukemia cells on day 5 after treatment with nilotinib (0.02 μM) (94.9% ± 1.1% vs 70.3% ± 1.7%; P < .05) (Figure 6B), indicating that α6 deletion sensitizes murine leukemia cells to tyrosine kinase inhibition.
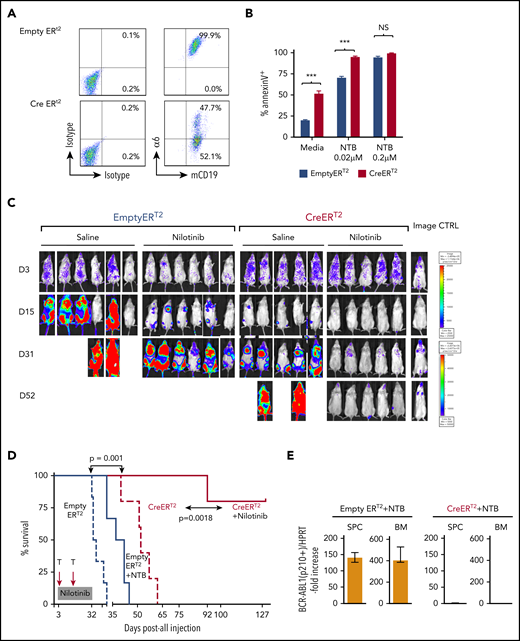

α6 deletion sensitizes murine leukemia cells to tyrosine kinase inhibition in vitro, and the combination of the in vivo deletion of α6 with tyrosine kinase inhibition eradicates leukemia cells. α6fl/fl BCR-ABL1+ (p210) CreERT2 and EmptyERT2 cells were plated onto tissue culture plates (without further coating) and treated with tamoxifen (1.5 μM) and nilotinib (0.02 μM or 0.2 μM) for 5 days. (A) Deletion of α6 was determined by flow cytometry. (B) Cell viability was determined by annexin V detection using flow cytometry. The y-axis indicates the percentage of annexin V–positive cells. Mean ± standard deviation is shown. ***P < .001. (C) Bioluminescence imaging of mice injected with luciferase-labeled murine α6fl/fl BCR-ABL1+ CreERT2 and EmptyERT2 ALL cells followed by treatment with tamoxifen to delete α6 with or without nilotinib on the indicated days after ALL cell injection. One in vivo experiment is shown. (D) Kaplan-Meier survival analysis for the MST determination in each group: EmptyERT2 (n = 6), MST = 27 days; CreERT2 (n = 5), MST = 54.5 days; EmptyERT2 + nilotinib (n = 6), MST = 39.5 days; CreERT2 + nilotinib (n = 5), MST = undefined because 4 of 5 mice remained alive until the end of follow-up. *P = .0001, log-rank test. (E) Detection of murine BCR-ABL1 (p210+) cells in spleen cells (SPCs) or BM by qRT-PCR. Error bars are from the 2 comparison groups (Empty ERT2 + NTB vs CRE ERT2 + NTB). (F) α6 deletion was confirmed by flow cytometry in BM cells from leukemic mice injected with α6fl/fl BCR-ABL1+ CreERT2 or EmptyERT2 cells. Donor white blood cells (WBCs) were labeled with CD45.2+. (G) Flow cytometric analysis of WBCs from recipients of α6fl/fl BCR-ABL1+ CreERT2 or EmptyERT2 cells treated with nilotinib. Donor WBCs were CD45.2+, and recipient WBCs were CD45.1+. (H) Genomic PCR of BCR-ABL1 was performed on cells isolated from the spleen and BM of mice treated with EmptyERT2 + nilotinib (NTB) and CreERT2 + NTB. Murine HPRT (mHPRT) was used as an internal PCR DNA control.
α6 deletion sensitizes murine leukemia cells to tyrosine kinase inhibition in vitro, and the combination of the in vivo deletion of α6 with tyrosine kinase inhibition eradicates leukemia cells. α6fl/fl BCR-ABL1+ (p210) CreERT2 and EmptyERT2 cells were plated onto tissue culture plates (without further coating) and treated with tamoxifen (1.5 μM) and nilotinib (0.02 μM or 0.2 μM) for 5 days. (A) Deletion of α6 was determined by flow cytometry. (B) Cell viability was determined by annexin V detection using flow cytometry. The y-axis indicates the percentage of annexin V–positive cells. Mean ± standard deviation is shown. ***P < .001. (C) Bioluminescence imaging of mice injected with luciferase-labeled murine α6fl/fl BCR-ABL1+ CreERT2 and EmptyERT2 ALL cells followed by treatment with tamoxifen to delete α6 with or without nilotinib on the indicated days after ALL cell injection. One in vivo experiment is shown. (D) Kaplan-Meier survival analysis for the MST determination in each group: EmptyERT2 (n = 6), MST = 27 days; CreERT2 (n = 5), MST = 54.5 days; EmptyERT2 + nilotinib (n = 6), MST = 39.5 days; CreERT2 + nilotinib (n = 5), MST = undefined because 4 of 5 mice remained alive until the end of follow-up. *P = .0001, log-rank test. (E) Detection of murine BCR-ABL1 (p210+) cells in spleen cells (SPCs) or BM by qRT-PCR. Error bars are from the 2 comparison groups (Empty ERT2 + NTB vs CRE ERT2 + NTB). (F) α6 deletion was confirmed by flow cytometry in BM cells from leukemic mice injected with α6fl/fl BCR-ABL1+ CreERT2 or EmptyERT2 cells. Donor white blood cells (WBCs) were labeled with CD45.2+. (G) Flow cytometric analysis of WBCs from recipients of α6fl/fl BCR-ABL1+ CreERT2 or EmptyERT2 cells treated with nilotinib. Donor WBCs were CD45.2+, and recipient WBCs were CD45.1+. (H) Genomic PCR of BCR-ABL1 was performed on cells isolated from the spleen and BM of mice treated with EmptyERT2 + nilotinib (NTB) and CreERT2 + NTB. Murine HPRT (mHPRT) was used as an internal PCR DNA control.
Combining α6 deletion with tyrosine kinase inhibition eradicates murine leukemia
To determine the effect of α6 deletion on leukemia progression in vivo, α6-competent α6fl/fl BCR/ABL1+p210 CreERT2+ or EmptyERT2 cells were lentivirally labeled with luciferase and transferred into NSG mice. After 3 days, α6 deletion was induced by administering tamoxifen to all animals with 2 cycles of 5 days each. Bioluminescence imaging showed a significant delay in the progression of α6-deleted leukemia cells compared with that of α6-competent cells (Figure 6C, saline-treated animals) with an MST of 27 days compared with 54.5 days after leukemia cell injection (log-rank test P = .0021). Moreover, in vivo deletion of α6 in combination with nilotinib significantly prolonged survival after leukemia cell transfer, because recipients of α6-competent cells died of leukemia with an MST of 39.5 days despite nilotinib treatment, whereas nilotinib-treated recipients of α6-ablated leukemia cells survived (P = .0018) (Figure 6D). The deletion status of α6 was determined when the animals were euthanized. This analysis confirmed that α6 had been deleted in most cells (Figure 6E-F). Animals were euthanized on day 127 after leukemia injection for the analysis of MRD. We found no detectable BCR-ABL1 mRNA expression by flow cytometry (Figure 6G) or BCR-ABL1 representation in genomic DNA by PCR (Figure 6H) in splenic cells and BM cells. Similar results were obtained in a second experiment, in which in vivo deletion of α6 was induced on day 6 after leukemia injection to account for possible effects on engraftment contributing to the survival benefit (supplemental Figure 17).
Discussion
Our study identified α6 as a marker of HSCs,16 and its expression was also recently reported in B-ALL cells.20 Our results clearly show that all the cells in the B-ALL populations tested, including those with different genetic lesions such as BCR/ABL1 fusions, KRASG12V, and MLL rearrangements, express high levels of α6 on their surfaces. On the basis of our analysis of α6 expression in and on normal precursor B cells in healthy human and mouse BM (supplemental Figure 1A-D), such high α6 levels on malignant precursor B cells are abnormal. Because we also found a correlation between increased α6 mRNA levels and the detection of MRD after induction chemotherapy in human patient samples, high expression of α6 is likely to provide a benefit to the B-ALL cells that express it. One aspect of this benefit may be the ability to engage with specific elements in protective BM niches. Our results using function-blocking mAbs and human ALL cells demonstrated that B-ALL cells adhere to different laminins via α6. This shows that the integrin is fully functional as an adhesion molecule on such cells, which is highly significant because niches in the BM are rich in laminins.48 We were also able to demonstrate that the blocking of α6 with P5G10 impaired adhesion to OP9 BM stromal cells, so it is possible that such stromal cells secrete laminin-rich ECMs to which the ALL cells adhere, although other α6-mediated contacts may also take place. In addition, ALL cells may contact OP9 cells through other integrins such as integrin α4.15,22 Our results demonstrate that α6-mediated adhesion to laminin or OP9 cells protects different ALL cells from treatment with both VDL conventional chemotherapy and a targeted TKI. This further supports the presence of a link between high α6 expression and MRD persistence. Moreover, it has been reported that α6-laminin interactions mediate the migration of ALL cells toward the cerebrospinal fluid in vitro.20 Our results suggest that mAbs against α6 could therefore also be useful in preventing CNS relapse.
B-ALL cells can express multiple integrins such as α4 and α6 on the same cell, which suggests that these integrins have distinct functions. One obvious difference is that α4 and α6, as part of α4β1 or α6β1 integrins, engage with distinct extracellular ligands (fibronectin and VCAM-1 vs laminin). Both α4 and α6 have been shown to play distinct roles in homing of normal HSCs.49 Differential ECM protein expression may lead to protection of ALL cells via different CAM-DR mechanisms. Here, we show an additional striking difference: the deletion of integrin α6 in murine B-ALL cells causes apoptosis, whereas this does not occur in a similar experimental setup when integrin α4 is deleted (Hsieh et al22 ; supplemental Figure 12).
Thus, our experiments show that Itga6 is much more than a mere adhesive integrin; its loss profoundly affected the phenotype of B-ALL cells and resulted in an accumulation of cells in G2/M and G0/G1 phases, which is consistent with a corresponding increase in p53 levels.50 In addition, caspase activation with apoptosis is associated with the long-term loss of α6. The moderate effect of α6 functional inhibition by mAbs on the viability of B-ALL cells adhering to hlaminin-1 in the presence of normal serum is consistent with the lack of induction of acute caspase cleavage in these cells. However, we found that the expression of the anti-apoptotic IAP family member survivin was induced by chemotherapy treatment and decreased by treatment with P5G10 in LAX7R cells (supplemental Figure 6C), which suggests a specific role for survivin in α6-mediated survival, which may not be the sole mechanism.
Intracellular signal transduction complexes that are engaged by integrins include Src family kinase (SFK) members, and our experiments provide evidence that the genetic ablation of α6 is correlated with the downregulation of SFK levels and their activation in BCR/ABL1+ ALL cells. Consistent with the link between SFK members and α6 function, we found that mice transplanted with BCR/ABL1 kinase-driven leukemia cells, in which α6 was deleted in vivo, had significantly longer survival when treated with nilotinib. There have been several previous reports of links between specific SFK members and B-ALL that demonstrate their effects on BCR-ABL1–like subcategory members (Lyn) as well as Ph+ cases, in which they are activated downstream of the BCR-ABL1 kinase. In addition, the role of the SFK Fyn in the progression of chronic myeloid leukemia (CML) to blast crisis has been described.51 Src family kinases can phosphorylate the BCR-ABL1 SH3-SH2 region and modulate BCR-ABL–transforming activity.52 The Src pathway is also essential for CML cells to survive imatinib treatment and for their transition to lymphoid blast crisis.53 However, although treatment of the Ph+ CML cell lines with the Src kinase inhibitors PP2 or A-419259 resulted in growth arrest and the induction of apoptosis,54 our data show that Src inhibitors only decrease the growth of primary B-ALL cells and do not affect their viability (supplemental Figure 15). Thus, Src inhibitors have a less pronounced effect on B-ALL than P5G10, suggesting that the signal transduction processes and protein complexes assembled intracellularly after Itga6 engagement are only minimally dependent on SFK members.
Apart from its utility as a clinical risk factor indicator, the high levels of α6 expression on Ph+ ALL blasts found in our study suggest that it could be used as a therapeutic target. It is important to note that this integrin is also expressed at low levels on hematopoietic cells, as shown in our studies. It is also expressed on other cell types, including epithelial cells. The absence of α6 in the intestinal epithelium induced the development of inflammation-associated colorectal cancers in mice.55 Because these mice display epithelial detachment from the basement membrane, systemic anti-α6 therapy could have deleterious effects on the intestine. However, as we have shown here, complete gene ablation (total loss of Itga6 protein) has a much more drastic effect than the inhibition of the engagement of the Itga6 extracellular domain with its ligand laminin through function-blocking Abs. Indeed, we have no evidence that such Ab treatment has any deleterious effects on normal tissues in mouse models (data not shown).
We have previously reported that Itga4 is targetable by an existing US Food and Drug Administration–approved drug (natalizumab).22 Clearly, the function of α6 differs from that of α4, suggesting that efforts to target α6 in B-ALL may be warranted even though α4-directed agents already exist. In summary, we demonstrated that targeting α6 by itself induces apoptosis, and α6 ablation (pharmacologic and genetic) sensitizes ALL cells to nilotinib or chemotherapy, suggesting that the targeting of the integrin α6 may serve as a method for treating refractory ALL.
For original data, please contact Yong-Mi Kim at ymkim@chla.usc.edu.
The online version of this article contains a data supplement.
The publication costs of this article were defrayed in part by page charge payment. Therefore, and solely to indicate this fact, this article is hereby marked “advertisement” in accordance with 18 USC section 1734.
Acknowledgments
The authors thank the Biostatistics Core, the Flow Cytometry Core, the Cellular Imaging Core, Small Animal Imaging Core, and the Animal Facility at Children’s Hospital Los Angeles for their expertise and support.
This work received funding from the National Institutes of Health (NIH) National Cancer Institute grant R01 CA172896, a Leukemia and Lymphoma Translational Research Program Award (Y.-M.K.), and the NIH Shared Instrumentation grant 1S10OD016387-01 (T.G.).
Authorship
Contribution: Y.-M.K. was the principal investigator and takes primary responsibility for the article; E.J.G., H.N.K., Y.-T.H., Y.R., H.A.O., S.L., J.P., E.P., and L.K. performed the laboratory work and analyzed the data for this study; H.G. performed the bioinformatics analysis of the MRD data; C.L.W. and W.L.C. provided the MRD data; A.D.A., E.G.-L., H.B., N.H., M.M., and E.W. provided antibodies, reagents, a6fl/fl line, and critical expertise and wrote the manuscript; T.G.G., A.M., and J.t.H. performed the proteomics study and analysis; M.J.O. analyzed and presented the histopathologic data; E.O. and S.D.M. provided histologic samples; D.B., C.P., H.A.-A., and A.S.W. provided patient samples and critical expertise and wrote the manuscript; and E.J.G., H.N.K., Y.-T.H., Y.R., H.B., N.H., and Y.-M.K. wrote the manuscript.
Conflict-of-interest disclosure: The authors declare no competing financial interests.
Elisabeth Georges-Labouesse died in 2012.
Correspondence: Yong-Mi Kim, Division of Hematology-Oncology, Children’s Hospital Los Angeles, University of Southern California, 4650 Sunset Blvd, Mailstop #57, Los Angeles, CA 90027; e-mail: ymkim@chla.usc.edu.
