

Key Points
Pretransplant MRD level is predictive of outcome; thresholds of 200 copies per 105ABL in blood and 1000 copies in marrow are discriminatory.
Relapse in patients with pretransplant MRD positivity below these levels is largely restricted to those with FLT3-ITD.

Abstract
Relapse remains the most common cause of treatment failure for patients with acute myeloid leukemia (AML) who undergo allogeneic stem cell transplantation (alloSCT), and carries a grave prognosis. Multiple studies have identified the presence of measurable residual disease (MRD) assessed by flow cytometry before alloSCT as a strong predictor of relapse, but it is not clear how these findings apply to patients who test positive in molecular MRD assays, which have far greater sensitivity. We analyzed pretransplant blood and bone marrow samples by reverse-transcription polymerase chain reaction in 107 patients with NPM1-mutant AML enrolled in the UK National Cancer Research Institute AML17 study. After a median follow-up of 4.9 years, patients with negative, low (<200 copies per 105ABL in the peripheral blood and <1000 copies in the bone marrow aspirate), and high levels of MRD had an estimated 2-year overall survival (2y-OS) of 83%, 63%, and 13%, respectively (P < .0001). Focusing on patients with low-level MRD before alloSCT, those with FLT3 internal tandem duplications(ITDs) had significantly poorer outcome (hazard ratio [HR], 6.14; P = .01). Combining these variables was highly prognostic, dividing patients into 2 groups with 2y-OS of 17% and 82% (HR, 13.2; P < .0001). T-depletion was associated with significantly reduced survival both in the entire cohort (2y-OS, 56% vs 96%; HR, 3.24; P = .0005) and in MRD-positive patients (2y-OS, 34% vs 100%; HR, 3.78; P = .003), but there was no significant effect of either conditioning regimen or donor source on outcome. Registered at ISRCTN (http://www.isrctn.com/ISRCTN55675535).
Introduction
Optimal therapy for patients with cytogenetically normal acute myeloid leukemia (AML) remains controversial, particularly regarding the use of allogeneic stem cell transplantation (alloSCT).1-3 Many recent studies have identified the presence of measurable residual disease detected by polymerase chain reaction (PCR),4-10 flow cytometry (FCM),11-16 or next-generation sequencing (NGS)17-19 as a powerful predictor of outcome and measurable residual disease (MRD) status is increasingly used to allocate patients for transplantation20-23 ; however, peri-transplant management of MRD-positive patients remains highly challenging.
Multiple studies have identified the presence of MRD assessed by FCM,24-32 abnormal gene expression,33,34 and NGS35,36 immediately before alloSCT as a strong predictor of adverse outcome; patients who test positive using these methods have a relapse risk of up to 69%.32 As relapse after alloSCT carries a grave prognosis,37 there is growing interest in peritransplant interventions to reduce or eliminate MRD, which might diminish relapse risk.31,38 In this regard, the effect of different conditioning regimens on the outcome of patients who are MRD positive remains uncertain.28,39,40
Although the great majority of studies of pretransplant MRD in AML have used FCM, more than half of patients with cytogenetically normal AML harbor mutations in the gene encoding nucleophosmin (NPM1).41,42 The recommended method for MRD assessment in these patients is reverse-transcription quantitative PCR (RT-qPCR),43 which affords a sensitivity of 1:10−5 to 1:10−6 (ie, 100- to 1000-fold greater than that achieved by FCM or NGS).4-10 Thus, the strongly adverse outcome reported in patients who are MRD positive using FCM and NGS may not be applicable to NPM1-mutated patients with low-level positivity by PCR. Despite this, few studies have examined the effect of pretransplant NPM1 MRD status.44,45 Absence of robust outcome data for these patients is a barrier both to rational clinical decision making and to planning interventional studies in this setting.
In this study, we report the outcomes of a large cohort of patients with NPM1-mutated AML treated on the National Cancer Research Institute (NCRI) AML17 protocol who had pretransplant molecular MRD assessment.
Methods
Patients
Between 2009 and 2014, the NCRI AML17 study (ISRCTN 55675535) enrolled 3215 patients with non-M3 AML aged 16 to 77 years who were eligible for intensive chemotherapy. This study was approved by the Medical Research Ethics Committee for Wales, and conducted in accordance with the Declaration of Helsinki. The treatment protocol has been described previously.46 Central screening for NPM1 mutations was positive in 861/2949 (29%) patients, and 530 of these provided serial samples for MRD monitoring. Paired blood (PB) and bone marrow aspirates (BM) were requested on regeneration after each cycle of chemotherapy, and then every 3 months. Postremission treatment was determined according to the validated NCRI risk score, with poor-risk patients recommended for alloSCT during first complete remission (CR1). Further information regarding calculation of the NCRI risk score is provided in the supplemental Appendix, available on the Blood Web site. For patients receiving a transplant, additional samples were requested before alloSCT, at D+30 and D+100 and then at 3-monthly intervals for at least 2 years. For this study, pre-SCT results were included if the sample was taken within 60 days before transplant and the patient had not received any further therapy between sampling and the start of conditioning. Results were issued to treating clinicians from June 2012 only (ie, 51/107 patients); after this time, patients could be treated for confirmed reemergent or persistent molecular positivity.
Amplification of NPM1-mutated transcripts
Samples were analyzed by RT-qPCR, as previously described.4 Briefly, RNA was isolated using Trizol reagent (Life Technologies, Carlsbad, CA) and reverse transcribed using ThermoScript (Life Technologies). Primer and probe sets described by Gorello et al7 were used to amplify NPM1 type A, B, and D mutant transcripts, and patient-specific primers were designed to detect rare mutations. Samples were run in triplicate, using an ABI 7900 thermocycler (Life Technologies) with parallel amplification of a control gene (ABL). Samples with an ABL cycle threshold of at least 30 were excluded. Criteria proposed by the Europe Against Cancer program47 were used to define MRD positivity (ie, amplification in at least 2 of 3 replicates with cycle-threshold values of 40 or less, using a threshold setting of 0.1). Molecular relapse was diagnosed if there were 2 consecutive positive samples showing increasing transcript levels in a patient who had previously tested MRD negative in a technically adequate sample, consistent with European Leukaemia Network (ELN) guidelines.43 All NPM1 expression levels are reported as the number of mutated transcripts per 105 copies of ABL.
Analysis of FLT3-ITD status and allelic ratio
PCR amplification of exons 14 and 15 of FLT3 was performed using fluorescently labeled primers and analyzed using capillary electrophoresis, as previously described.48 The allelic ratio was determined by comparing the areas under the curves from the mutated and wild-type products.
Statistical analyses
Kaplan-Meier estimates were used to calculate survival percentages. Time to event analysis was performed using the log-rank test. Thresholds were selected by identifying cutoffs providing the maximum discrimination between the low and high positive groups in terms of the hazard ratio for overall survival (OS; supplemental Figure 4). The threshold could not be zero, and if a number of thresholds produced the same hazard ratio, the highest of these levels was selected. We used Cox regression with forward selection to identify independent prognostic factors. Categorical variables were analyzed using Fisher’s exact test. All reported P values are 2-sided.
Results
In total, 107/ 530 patients received alloSCT: 56 (52%) in CR1, 30 (28%) after molecular relapse (MR), and 21 (20%) in second remission after morphological relapse (CR2; Figure 1). Clinical and molecular details are shown in Table 1. Median follow-up was 4.9 years from transplant (range, 1.0-8.4 years). Forty-two (39%) patients died; the cause of death was disease relapse in 21 patients, was not attributed to relapse in 19, and could not be determined in 2 patients. OS 2 years from the date of transplant (2y-OS) was 68% for patients transplanted in CR1 without molecular relapse, 63% for those transplanted after a molecular relapse, and 57% for those in CR2 at the time of transplant. There were no statistically significant differences in survival between these groups (P = .25 for CR1 vs others, P = .63 for molecular vs hematological relapse, P = .22 for CR1 vs CR2, overall P = .2 for trend; supplemental Figure 1).
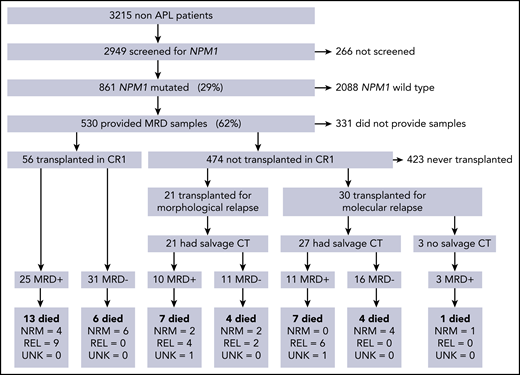
CONSORT diagram showing the number of patients in each part of the trial, therapy given before transplant, and outcomes in each group. CT, chemotherapy; MRD, measurable residual disease; NRM, nonrelapse mortality; REL, relapse; UNK, unknown cause of death.
CONSORT diagram showing the number of patients in each part of the trial, therapy given before transplant, and outcomes in each group. CT, chemotherapy; MRD, measurable residual disease; NRM, nonrelapse mortality; REL, relapse; UNK, unknown cause of death.
Clinical, molecular, and transplant-related variables in each MRD-defined group.
| Pretransplant MRD status | High (n = 19) | Low (n = 30) | Negative (n = 58) | P |
|---|---|---|---|---|
| Median age, y | 53 | 53 | 54 | 1.0 |
| Range | 40-69 | 17-65 | 24-66 | |
| FLT3-ITD positive | 8 (42%) | 8 (27%) | 18 (31%) | .5 |
| FLT3-ITD allelic ratio > 0.5 | 4 (21%) | 3 (10%) | 7 (12%) | .4 |
| PB Post #2 MRD positive | 6/17 (35%) | 11/26 (42%) | 4/53 (8%) | .002 |
| Transplanted in CR1 | 5 (26%) | 20 (67%) | 31 (53%) | .16 |
| Myeloablative conditioning | 8 (42%) | 6 (20%) | 17 (29%) | .5 |
| Sibling donor | 6 (32%) | 14 (47%) | 23 (40%) | .7 |
| T-cell depletion | 16 (84%) | 25 (83%) | 41 (71%) | .15 |
Spearman correlation P value is provided for the age comparison and Mantel-Haenszel P value is provided for all other variables.
Evaluable pre-SCT PB and BM samples taken in the 60 days preceding SCT were available for 103 and 78 patients; both were available for 74 patients. The median time between sampling and transplant was 29 days (range, 5-57 days). In total, 58 (54%) patients were MRD negative before SCT; 48 patients received additional chemotherapy before SCT for molecular (n = 27) or hematological relapse (n = 21), and 27/48 (56%) achieved MRD negativity (Figure 1).
Survival according to pretransplant molecular MRD status
OS 2 years from allograft was 83% for MRD-negative patients vs 45% for patients with any detectable MRD by RT-qPCR in the pretransplant samples; median OS (mOS) was not reached (NR) and 10.5 months, respectively (hazard ratio [HR], 3.60; 95% confidence interval [CI], 1.92-6.77; P < .0001; Figure 2A). For patients with negative pre-SCT PB samples (n = 73), 2y-OS was 81% compared with 30% for patients with any PB positivity (n = 30; HR, 8.30; CI, 3.77-18.20; P < .0001; Figure 2B); mOS was NR and 7.4 months. Patients with a negative pre-SCT BM (n = 37) had a 5y-OS of 84% compared with 49% if the BM was MRD positive (n = 41); mOS was NR and 13.1 months (HR, 3.17; CI, 1.54-6.54; P = .002; Figure 2C).

OS from date of transplant according to pretransplant molecular MRD status. Panels A to C show the difference in survival between patients with positive and negative MRD (A) overall, (B) in the peripheral blood, and (C) in the bone marrow. Panels D to F show the difference in survival between patients with negative, low, and high levels of MRD (D) in the peripheral blood using a cutoff at 200 copies per 105ABL, (E) in the bone marrow with level of more than 1000 copies, and (F) with either, defining high-level MRD. Percentages indicate estimated 2y-OS.
OS from date of transplant according to pretransplant molecular MRD status. Panels A to C show the difference in survival between patients with positive and negative MRD (A) overall, (B) in the peripheral blood, and (C) in the bone marrow. Panels D to F show the difference in survival between patients with negative, low, and high levels of MRD (D) in the peripheral blood using a cutoff at 200 copies per 105ABL, (E) in the bone marrow with level of more than 1000 copies, and (F) with either, defining high-level MRD. Percentages indicate estimated 2y-OS.
For those patients who relapsed after transplant (n = 21), the median time from relapse to death was 34 days (range, 3-344 days; supplemental Figure 2), and consequently, OS and relapse-free survival times were similar. Relapse-free survival curves are shown in supplemental Figure 3.
A threshold of 200 mutant NPM1 transcripts per 105ABL copies in the pre-SCT PB sample provided maximum additional discrimination (supplemental Figure 4) and split patients into 3 groups with 2y-OS of 81% (negative, n = 73; mOS, NR), 54% (low, 0.1-200 copies, n = 13; mOS, NR), and 12% (high, >200 copies, n = 17; mOS, 6.5 months; HR by group, 2.81; CI, 1.96-4.02; P < .0001; Figure 2D; supplemental Figure 3D).
In the BM, a threshold of 1000 copies provided maximum additional discrimination (supplemental Figure 4) and defined 3 groups with 2y-OS of 84% (negative, n = 37; mOS, NR), 56% (low, 0.1-1000 copies, n = 32; mOS, NR), and 22% (high, >1000 copies, n = 9; mOS, 5.8 months; HR by group, 2.87; CI, 1.69-4.86; P < .0001; Figure 2E; supplemental Figure 3E).
Overall (applying the higher level where there was a discrepancy between PB and BM results), 2y-OS was 83% (n = 58; mOS, NR), 63% (n = 30; mOS, NR), and 13% (n = 19; mOS, 6.5 months) for patients with negative, low, and high levels of MRD, respectively (HR by group, 2.83; CI, 1.92-4.19; P < .0001; Figure 2F; supplemental Figure 3F).
Impact of FLT3 status on posttransplant outcome
We next stratified patients according FLT3-ITD status. Thirty-four patients were positive for FLT3-ITD at diagnosis, and 73 were negative; 2y-OS was 62% and 67%, respectively (HR, 1.14; CI, 0.59-2.19; P = .7). FLT3-ITD status was not associated with outcome in patients who were MRD negative before transplant (2y-OS ITD negative, 77% [n = 40]; ITD positive, 94% [n = 18]; HR, 0.42; CI, 0.14-1.28; P = .13) or those who had high levels of MRD (2y-OS ITD negative, 0% [n = 11]; ITD positive, 25% [n = 8]; mOS, 5.8 vs 6.8 months; HR, 0.71; CI, 0.26-1.92; P = .5). In contrast, for patients with low levels of MRD, FLT3-ITD status was strongly associated with outcome: 2y-OS was 77% for ITD-negative (n = 22; mOS, NR) and 25% for ITD-positive (n = 8; mOS, 7.1 months) patients (HR, 6.14; CI, 1.50-25.13; P = .01; Figure 3).
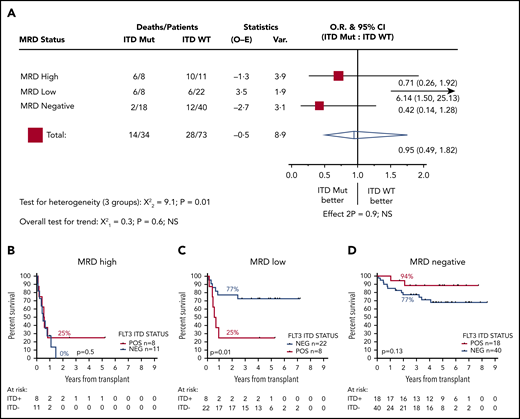
Effect of FLT3-ITD on outcome according to pretransplant MRD status. (A) HR and 95% CIs for FLT3-ITD mutation in each group. (B-D) OS from transplant for patients with high (B), low (C), and negative (D) pretransplant MRD. Percentages indicate estimated 2y-OS.
Effect of FLT3-ITD on outcome according to pretransplant MRD status. (A) HR and 95% CIs for FLT3-ITD mutation in each group. (B-D) OS from transplant for patients with high (B), low (C), and negative (D) pretransplant MRD. Percentages indicate estimated 2y-OS.
Owing to small numbers (n = 8), we were unable to reliably assess the effect of FLT3-ITD allelic ratio. Although a trend for better survival for patients with an allelic ratio lower than 0.5 was apparent, this was not statistically significant (P = .25; supplemental Figure 5).
Effect of first-line postinduction MRD status on posttransplant outcome
Peripheral blood MRD status after the second induction cycle of first-line therapy (PBPC2) has previously been shown to be highly prognostic4 and retained power in this cohort (2y-OS 76% vs 33% for PBPC2-negative and PBPC2-positive patients; mOS, NR vs 9.6 months; HR, 4.93; CI, 2.05-11.90; P = .0004). There was an association between PBPC2 and pre-SCT MRD negativity (P = .002; Table 1). Of those patients who were PBPC2 negative and who experienced molecular or hematological relapse, 60% (21/35) achieved MRD negativity after salvage therapy, and a further 14% (5/35) were MRD positive at levels below the thresholds defined above and were FLT3 WT; 2y-OS for these patients was 88%.
Multivariable model for prediction of posttransplant outcome
We performed a multivariate analysis, taking into account remission status at time of transplant (CR1 vs other), age at time of transplant, FLT3-ITD status, PBPC2 status, and pretransplant MRD level (negative, low, or high). The only factors that retained independent prognostic power were age (HR per decade, 1.54; CI, 1.08-2.19; P = .02) and pretransplant MRD level (HR, 3.02; CI, 1.97-4.62; P < .0001).
We developed a 2-group prognostic model incorporating MRD status (negative, low, or high) and FLT3-ITD (positive or negative). Patients who had high levels of MRD were allocated to the high-risk group, together with patients with low levels of MRD who had FLT3-ITD at diagnosis. The remaining patients were allocated to the low-risk group. Patients with a negative PB and absent BM sample could not be reliably allocated to a risk group and were excluded from this analysis. There was sufficient information to assign a risk group in 83 patients. In the low-risk group (n = 56), 2y-OS was 82% compared with 17% in the high-risk group (n = 27; mOS, NR vs 6.5 months; HR, 13.2; CI, 5.80-30.2; P < .0001; Figure 4; supplemental Figure 6).
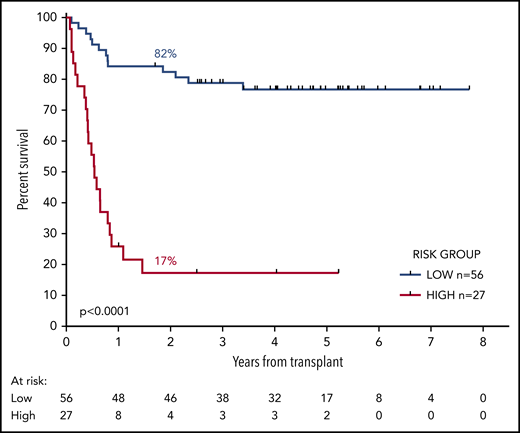
OS from transplant according to the risk group. The risk group was derived from FLT3-ITD status and pretransplant MRD level. Patients with high levels of MRD and those with low levels who had the FLT3-ITD mutation were allocated to the high-risk group. All other patients were allocated to the low-risk group. Percentages indicate estimated 2y-OS.
OS from transplant according to the risk group. The risk group was derived from FLT3-ITD status and pretransplant MRD level. Patients with high levels of MRD and those with low levels who had the FLT3-ITD mutation were allocated to the high-risk group. All other patients were allocated to the low-risk group. Percentages indicate estimated 2y-OS.
When risk group (low or high) was introduced as a candidate variable into the multivariable model described here, the only factors to retain prognostic significance were age at time of transplant (HR per decade, 1.60; CI, 1.08-2.37; P = .02) and risk group (HR, 9.5; CI, 4.24-21.42; P < .0001).
Effect of transplant-related factors on outcome according to MRD status
Donor source was a matched sibling in 43 patients, a volunteer unrelated donor (VUD) in 63, and umbilical cord blood in 1. Although a trend for greater OS in patients whose donor was a sibling compared with a VUD was noted, this was not statistically significant (2y-OS, 72% vs 62%; HR, 1.81; CI, 0.97-3.35; P = .06; Figure 5A).
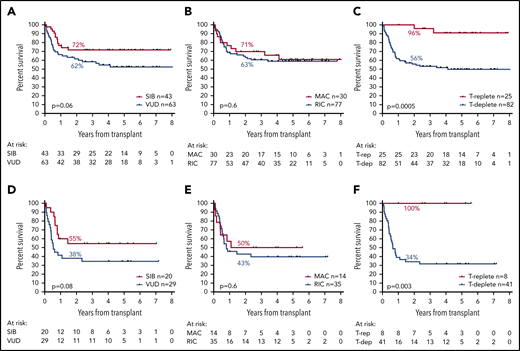
Effect of transplant-related factors on OS. Panels A to C show the effect of transplant-related variables in the entire cohort; panels D to F show their effect in patients who were MRD-positive before transplantation. (A,D) Effect of donor source. (B,E) Effect of conditioning type. (C,F) Effect of T-cell depletion.
Effect of transplant-related factors on OS. Panels A to C show the effect of transplant-related variables in the entire cohort; panels D to F show their effect in patients who were MRD-positive before transplantation. (A,D) Effect of donor source. (B,E) Effect of conditioning type. (C,F) Effect of T-cell depletion.
Conditioning regimens were considered myeloablative (MAC) in 30 patients (28%; BuCy, 4; CyTBI, 20; FB4C, 6) and reduced-intensity (RIC) in 77 (72%; FluMel, 48; FluBu, 11; FLAMSA-Bu, 8; FluTBI, 6; FluCy, 2; FluCyTBI, 2). Patients who received MAC were significantly younger (mean, 43 vs 56 years; P < .0001). There was no difference in OS according to conditioning regimen type (2y-OS: MAC, 71%; RIC, 63%; HR, 1.18; CI, 0.61-2.29; P = .6; Figure 5B).
Alemtuzumab was given to 70 (65%) and anti-thymocyte globulin to 12 (11%) patients for T-depletion; 2y-OS was 56% for these patients, with no difference by T-depletion agent, compared with 96% in patients who did not receive T-depletion (n = 25; HR, 3.24; CI, 1.69-6.42; P = .0005; Figure 5C). Patients who received T-depletion were older (mean, 54 vs 47 years; P = .0028) and were more likely to have been transplanted using a VUD (67% vs 33% for non-T-depleted; P = .004) and with RIC (80% vs 44% for non-T depleted; P = .0008). Cumulative incidence of relapse at 5 years was 24% in patients who underwent T-depletion compared with 4% in those who did not (P = .0149). Cumulative incidence of nonrelapse mortality at 5 years was 23% in patients who underwent T-depletion compared with 4% in patients who did not (P = .0148).
Considering patients who were MRD positive before allograft, there was a trend for lower OS in patients who had received a VUD transplant (2y-OS, 38% vs 55% for SIB; HR, 1.94; CI, 0.92-4.08; P = .08; Figure 5D). There was no association between OS and type of conditioning (2y-OS, 50% for MAC vs 43% for RIC; HR, 1.22; CI, 0.54-2.76; P = .6; Figure 5E). Specifically, MRD-positive patients treated with the sequential FLAMSA protocol had no difference in OS. Patients who were MRD positive and who received T-depletion showed inferior OS vs those who did not (2y-OS, 34% vs 100%; mOS, 7.8 months vs NR; HR, 3.78; CI, 1.57-19.2; P = .003; Figure 5F).
Discussion
Patients with NPM1-mutated AML who test MRD negative by RT-qPCR before transplant have an excellent chance of long-term survival regardless of other risk factors including FLT3 status and independent of the intensity of the transplant conditioning regimen.
As expected, NPM1 MRD positivity had an overall adverse effect on transplant outcome, but in contrast to patients who are MRD positive by FCM or NGS, patients who test positive for NPM1 mutant transcripts before alloSCT do not have a universally poor outcome; indeed, many become long-term survivors. Factors associated with adverse outcome are high levels of MRD (above 200 copies per 105ABL in the PB or 1000 copies in the BM) and the presence of a FLT3-ITD mutation at diagnosis. Patients who are MRD positive before transplant and have 1 or both of these features have a poor prognosis because of a high risk for disease relapse. Our data do not exclude the possibility that MRD-positive patients with a low FLT3-ITD allelic ratio may have a somewhat better outcome, and larger studies will be required to address this.
Interestingly, the threshold we identified of 1000 copies per 105ABL in the bone marrow is the same as that selected by Kayser and colleagues45 for their study of 39 patients with NPM1-mutated AML in first or second morphological complete remission before transplant. In that study, the outcomes of patients with levels exceeding the threshold was the same as that of patients who were not in remission. No effect of either FLT3-ITD status or allelic ratio was identified; however, we speculate that this may have been a result of the the sample size, and indeed the only relapse observed in the group with MRD levels below the threshold was in a patient with FLT3-ITD, which would be consistent with our findings. Bill and colleagues44 also report a significant difference in outcome according to molecular MRD status in 51 patients with NPM1-mutated AML. In this study, a lower threshold equivalent to 10 copies per 105ABL was selected according to the technical characteristics of the digital droplet PCR platform employed; however, this was applied to both PB and BM samples, and alternative cutoff levels were not comprehensively evaluated. Comparative studies of these 2 highly sensitive platforms would be of great interest.
Shayegi and colleagues10 identified posttransplant MRD levels equivalent to 10 000 copies per 105ABL as strongly predictive of relapse. In the present study, we did not investigate posttransplant MRD levels, as these were not available for all patients; however, approximately half of patients had posttransplant MRD results provided to their treating physician, and these were used to inform interventions such as immunosuppressive therapy and donor lymphocyte infusion. These manipulations may have affected the outcome for some patients, and it is possible that they reduced the OS difference between the MRD-positive and MRD-negative groups. Nevertheless, we did not observe a difference in OS between patients who did or did not have posttransplant results returned (data not shown).
In this study, 27/48 (56%) of patients with a hematological or confirmed molecular relapse achieved MRD negativity with salvage chemotherapy, and a further 8/48 (17%) became low risk, as defined in our risk score. These 35 patients had an excellent outcome, with an OS of 80% at 2 years. In addition, 74% of patients who tested negative for MRD in the PB after second induction (PBPC2) and who subsequently relapsed achieved MRD negativity or low-risk status after salvage and had a 2y-OS of 88%. This supports the approach adopted in the current NCRI AML19 protocol, where such patients are not recommended for transplantation in CR1 and are offered sequential MRD monitoring to allow early detection and treatment of relapse.
Selection of transplant protocol remains controversial, particularly for patients who are MRD positive, and a key question is whether augmented conditioning can eliminate MRD and thereby improve outcome. Studies to date have provided conflicting results and have not examined the effect of transplant-related factors specifically in NPM1-mutated patients.28,39,40,49 Surprisingly, we observed no effect on survival according to conditioning type, either overall or in patients who were MRD positive. In contrast, we observed a strong association between use of T-depletion and adverse outcome. Relatively few patients who were MRD positive received T-replete transplants (n = 8), and this retrospective nonrandomized analysis clearly has significant limitations; however, these results highlight T-depletion as a potentially critical factor that has not been consistently reported in other studies to date.
These findings require independent validation; however, patients at highest risk for relapse identified here may benefit from an alternative approach before transplant, such as the use of FLT3 inhibition to reduce the level of MRD below the thresholds identified. Alternatively, augmentation of the graft-versus-leukemia effect (eg, through avoidance or minimization of T-depletion, early withdrawal of immunosuppression, and/or donor lymphocyte infusion) may be considered. Randomized studies to investigate these approaches are urgently required.
The publication costs of this article were defrayed in part by page charge payment. Therefore, and solely to indicate this fact, this article is hereby marked “advertisement” in accordance with 18 USC section 1734.
Publication-related data are available on reasonable request by e-mail from the corresponding author.
Acknowledgments
The authors gratefully acknowledge assistance from the Cardiff University Centre for Trials Research (Ian Thomas, Sophie Betteridge, Laura Upton, Leona Batten, Melanie Varley) and sincerely thank all clinicians and patients for their participation in NCRI AML17.
This study was funded by a programme grant from the UK National Institute for Health Research and a Clinical Trial Award from Cancer Research UK. R. Dillon is supported by Bloodwise and J.J. is supported by Children With Cancer.
Authorship
Contribution: R. Dillon, N.P., J.J., A.I., A.S.K., M.R., N.F., M.V., A.G., R.G., N.H.R., and D.G. provided molecular analysis and interpretation; R. Dillon and R.H. provided statistical analysis; A. Khwaja, J.C., M.S., H.B.O., U.M.O., M.D., S.K., H.K., D.T., P.M., K.R., I.N.-B., E.N., R. Danby, P.K., K.H., D.F., S.A., E.H., P.J., A. Khan, R. Salim, C.C., R. Spearing, A.B., and N.H.R. provided clinical data collection; M.D., S.K., A.B., and N.H.R. provided trial coordination; and R. Dillon, R.H., S.F., and N.H.R. provided manuscript preparation.
Conflict-of-interest disclosure: The authors declare no competing financial interests.
A complete list of the members of the UK National Cancer Research Institute Acute Myeloid Leukaemia Working Group appears in the supplemental appendix.
Correspondence: Richard Dillon, Guy’s Hospital, Floor 8, Tower Wing, St. Thomas St, London SE1 9RT, United Kingdom; e-mail: richard.dillon@kcl.ac.uk.

This feature is available to Subscribers Only
Sign In or Create an Account Close Modal