

Key Points
Expression of Epo receptor or of a functionally more potent mutant (EpoRm) promotes T-cell survival and proliferation.
EpoRm expression endows CAR T cells with superior antitumor activity, an approach that could be applied to other adoptive T-cell therapies.

Abstract
In adoptive T-cell immunotherapy of cancer, expansion and persistence of effector cells is a key determinant of response. We tested whether T lymphocytes could be rendered sensitive to erythropoietin (Epo) through ectopic expression of its wild-type receptor or a truncated form (EpoRm), which augments Epo signaling in erythrocyte progenitors. Both receptors could be expressed in human T lymphocytes; Epo ligation induced STAT5 phosphorylation, which was abrogated by nontoxic concentrations of the JAK1/2 inhibitor ruxolitinib. EpoRm had higher expression and triggered more potent stimulation than its wild-type counterpart, including superior T-cell survival and proliferation. Using a bicistronic vector, we expressed EpoRm together with an anti–CD19-41BB-CD3ζ chimeric antigen receptor (CAR), while maintaining the functions of each receptor. In the presence of Epo, EpoRm-CAR T cells had greater ex vivo expansion than CAR T cells and killed CD19+ leukemic cells more effectively in long-term cultures. In immunodeficient mice, physiologic levels of murine Epo were sufficient to preferentially expand EpoRm-CAR T cells, yielding a significantly higher antileukemic activity. Thus, outfitting adoptive T cells with EpoRm should yield greater effector-to-target ratios with a smaller number of infused cells; Epo or ruxolitinib administration could be used to adjust their levels postinfusion, maximizing antitumor activity and minimizing toxicity.
Introduction
Adoptive transfer of antitumor immune cells has become a new treatment option for patients with cancer. Compelling evidence of the potential of this treatment modality is provided by clinical studies infusing tumor-infiltrating lymphocytes, or T lymphocytes redirected toward tumor-associated molecules with T-cell receptors or chimeric antigen receptors (CARs).1,2 For example, treatment of B-cell leukemia and lymphoma or multiple myeloma with CAR T cells has led to durable remissions in patients with disease resistant to conventional therapy.3-13
The clinical efficacy of immune cell therapy depends on expansion and persistence of the infused cells. The initial effector-to-target (E:T) ratio is likely to determine the degree of tumor cytoreduction, whereas long-term persistence is important for minimal residual disease clearance and suppression of disease recurrence.11 Several factors collectively influence proliferation and lifespan of infused T lymphocytes, including the intensity of lymphodepleting therapy before infusion and the proliferative potential and exhaustion propensity of the infused T cells.1,2 In the case of CAR-engineered T cells, the quality of the CAR is a critical feature, and the type of costimulation that the CAR can deliver plays an important role.14-16
Besides receptor-driven T-cell stimulation, T-cell expansion requires cytokine support. Some trials administered interleukin-2 (IL-2) to promote proliferation and persistence of T cells in vivo.17,18 Administration of IL-2, however, can have considerable toxicities.19,20 Moreover, it lacks specificity because it reacts with all T cells expressing IL-2 receptors, regardless of their antitumor capacity. To this end, IL-2 also stimulates regulatory T cells, which dampen immune responses.21 In this study, we determined whether ectopic expression of the wild-type erythropoietin (Epo) receptor (EpoR) and of a naturally occurring truncated form associated with erythrocytosis could confer Epo responsiveness to human peripheral blood lymphocytes. Using T cells transduced with a single construct encoding for the receptor and a CAR, we assessed the potential of Epo to specifically expand CAR T cells in vitro and in vivo.
Materials and methods
Cells
Jurkat, Nalm6, RS4;11, THP1, and 293T cells were from the American Type Culture Collection (Rockville, MD). The CD19+ B-lineage acute lymphoblastic leukemia (ALL) cell line OP-1 was developed in our laboratory.22 Cell lines were maintained in RPMI 1640 or Dulbecco’s Modified Eagle Medium (Thermo Fisher Scientific, Waltham, MA) with 10% fetal bovine serum and 1% penicillin-streptomycin.
Peripheral blood samples were from discarded anonymized byproducts of platelet donations from healthy adult donors at the National University Hospital Blood Bank or the Health Science Authority Blood Bank, Singapore. Mononucleated cells were separated by centrifugation on a Lymphoprep Density Gradient Medium (Takeda Pharmaceutocal Company, Ltd., Tokyo, Japan).
Gene cloning, retroviral transduction
EpoR complementary DNA was from GeneCopoeia (Rockville, MD). Mutant EpoR (EpoRm) was generated by using site-directed mutagenesis polymerase chain reaction altering the codon at position 439 for TGG (tryptophan) to TAG (stop codon).23 In another construct, a Flag tag (DYKDDDDK) was added to the C-terminal of EpoR and EpoRm. The anti–CD19-41BB-CD3ζ CAR construct was previously made in our laboratory.24 The EpoRm-2A-CAR construct was generated by fusion polymerase chain reaction, using the T2A peptide sequence GSGEGRGSLLTCGDVEENPGP.25 Constructs and expression cassette were subcloned into EcoRI and XhoI sites of a murine stem cell virus retroviral vector containing green fluorescent protein (GFP) and an internal ribosomal entry site. Preparation of retroviral supernatant, T-cell expansion, and transduction are described in the supplemental Methods (available on the Blood Web site).26
EpoR expression, signaling, and cell marker analysis
EpoR expression was detected with phycoerythrin (PE)-conjugated anti-human EpoR antibody (38409; R&D Systems, Minneapolis, MN). In some experiments, staining of EpoR was performed after culture in cytokine-free media for 2 hours followed by incubation with 10 IU/mL of recombinant human Epo (Thermo Fisher Scientific) at 37°C for 15 to 60 minutes. Epo binding to EpoR was determined by labeling cells with biotinylated Epo (R&D Systems) for 2 hours, followed by streptavidin-PE (Jackson ImmunoResearch Laboratories, West Grove, PA). Western blotting, detection of CAR expression, cell signaling, and cell marker analysis are described in the supplemental Methods.
Cell proliferation, cytotoxicity, and cytokine production
T-cell survival was assessed by culturing cells with or without Epo (4-10 IU/mL) and no exogenous cytokines, and counting GFP+ viable cells by flow cytometry. For cell cycle studies, cells were cultured in cytokine-free media for 3 days and then stimulated for 1 day with 10 IU/mL Epo. DNA synthesis was measured by using the Click-iT EdU-AF647 Flow Cytometry Assay, and DNA content was measured by using the FxCycle Violet Stain (both from Thermo Fisher Scientific). Cell viability in the presence of ruxolitinib (Selleck Chemicals, Houston, TX) was determined by propidium iodide exclusion (Life Technologies, Carlsbad, CA).
CAR T-cell proliferation was stimulated by coculture with CD19+ cells at a 1:1 E:T ratio; 10 IU/mL Epo with or without IL-2 (10-100 IU/mL) was added every 2 days. Target cells, irradiated (100 Gy) or treated with Streck cell preservative (Streck Laboratories, Omaha, NE) to inhibit growth, were added at the beginning of the cultures and every 7 days thereafter. Viable GFP+ T cells were counted by using flow cytometry.
To test cytotoxicity, CD19+ cells were labeled with Calcein Red-Orange AM (Thermo Fisher Scientific) and cocultured for 4 hours with T cells at 1:1; viable target cells were counted by using flow cytometry.27 For long-term cytotoxicity, CD19+ mCherry+ cells were cocultured with T cells at different E:T ratios and monitored with the IncuCyte Zoom System (Essen BioScience, Ann Arbor, MI) set to collect whole-well imaging data every 4 hours. CD107a expression and cytokine secretion studies are described in the supplemental Methods.
Xenograft experiments
To determine survival of T cells in vivo, we injected 10 × 106 T cells transduced with CAR, EpoRm, EpoRm-CAR, or GFP alone intravenously (IV) in NOD.Cg-Prkdcscid IL2rgtm1Wjl/SzJ (NOD-scid-IL2RGnull) mice (The Jackson Laboratory, Bar Harbor, ME). In some mice, 100 IU of Epo was injected intraperitoneally (IP) every 2 days for 2 weeks.
To assess antileukemic activity, NOD-scid-IL2RGnull mice were injected IV with 5 to 20 × 106 T cells transduced with CAR, EpoRm-CAR, or GFP alone. Two weeks later, mice were injected IV with 2.5 × 10⁵ Nalm6 cells expressing luciferase, and engraftment was determined by measuring luminescence signal with Xenogen IVIS-200 System (PerkinElmer, Waltham, MA), after IP injection of aqueous d-luciferin potassium salt (150 µg/g body weight; PerkinElmer). Luminescence was analyzed with Living Image 3.0 software.
In another model, Nalm6-luciferase cells were injected IV (5 × 10⁵ cells per mouse). Four days later, tumor engraftment was assessed as noted earlier, and mice were distributed in 4 groups with equivalent tumor load. T cells (10 × 106 T cells per mouse) transduced with the various constructs were injected IV. Mice were euthanized when luminescence reached 1 × 10¹¹ photons/second, or earlier if physical signs warranted euthanasia. Mouse blood was obtained via cheek prick, and cells were counted with a Beckman Coulter Ac•T cell counter (Miami, FL). After treatment with red blood cell lysis solution (MilliporeSigma), cells were stained with anti-human CD45-APC (2D1; BioLegend, San Diego, CA) or -PE/Cy7 (HI30; BD Pharmingen, San Diego, CA), anti-human CD3-APC (SK7; BD Biosciences), anti-human CD19-PE (4G7; BD Biosciences), and anti-mouse CD45-PE (30-F11; BD Pharmingen). These studies were approved by the Institutional Animal Care and Use Committee of the National University of Singapore.
Results
Functional EpoR can be expressed in T cells
Retroviral transduction of EpoR in Jurkat cells yielded high expression of the receptor (Figure 1A), which could specifically bind Epo (Figure 1B). EpoR could also be expressed in peripheral blood T lymphocytes. Among transduced (GFP+) T lymphocytes, 74.9 ± 4.8% (n = 5) expressed EpoR, while this was undetectable in cells transduced with GFP only (Figure 1C).
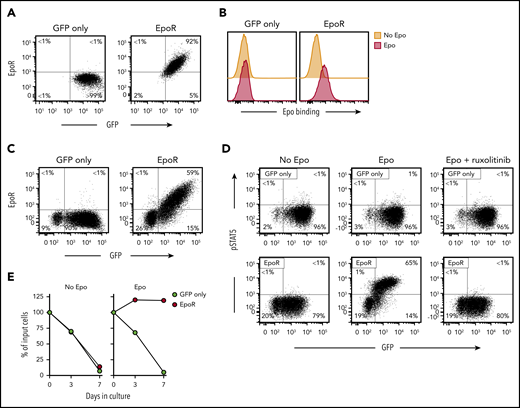
Expression of functional EpoR in human T cells. (A) Flow cytometric dot-plots illustrate surface EpoR expression in Jurkat cells, as detected by a PE-conjugated anti-EpoR antibody (R&D Systems); cells transduced with GFP only are shown as control. Percentage of cells in each quadrant is shown. (B) Flow cytometric histogram illustrates Epo binding to Jurkat cells. Cells were labeled with biotin-conjugated Epo (R&D Systems) and streptavidin-PE (Jackson ImmunoResearch Laboratories). (C) Surface EpoR expression in T lymphocytes transduced with GFP only or GFP plus EpoR. (D) Representative flow cytometric dot plots illustrate phosphorylation of STAT5 Y694, detected with an AF647-conjugated antibody (BD Biosciences) after stimulation with 10 IU/mL Epo for 15 minutes; results with cells treated with 10 µM ruxolitinib for 1 hour before Epo stimulation are also shown. (E) Survival of EpoR-transduced T cells and of T cells transduced with GFP only cultured in absence of exogenous cytokines (no Epo) or in presence of Epo (4 IU/mL). Symbols indicate percentage of cell recovery relative to the number of input cells.
Expression of functional EpoR in human T cells. (A) Flow cytometric dot-plots illustrate surface EpoR expression in Jurkat cells, as detected by a PE-conjugated anti-EpoR antibody (R&D Systems); cells transduced with GFP only are shown as control. Percentage of cells in each quadrant is shown. (B) Flow cytometric histogram illustrates Epo binding to Jurkat cells. Cells were labeled with biotin-conjugated Epo (R&D Systems) and streptavidin-PE (Jackson ImmunoResearch Laboratories). (C) Surface EpoR expression in T lymphocytes transduced with GFP only or GFP plus EpoR. (D) Representative flow cytometric dot plots illustrate phosphorylation of STAT5 Y694, detected with an AF647-conjugated antibody (BD Biosciences) after stimulation with 10 IU/mL Epo for 15 minutes; results with cells treated with 10 µM ruxolitinib for 1 hour before Epo stimulation are also shown. (E) Survival of EpoR-transduced T cells and of T cells transduced with GFP only cultured in absence of exogenous cytokines (no Epo) or in presence of Epo (4 IU/mL). Symbols indicate percentage of cell recovery relative to the number of input cells.
STAT5 Y694 phosphorylation is one of the downstream signals triggered by EpoR ligation in erythroid cells.28-30 A 15-minute exposure to Epo (10 IU/mL) increased pSTAT5 expression from 1.0 ± 0.9% to 85.9 ± 5.1% (n = 3) among EpoR-transduced T lymphocytes, while this remained essentially unchanged in T lymphocytes transduced with GFP only (1.3 ± 0.4% to 1.5 ± 0.7%) (Figure 1D). In erythroid cells exposed to Epo, STAT5 is phosphorylated by the JAK2 kinase.31 Epo-mediated STAT5 phosphorylation in T lymphocytes was abrogated by the JAK1/2 inhibitor ruxolitinib.32 Finally, Epo (4 IU/mL) supported the survival of EpoR T cells in cultures without exogenous IL-2 (Figure 1E). These initial results indicated that a functional EpoR can be expressed in T lymphocytes.
An EpoR mutant enhances EpoR expression in T cells
A nonsense mutation in exon 8 of the EPOR gene produces a truncated EpoR with augmented Epo signaling in erythrocyte progenitors and increased erythrocyte output.23,33 We mutated codon 439 (TGG, encoding for tryptophan) of EpoR to a stop codon TAG. In 293T cells transduced with the mutant complementary DNA (“EpoRm”), the EpoRm protein had the predicted size of 54 kDa according to western blotting, compared with 62 kDa for EpoR (Figure 2A).
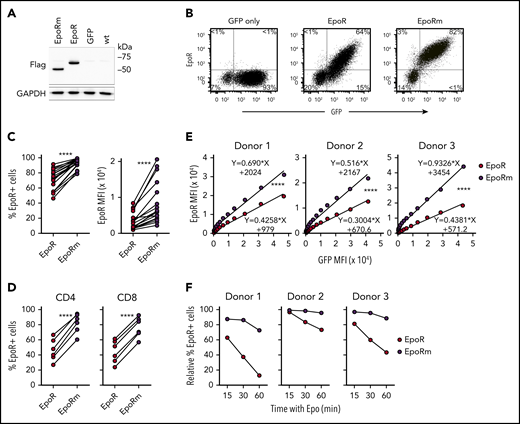
EpoRm has higher and more stable expression than EpoR. (A) Western blot analysis of EpoR expression in 293T cells. Cell lysates of 293T cells transduced with EpoR, EpoRm, or GFP only were separated on a 10% polyacrylamide gel under reducing condition. The blotted membrane was probed with mouse anti-Flag antibody (9A3; Cell Signaling Technology, Danvers, MA) followed by goat anti-mouse immunoglobulin G conjugated to horseradish peroxidase (R&D Systems); rabbit anti-human glyceraldehyde 3-phosphate dehydrogenase (GAPDH; EPR16891; Abcam, Cambridge, UK) was used to detect GAPDH (loading control). Antibody binding was revealed by Clarity Western ECL substrate (Bio-Rad, Hercules, CA) and visualized by ChemiDoc Touch Imager (Bio-Rad). (B) Flow cytometric analysis of T lymphocytes transduced with EpoR, EpoRm, or GFP only. Flow cytometric dot-plots illustrate EpoR expression as detected by a PE-conjugated anti-EpoR antibody (R&D Systems). Percentage of cells in each quadrant is shown. (C) Percentage of GFP+ T cells expressing EpoR (left) or MFI of EpoR (right) of T cells transduced with EpoR or EpoRm. ****P < .0001. (D) Percentage of CD4+ or CD8+ T cells from 6 donors expressing EpoR. ****P < .0001. (E) Relation between MFI of GFP and MFI of EpoR in T cells from 3 donors transduced with either EpoR or EpoRm. ****P < .0001. (F) T lymphocytes from 3 donors were transduced with EpoR or EpoRm and then stimulated with 10 IU/mL Epo. Expression of surface EpoR was assessed by flow cytometry at the indicated time points after stimulation.
EpoRm has higher and more stable expression than EpoR. (A) Western blot analysis of EpoR expression in 293T cells. Cell lysates of 293T cells transduced with EpoR, EpoRm, or GFP only were separated on a 10% polyacrylamide gel under reducing condition. The blotted membrane was probed with mouse anti-Flag antibody (9A3; Cell Signaling Technology, Danvers, MA) followed by goat anti-mouse immunoglobulin G conjugated to horseradish peroxidase (R&D Systems); rabbit anti-human glyceraldehyde 3-phosphate dehydrogenase (GAPDH; EPR16891; Abcam, Cambridge, UK) was used to detect GAPDH (loading control). Antibody binding was revealed by Clarity Western ECL substrate (Bio-Rad, Hercules, CA) and visualized by ChemiDoc Touch Imager (Bio-Rad). (B) Flow cytometric analysis of T lymphocytes transduced with EpoR, EpoRm, or GFP only. Flow cytometric dot-plots illustrate EpoR expression as detected by a PE-conjugated anti-EpoR antibody (R&D Systems). Percentage of cells in each quadrant is shown. (C) Percentage of GFP+ T cells expressing EpoR (left) or MFI of EpoR (right) of T cells transduced with EpoR or EpoRm. ****P < .0001. (D) Percentage of CD4+ or CD8+ T cells from 6 donors expressing EpoR. ****P < .0001. (E) Relation between MFI of GFP and MFI of EpoR in T cells from 3 donors transduced with either EpoR or EpoRm. ****P < .0001. (F) T lymphocytes from 3 donors were transduced with EpoR or EpoRm and then stimulated with 10 IU/mL Epo. Expression of surface EpoR was assessed by flow cytometry at the indicated time points after stimulation.
Expression of either EpoR or EpoRm did not adversely affect long-term cell growth of Jurkat cells (supplemental Figure 1). In peripheral blood T lymphocytes, EpoRm expression was consistently higher than that of wild-type EpoR (Figure 2B). In 18 experiments with T lymphocytes from 7 donors, EpoR was expressed in 71.9 ± 14.1% of GFP+ cells vs 93.1 ± 6.1% for EpoRm (P < .0001 by paired Student t test); mean fluorescence intensity (MFI) was 3620 ± 2449 vs 8773 ± 5851 (P < .0001) (Figure 2C). Higher EpoRm expression was observed in both CD4+ and CD8+ cells (Figure 2D).
Overall GFP expression in T cells transduced with either EpoR or EpoRm was not significantly different: 75.2 ± 8.4% GFP+ cells with EpoR and 80.4 ± 7.5% with EpoRm; MFI, 7003 ± 2820 and 8331 ± 3343 (P > .05 for either comparison). Therefore, it is unlikely that differences in expression between the 2 receptors were simply due to different transduction efficiency. Nevertheless, we addressed this possibility with a detailed analysis of receptor levels in relation to GFP levels. The measurements confirmed that EpoRm expression was higher than that of EpoR (P < .0001) (Figure 2E). Higher expression of EpoRm was associated with longer persistence of the receptor on the cell surface after exposure to Epo (Figure 2F).
Signaling properties of EpoRm in T lymphocytes
In line with its higher and more sustained expression, EpoRm triggered more vigorous T-cell activation than EpoR. EpoRm-T cells had higher STAT5 Y694 phosphorylation after exposure to Epo, and this action was suppressed by ruxolitinib (10 μM) (Figure 3A-B). These findings were corroborated by pSTAT5 Y694 MFI measurements according to levels of retroviral transduction as measured by GFP (supplemental Figure 2A). STAT5 phosphorylation triggered by Epo was dose dependent; EpoRm required lower Epo levels to induce pSTAT5, and STAT5 phosphorylation was more durable (supplemental Figure 2B-C).
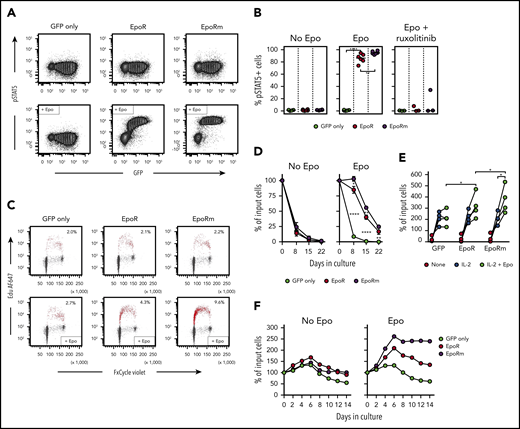
EpoRm transduces stronger proliferation and survival signals than EpoR. (A) Flow cytometric contour plots illustrate phosphorylation of STAT5 in T cells transduced with EpoR, EpoRm, or GFP only after stimulation with Epo (10 IU/mL) for 15 minutes. (B) Percentage of GFP+ cells expressing pSTAT5 in T cells transduced with EpoR, EpoRm, or GFP only after stimulation with 10 IU/mL Epo or treated with 10 µM ruxolitinib before Epo stimulation. Each symbol represents results of 1 experiment. ****P < .0001; **P < .01. (C) Flow cytometry dot-plots illustrate cell cycle analysis of T lymphocytes transduced with EpoR, EpoRm, or GFP only, unstimulated (top row) or stimulated with 10 IU/mL Epo (bottom row) after 3 days of culture in cytokine-free medium. DNA content, detected by FxCycle staining, is shown on the x-axes; DNA synthesis, shown by 5-ethynyl-2′-deoxyuridine (Edu) incorporation, is shown on the y-axes. Edu+ cells are shown in red, with their percentage. (D) Survival of T lymphocytes transduced with EpoR, EpoRm, or GFP-only cultured in absence of exogenous cytokines (no Epo) or in presence of Epo (10 IU/mL) for 3 weeks. Symbols indicate mean (± SD) percentage of cell recovery relative to the number of input cells in triplicate measurements. ****P < .0001; **P < .01; *P = .01. (E) Percentage of T-cell recovery relative to input cells after 6 to 8 days’ culture with or without 100 IU/mL IL-2 and/or 10 IU/mL Epo. Each symbol indicates measurements with T cells of 1 of 4 donors (mean of 3 measurements for 3 donors, and 1 measurement for 1 donor). *P = .02. (F) Survival of T lymphocytes transduced with EpoR, EpoRm, or GFP only cultured with 100 IU/mL IL-2 in the absence or presence of Epo (10 IU/mL). Percentage of T-cell recovery relative to input cells at the indicated days is shown.
EpoRm transduces stronger proliferation and survival signals than EpoR. (A) Flow cytometric contour plots illustrate phosphorylation of STAT5 in T cells transduced with EpoR, EpoRm, or GFP only after stimulation with Epo (10 IU/mL) for 15 minutes. (B) Percentage of GFP+ cells expressing pSTAT5 in T cells transduced with EpoR, EpoRm, or GFP only after stimulation with 10 IU/mL Epo or treated with 10 µM ruxolitinib before Epo stimulation. Each symbol represents results of 1 experiment. ****P < .0001; **P < .01. (C) Flow cytometry dot-plots illustrate cell cycle analysis of T lymphocytes transduced with EpoR, EpoRm, or GFP only, unstimulated (top row) or stimulated with 10 IU/mL Epo (bottom row) after 3 days of culture in cytokine-free medium. DNA content, detected by FxCycle staining, is shown on the x-axes; DNA synthesis, shown by 5-ethynyl-2′-deoxyuridine (Edu) incorporation, is shown on the y-axes. Edu+ cells are shown in red, with their percentage. (D) Survival of T lymphocytes transduced with EpoR, EpoRm, or GFP-only cultured in absence of exogenous cytokines (no Epo) or in presence of Epo (10 IU/mL) for 3 weeks. Symbols indicate mean (± SD) percentage of cell recovery relative to the number of input cells in triplicate measurements. ****P < .0001; **P < .01; *P = .01. (E) Percentage of T-cell recovery relative to input cells after 6 to 8 days’ culture with or without 100 IU/mL IL-2 and/or 10 IU/mL Epo. Each symbol indicates measurements with T cells of 1 of 4 donors (mean of 3 measurements for 3 donors, and 1 measurement for 1 donor). *P = .02. (F) Survival of T lymphocytes transduced with EpoR, EpoRm, or GFP only cultured with 100 IU/mL IL-2 in the absence or presence of Epo (10 IU/mL). Percentage of T-cell recovery relative to input cells at the indicated days is shown.
Epo elicited DNA synthesis, and stimulation was higher with EpoRm (Figure 3C). In cultures without exogenous IL-2, T cells died rapidly regardless of EpoR expression. However, cells expressing EpoR persisted for 1 week in the presence of Epo, and viable cells were still detectable for at least 3 weeks, with cultures of EpoRm-T cells yielding higher cell numbers (Figure 3D).
Epo stimulation improved T-cell recovery even if cells were cultured in the presence of 100 IU/mL IL-2. Recovery of EpoRm-T cells was significantly higher after 6 to 8 days of culture when Epo (10 IU/mL) was added to IL-2 (100 IU/mL) (P = .020; n = 4), and recovery was better than that of EpoR-T cells (P = .019) (Figure 3E). When cultures were prolonged for 14 days, T cells expressing EpoR exhibited higher and more durable expansion than those transduced with GFP only; again, EpoRm-T cells performed better (Figure 3F).
Functional activity of simultaneously expressed EpoRm and CAR
Because EpoRm had higher expression and was functionally superior to the wild-type EpoR, we generated a bicistronic vector containing the EpoRm gene together with that encoding an anti–CD19-41BB-CD3ζ CAR (Figure 4A).24 Both EpoRm and CAR could be simultaneously expressed in T lymphocytes (Figure 4B); either receptor was expressed at levels similar to those of cells transduced with a single-gene vector (Figure 4C).
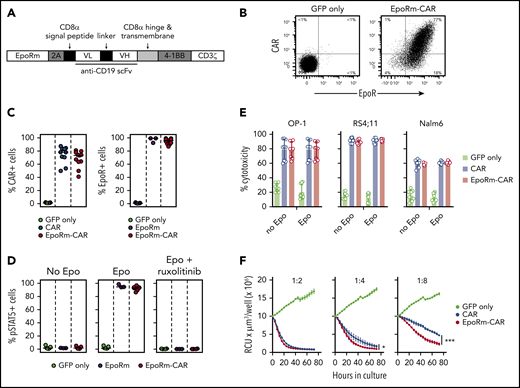
Expression and function of EpoRm-CAR in T cells. (A) Schematic representation of the EpoRm-CAR construct. (B) Flow cytometric dot-plots illustrate surface expression of CAR and EpoR in T cells transduced with EpoRm-CAR; cells transduced with GFP only were used as control. Percentage of cells in each quadrant is shown. Cells were stained with EpoR-PE antibody to detect EpoR expression; CAR expression was detected with goat anti-mouse F(ab′)2 antibody and streptavidin-APC (Jackson ImmunoResearch Laboratories). (C) Percentage of GFP+ cells expressing CAR (left) and EpoR (right) among T lymphocytes transduced with CAR, EpoRm, EpoRm-CAR, or GFP only. Each symbol corresponds to a measurement for one transduction. Horizontal bars indicate median value. (D) Percentage of GFP+ T lymphocytes expressing pSTAT5 after stimulation with 10 IU/mL Epo or pretreatment with 10 µM ruxolitinib before Epo stimulation. Each symbol corresponds to a measurement for one transduction with the construct shown. Horizontal bars indicate median value. (E) Cytotoxicity of T lymphocytes transduced with CAR, EpoRm-CAR, or GFP only against the CD19+ cell lines OP-1, RS4;11, and Nalm6. Bars represent mean (± SD) of triplicate experiments in a 4-hour cytotoxicity assay at a 1:1 E:T ratio. (F) Long-term cytotoxicity of T lymphocytes transduced with various constructs against mCherry+ OP-1 cells at the indicated E:T ratios in the presence of 10 IU/mL Epo. The number of viable target cells was collected every 4 hours with the IncuCyte Zoom System (Essen Bioscience) and expressed as red calibrated units (RCU) × µm3/well. Symbols represent the mean (± SD) percentage cytotoxicity measured at the indicated time points. *P = .03; ***P < .001.
Expression and function of EpoRm-CAR in T cells. (A) Schematic representation of the EpoRm-CAR construct. (B) Flow cytometric dot-plots illustrate surface expression of CAR and EpoR in T cells transduced with EpoRm-CAR; cells transduced with GFP only were used as control. Percentage of cells in each quadrant is shown. Cells were stained with EpoR-PE antibody to detect EpoR expression; CAR expression was detected with goat anti-mouse F(ab′)2 antibody and streptavidin-APC (Jackson ImmunoResearch Laboratories). (C) Percentage of GFP+ cells expressing CAR (left) and EpoR (right) among T lymphocytes transduced with CAR, EpoRm, EpoRm-CAR, or GFP only. Each symbol corresponds to a measurement for one transduction. Horizontal bars indicate median value. (D) Percentage of GFP+ T lymphocytes expressing pSTAT5 after stimulation with 10 IU/mL Epo or pretreatment with 10 µM ruxolitinib before Epo stimulation. Each symbol corresponds to a measurement for one transduction with the construct shown. Horizontal bars indicate median value. (E) Cytotoxicity of T lymphocytes transduced with CAR, EpoRm-CAR, or GFP only against the CD19+ cell lines OP-1, RS4;11, and Nalm6. Bars represent mean (± SD) of triplicate experiments in a 4-hour cytotoxicity assay at a 1:1 E:T ratio. (F) Long-term cytotoxicity of T lymphocytes transduced with various constructs against mCherry+ OP-1 cells at the indicated E:T ratios in the presence of 10 IU/mL Epo. The number of viable target cells was collected every 4 hours with the IncuCyte Zoom System (Essen Bioscience) and expressed as red calibrated units (RCU) × µm3/well. Symbols represent the mean (± SD) percentage cytotoxicity measured at the indicated time points. *P = .03; ***P < .001.
The functionality of EpoRm was not affected by CAR expression (Figure 4D). CAR T-cell function was also retained. In experiments with T cells cocultured with the CD19+ ALL cell line OP-1, exocytosis of cytotoxic granules, as measured by CD107a expression, and production of IFNγ or TNFα, were similar in CAR T cells with or without EpoRm, regardless of whether Epo was in the cultures (supplemental Figure 3A-B). The cytokine profile of EpoRm-CAR T cells cocultured with OP-1 cells with and without Epo and/or IL-2 was generally similar, although higher levels of IL-6 and IL-4 and lower levels of IL-2 with Epo were noted (supplemental Figure 3C; supplemental Tables 1 and 2).
In experiments with 3 ALL cell lines (OP-1, RS4;11, and Nalm6), 4-hour cytotoxicity at a 1:1 E:T ratio with EpoRm-CAR T and CAR T cells was equal, regardless of whether Epo (10 IU/mL) was added to the cultures (Figure 4E). However, when cytotoxicity against OP-1 was tested over 72 hours in the presence of Epo, there was higher killing by EpoRm-CAR T cells over that of CAR T cells at low (1:4, 1:8) E:T ratios (Figure 4F).
Proliferative signals of Epo and IL-2 in EpoRm-CAR T cells
The higher killing exerted by EpoRm-CAR T cells in long-term cultures might have been caused by a higher rate of proliferation of these cells. This was tested in cocultures of T cells (transduced with EpoRm-CAR, CAR alone, or GFP) and OP-1 cells (irradiated or Streck-treated), monitored for 2 weeks; the cultures had Epo (10 IU/mL) but no IL-2. EpoRm-CAR T-cell expansion was greater (Figure 5A), indicating that CAR-driven cell proliferation is enhanced by EpoRm signaling. The presence of Epo in the cultures did not affect the proportion of naive, effector, central memory and effector memory cells among EpoRm-CAR T cells stimulated by CD19+ target cells (Figure 5B).
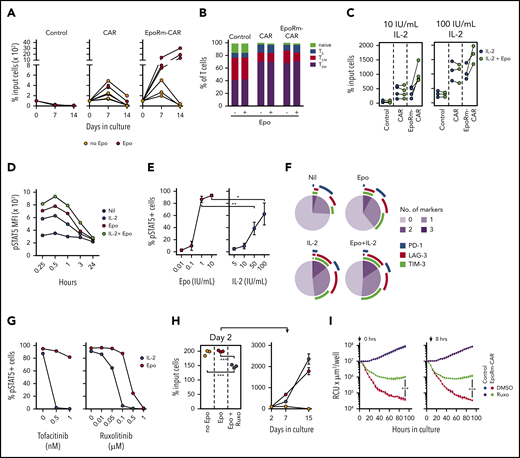
Epo supports the proliferation of EpoRm-CAR-T cells. (A) Survival and expansion of T lymphocytes from 3 donors transduced with CAR, EpoRm-CAR, or GFP only (Control) cocultured with Streck-treated or irradiated OP-1 cells at a 1:1 ratio, in the absence or presence of 10 IU/mL Epo, without exogenous IL-2. Each symbol indicates the percentage of cell recovery compared with the number of input cells. Mean (± SD) of triplicate cultures is shown, except for the day 14 measurement for 1 donor, for whom only the mean of 2 measurements is shown. (B) Proportion of naive (CD45RO‒ CD62L+), effector (TE; CD45RO‒ CD62L‒), central memory (TCM; CD45RO+ CD62L+), and effector memory (TEM; CD45RO+ CD62L‒) T cells in EpoRm-CAR T cells compared with T cells transduced with CAR or GFP only. Shown are mean of 3 experiments with and without Epo (10 IU/mL) after 24-hour culture with RS4;11 cells at a 1:1 ratio. (C) Percentage of T lymphocytes transduced with the various constructs recovered 7 days after coculture with irradiated CD19+ OP-1 at a 1:1 ratio in the presence of 10 IU/mL Epo with 10 IU/mL or 100 IU/mL of IL-2. Each symbol indicates the mean of triplicate cultures. (D) MFI of pSTAT5 in EpoRm-CAR–transduced T cells after stimulation with 10 IU/mL Epo and/or 100 IU/mL IL-2 at the indicated time points. (E) Percentage of GFP+ EpoRm-CAR–transduced T cells expressing pSTAT5 stimulated with the indicated concentrations of Epo and IL-2. *P = .045; **P < .01. (F) Expression of activation and exhaustion markers PD-1, TIM-3, and LAG-3 in T cells expressing EpoRm-CAR cocultured for 6 days with irradiated OP-1 in the presence of 10 IU/mL Epo and/or 10 IU/mL IL-2. Marker expression was analyzed with Diva software, and graphs were plotted with Phyton 3 using Matplotlib package (https://matplotlib.org/). Average measurement of 2 experiments is shown. (G) Percentage of GFP+ cells expressing pSTAT5 in T cells transduced with EpoRm-CAR after exposure to either tofacitinib or ruxolitinib for 1 hour at the indicated doses before stimulation with either 10 IU/mL Epo or 100 IU/mL IL-2. Each dot represents the mean of 2 measurements for tofacitinib and a single measurement for ruxolitinib. (H) Left panel shows the percentage of EpoRm-CAR T cells recovered after 2 days of culture with irradiated RS4;11 cells at a 1:1 ratio in the presence of 10 IU/mL Epo with or without 1 µM ruxolitinib. Cells were then washed to remove ruxolitinib, and cultures were continued for another 2 weeks in the presence of Epo (right); each dot indicates mean (± SD) of triplicate measurements of percentage of cell recovery relative to cell numbers of day 2. ***P < .001. (I) Long-term cytotoxicity of T cells expressing EpoRm-CAR or GFP only (control) against mCherry+ Nalm6 cells at a 1:1 E:T ratio. Epo (10 IU/mL) was added every 2 days, and ruxolitinib (1 µM) or its vehicle (DMSO) were added either at the start of the coculture (left panel) or after 8 hours (right panel). The IncuCyte Zoom System was set to collect the number of viable target cells, expressed as red calibrated units (RCU) × µm3/well, every 4 hours. Shown are mean (± SD) of cultures with T cells from 1 donor. Data from 2 other donors are shown in supplemental Figure 5. ***P < .001.
Epo supports the proliferation of EpoRm-CAR-T cells. (A) Survival and expansion of T lymphocytes from 3 donors transduced with CAR, EpoRm-CAR, or GFP only (Control) cocultured with Streck-treated or irradiated OP-1 cells at a 1:1 ratio, in the absence or presence of 10 IU/mL Epo, without exogenous IL-2. Each symbol indicates the percentage of cell recovery compared with the number of input cells. Mean (± SD) of triplicate cultures is shown, except for the day 14 measurement for 1 donor, for whom only the mean of 2 measurements is shown. (B) Proportion of naive (CD45RO‒ CD62L+), effector (TE; CD45RO‒ CD62L‒), central memory (TCM; CD45RO+ CD62L+), and effector memory (TEM; CD45RO+ CD62L‒) T cells in EpoRm-CAR T cells compared with T cells transduced with CAR or GFP only. Shown are mean of 3 experiments with and without Epo (10 IU/mL) after 24-hour culture with RS4;11 cells at a 1:1 ratio. (C) Percentage of T lymphocytes transduced with the various constructs recovered 7 days after coculture with irradiated CD19+ OP-1 at a 1:1 ratio in the presence of 10 IU/mL Epo with 10 IU/mL or 100 IU/mL of IL-2. Each symbol indicates the mean of triplicate cultures. (D) MFI of pSTAT5 in EpoRm-CAR–transduced T cells after stimulation with 10 IU/mL Epo and/or 100 IU/mL IL-2 at the indicated time points. (E) Percentage of GFP+ EpoRm-CAR–transduced T cells expressing pSTAT5 stimulated with the indicated concentrations of Epo and IL-2. *P = .045; **P < .01. (F) Expression of activation and exhaustion markers PD-1, TIM-3, and LAG-3 in T cells expressing EpoRm-CAR cocultured for 6 days with irradiated OP-1 in the presence of 10 IU/mL Epo and/or 10 IU/mL IL-2. Marker expression was analyzed with Diva software, and graphs were plotted with Phyton 3 using Matplotlib package (https://matplotlib.org/). Average measurement of 2 experiments is shown. (G) Percentage of GFP+ cells expressing pSTAT5 in T cells transduced with EpoRm-CAR after exposure to either tofacitinib or ruxolitinib for 1 hour at the indicated doses before stimulation with either 10 IU/mL Epo or 100 IU/mL IL-2. Each dot represents the mean of 2 measurements for tofacitinib and a single measurement for ruxolitinib. (H) Left panel shows the percentage of EpoRm-CAR T cells recovered after 2 days of culture with irradiated RS4;11 cells at a 1:1 ratio in the presence of 10 IU/mL Epo with or without 1 µM ruxolitinib. Cells were then washed to remove ruxolitinib, and cultures were continued for another 2 weeks in the presence of Epo (right); each dot indicates mean (± SD) of triplicate measurements of percentage of cell recovery relative to cell numbers of day 2. ***P < .001. (I) Long-term cytotoxicity of T cells expressing EpoRm-CAR or GFP only (control) against mCherry+ Nalm6 cells at a 1:1 E:T ratio. Epo (10 IU/mL) was added every 2 days, and ruxolitinib (1 µM) or its vehicle (DMSO) were added either at the start of the coculture (left panel) or after 8 hours (right panel). The IncuCyte Zoom System was set to collect the number of viable target cells, expressed as red calibrated units (RCU) × µm3/well, every 4 hours. Shown are mean (± SD) of cultures with T cells from 1 donor. Data from 2 other donors are shown in supplemental Figure 5. ***P < .001.
In 7-day cocultures with irradiated OP-1 cells, EpoRm-CAR T cells had greater expansion with IL-2 and Epo than with IL-2 alone (Figure 5C). Hence, EpoRm signaling in CAR T cells can enhance the proliferative stimulus of IL-2. Cells exposed to both Epo (10 IU/mL) and IL-2 (100 IU/mL) also had higher pSTAT5 MFI than those exposed to either growth factor (Figure 5D). In side-to-side comparisons, the pSTAT5 levels induced by 1 IU/mL of Epo were significantly higher than those induced by 50 IU/mL IL-2 (P = .0019), and those induced by 10 IU/mL of Epo surpassed those induced by 100 IU/mL of IL-2 (P = .045) (Figure 5E). Epo stimulation caused no major differences in the expression of markers associated with CAR T-cell activation and exhaustion (PD1, TIM3, and LAG3)15 compared with IL-2 stimulation (Figures 5F; supplemental Figure 4).
Control of EpoRm-CAR T-cell function with ruxolitinib
Although STAT5 phosphorylation by Epo is mediated by JAK2, that triggered by IL-2 is mediated by JAK1 and JAK3.29,30 To test the relative effect of JAK inhibitors on EpoRm-CAR T cells exposed to either Epo (10 IU/mL) or IL-2 (100 IU/mL), we pre-treated cells with ruxolitinib, which predominantly inhibits JAK1/JAK2, or tofacitinib, which predominantly inhibits JAK3.32,34 At concentrations that completely abrogated IL-2–driven STAT5 Y694 phosphorylation, neither inhibitor affected Epo-driven STAT5 phosphorylation, which required higher concentrations to be inhibited (Figure 5G). Importantly, EpoRm-CAR T-cell viability was largely retained even after 48 hours with ruxolitinib at concentrations 10 times higher than those that completely blocked Epo-induced STAT5 phosphorylation in only 15 minutes (supplemental Figure 5A). Moreover, while ruxolitinib inhibited EpoRm-CAR-T cell proliferation owing to its combined effects on Epo and IL-2 signaling, cell expansion resumed after its removal from the cultures (Figure 5H).
Ruxolitinib also inhibited long-term cytotoxicity of EpoRm-CAR T cells; Figure 5I displays results with cells from 1 donor, and supplemental Figure 5B presents the data for 2 other donors. Ruxolitinib was effective regardless of whether it was added at the beginning or after 8 hours of culture. Ruxolitinib also inhibited TNFα, IFNγ, and IL-4 secretion; enhanced IL-2 secretion in CAR-T cells regardless of EpoRm expression; and suppressed IL-6 secretion by EpoRm-CAR T cells (supplemental Figure 6A). When the supernatants from coculture of effector and target cells were added to the monocytic cell line THP1, levels of THP1-derived IL-6 markedly increased, but they did not if ruxolitinib was present in the T- and target-cell cocultures (supplemental Figure 6B).
Expression of EpoRm increases CAR T-cell expansion in vivo
To determine the growth capacity of EpoRm-CAR T lymphocytes in vivo, we injected them IV in NOD-scid-IL2RGnull mice. On day 13, percentages of human (h)CD45+ GFP+ cells were higher in mice injected with EpoRm-CAR T cells and 100 IU Epo IP (3 times a week for 2 weeks) than in mice injected with cells transduced with CAR lacking EpoRm or with GFP only, or with EpoRm-CAR T cells without Epo supplementation (Figure 6A-B). Of note, 2 of the 6 EpoRm-CAR T plus Epo mice developed signs of xenogeneic graft-versus-host disease on days 22 and 37 (none of the 14 mice in the other groups did), in line with the higher T-cell proliferation. Levels of mouse hemoglobin and red blood cells did not differ among groups (supplemental Figure 7).
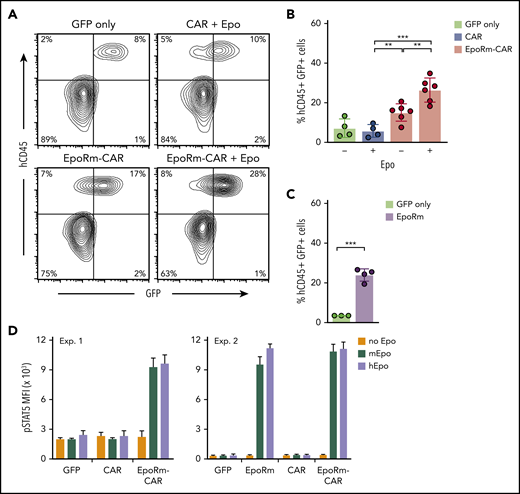
In vivo expansion of EpoRm-CAR-T cells in immunodeficient mice. (A) Representative flow cytometric contour plots illustrate the presence of human CD45+ GFP+ T cells in mouse peripheral blood. (B) Percentage of human CD45+ GFP+ cells in peripheral blood of mice injected IV with T cells transduced with CAR, EpoRm-CAR, or GFP only; some mice received 100 IU Epo IP 3 times a week for 2 weeks, as indicated. Blood was obtained via cheek bleed 13 days after T-cell infusion. **P < .01; ***P < .001. (C) Experiments performed as in panel B with T cells from a different donor transduced with EpoRm or GFP only; no exogenous Epo was administered. ***P < .001. (D) pSTAT5 MFI in T cells transduced with CAR, EpoRm-CAR, EpoRm, or GFP only following 15-minute stimulation with 80 ng/mL of either mouse or human Epo.
In vivo expansion of EpoRm-CAR-T cells in immunodeficient mice. (A) Representative flow cytometric contour plots illustrate the presence of human CD45+ GFP+ T cells in mouse peripheral blood. (B) Percentage of human CD45+ GFP+ cells in peripheral blood of mice injected IV with T cells transduced with CAR, EpoRm-CAR, or GFP only; some mice received 100 IU Epo IP 3 times a week for 2 weeks, as indicated. Blood was obtained via cheek bleed 13 days after T-cell infusion. **P < .01; ***P < .001. (C) Experiments performed as in panel B with T cells from a different donor transduced with EpoRm or GFP only; no exogenous Epo was administered. ***P < .001. (D) pSTAT5 MFI in T cells transduced with CAR, EpoRm-CAR, EpoRm, or GFP only following 15-minute stimulation with 80 ng/mL of either mouse or human Epo.
Even without Epo supplementation, levels of hCD45+ GFP+ cells were higher in mice injected with EpoRm-CAR T or EpoRm cells with no CAR than in mice injected with T cells lacking EpoRm (Figure 6A-C). These results suggested that endogenous murine Epo might stimulate cells expressing human EpoRm (there is considerable homology between murine and human Epo genes).35 Indeed, human and murine Epo produced similar increases in pSTAT5 (Figure 6D), explaining the relative increase in hCD45+ GFP+ cells when EpoRm-CAR T cells were infused without human Epo supplementation.
EpoRm-CAR T cells have increased antileukemic activity in vivo
To assess whether increased numbers of EpoRm-CAR T cells in vivo would provide superior protection against ALL engraftment, we injected T cells at different doses IV in NOD-scid-IL2RGnull mice, followed 14 days later by Nalm6 cells injected IV. At the highest dose of 20 × 106, CAR- and EpoRm-CAR T cells performed equally and rejected leukemic cells in all mice (Figure 7A-B; supplemental Figure 8). At 5 × 10⁶ or 10 × 106, however, EpoRm-CAR T cells were more powerful. For example, in mice injected with 10 × 106 cells, engraftment of ALL cells was only delayed by CAR T cells but completely prevented by EpoRm-CAR T cells. Overall survival was significantly higher in mice that had received EpoRm-CAR T cells vs CAR T cells (P = .0019) (Figure 7C). On day 13, one day before ALL cell inoculation and with no exogenous Epo, the percentage of EpoRm-CAR T cells in peripheral blood was also significantly higher than in mice injected with CAR T cells (P = .0012 for 5 × 10⁶; P = .0062 for 10 × 106) (Figure 7D). Levels of EpoRm-CAR T cells remained higher than those of CAR T cells at subsequent time points (supplemental Figure 9A). Epo administration in mice infused with 5 × 10⁶ EpoRm-CAR T cells further increased their numbers, resulting in CAR T-cell levels comparable to those achieved with 20 × 106 EpoRm-CAR T cells without exogenous Epo (supplemental Figure 10).
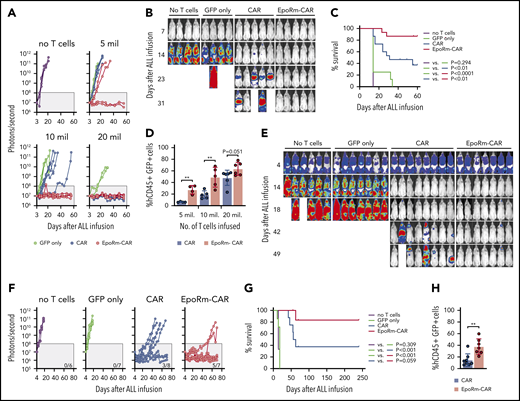
Activity of EpoRm-CART cells in xenograft models of ALL. (A) NOD-scid-IL2RGnull mice were injected IV with 5 to 20 × 106 T cells transduced with CAR, EpoRm-CAR, or GFP only; one group of mice received no T cells. Two weeks later, mice were injected IV with 2.5 × 10⁵ Nalm6 cells expressing luciferase. Nalm6 cell engraftment as measured by luminescence after IP injection of aqueous d-luciferin potassium salt (150 µg/g body weight) is shown. The gray area corresponds to signals <108 photons/second. On day 56, none of the mice that received no T cells, or T cells transduced with GFP only at 5 × 10⁶ (n = 2), 10 × 106 (n = 4), or 20 × 106 (n = 2), had signals <108 photons/second. Likewise, none of the mice that received CAR T cells at 5 × 10⁶ (n = 4) or 10 × 106 (n = 5) remained in remission. By contrast, 2 of the 4 mice that received 5 × 10⁶ EpoRm-CAR T cells and all 5 who received 10 × 106 remained in remission, as did all mice that received 20 × 106 CAR (n = 6) and EpoRm-CAR T cells (n = 6). (B) Ventral images for the mice that received no T cells or 10 × 106 T cells are shown. The full set of images is show in supplemental Figure 8. (C) Aggregate overall survival for mice shown in panels A and B. Survival group according to different levels of cells received is shown in supplemental Figure 8. (D) Presence of T cells in the mice shown in panels A to C 13 days after infusion, before injection of Nalm6 cells. Mouse blood was collected by cheek prick, and cells were stained with APC (2D1; BioLegend) or PE/Cy7-conjugated anti-human CD45 (HI30; BD Pharmingen), and anti-mouse CD45-PE (30-F11; BD Pharmingen), as well as with anti-human CD3-APC (SK7; BD Biosciences) and anti-human CD19-PE (4G7; BD Biosciences). Percentage of human T cells (hCD45+ hCD3+ hCD19– GFP+) among all CD45+ (human and mouse) lymphoid cells is shown. **P < .01. Results of sequential measurements are shown in supplemental Figure 9A. (E) Nalm6 cells transduced with luciferase were injected IV in NOD-scid-IL2RGnull mice (5 × 10⁵ cells per mouse). Four days later, tumor engraftment was assessed, and 10 × 106 T cells were injected IV. Ventral images illustrate Nalm6 cell engraftment as measured by luminescence after IP injection of aqueous d-luciferin potassium salt (150 µg/g body weight). Mice images on day 4 were taken with enhanced sensitivity to illustrate tumor engraftment. (F) Luminescence measurements in the groups of mice shown in panel E. The number of mice in each group with signals <108 photons/second on day 70 is shown. (G) Overall survival of mice shown in panels E and F. (H) Presence of T cells (hCD45+ hCD3+ hCD19– GFP+) in the mice shown in panels E to G 13 days after T-cell infusion. **P < .01. Results of sequential measurements are shown in supplemental Figure 9B.
Activity of EpoRm-CART cells in xenograft models of ALL. (A) NOD-scid-IL2RGnull mice were injected IV with 5 to 20 × 106 T cells transduced with CAR, EpoRm-CAR, or GFP only; one group of mice received no T cells. Two weeks later, mice were injected IV with 2.5 × 10⁵ Nalm6 cells expressing luciferase. Nalm6 cell engraftment as measured by luminescence after IP injection of aqueous d-luciferin potassium salt (150 µg/g body weight) is shown. The gray area corresponds to signals <108 photons/second. On day 56, none of the mice that received no T cells, or T cells transduced with GFP only at 5 × 10⁶ (n = 2), 10 × 106 (n = 4), or 20 × 106 (n = 2), had signals <108 photons/second. Likewise, none of the mice that received CAR T cells at 5 × 10⁶ (n = 4) or 10 × 106 (n = 5) remained in remission. By contrast, 2 of the 4 mice that received 5 × 10⁶ EpoRm-CAR T cells and all 5 who received 10 × 106 remained in remission, as did all mice that received 20 × 106 CAR (n = 6) and EpoRm-CAR T cells (n = 6). (B) Ventral images for the mice that received no T cells or 10 × 106 T cells are shown. The full set of images is show in supplemental Figure 8. (C) Aggregate overall survival for mice shown in panels A and B. Survival group according to different levels of cells received is shown in supplemental Figure 8. (D) Presence of T cells in the mice shown in panels A to C 13 days after infusion, before injection of Nalm6 cells. Mouse blood was collected by cheek prick, and cells were stained with APC (2D1; BioLegend) or PE/Cy7-conjugated anti-human CD45 (HI30; BD Pharmingen), and anti-mouse CD45-PE (30-F11; BD Pharmingen), as well as with anti-human CD3-APC (SK7; BD Biosciences) and anti-human CD19-PE (4G7; BD Biosciences). Percentage of human T cells (hCD45+ hCD3+ hCD19– GFP+) among all CD45+ (human and mouse) lymphoid cells is shown. **P < .01. Results of sequential measurements are shown in supplemental Figure 9A. (E) Nalm6 cells transduced with luciferase were injected IV in NOD-scid-IL2RGnull mice (5 × 10⁵ cells per mouse). Four days later, tumor engraftment was assessed, and 10 × 106 T cells were injected IV. Ventral images illustrate Nalm6 cell engraftment as measured by luminescence after IP injection of aqueous d-luciferin potassium salt (150 µg/g body weight). Mice images on day 4 were taken with enhanced sensitivity to illustrate tumor engraftment. (F) Luminescence measurements in the groups of mice shown in panel E. The number of mice in each group with signals <108 photons/second on day 70 is shown. (G) Overall survival of mice shown in panels E and F. (H) Presence of T cells (hCD45+ hCD3+ hCD19– GFP+) in the mice shown in panels E to G 13 days after T-cell infusion. **P < .01. Results of sequential measurements are shown in supplemental Figure 9B.
In another model, we first injected Nalm6 cells IV. On day 4, mice were distributed in 4 groups with similar tumor load. Three groups received either CAR T cells, EpoRm-CAR T cells, or T cells transduced with GFP only IV, and a fourth group received tissue culture medium only. ALL cells rapidly expanded in the untreated mice and in mice that received control T cells without CAR. Both CAR and EpoRm-CAR-T cells markedly reduced leukemic signals, but only the latter induced prolonged remissions in most mice (Figure 7E-F; supplemental Figure 11). Median survival was 60 days for mice receiving CAR T cells while it was not reached for those receiving EpoR-CAR T cells (P = .059) (Figure 7G). In line with their superior antitumor activity, the number of CAR T cells in peripheral blood was significantly higher if the cells also expressed EpoRm (Figure 7H; supplemental Figure 9B).
Discussion
The success of adoptive T-cell immunotherapy depends on generating levels of effector cells in vivo sufficient to reduce tumor burden and control residual disease. To induce selective in vivo expansion of infused T lymphocytes and, hence, increase their antitumor capacity, we expressed EpoR in human T lymphocytes. EpoR was functional, and Epo could trigger signals that promoted T-cell activation and survival. A naturally occurring truncated form of EpoR (EpoRm), which augments Epo signaling in erythrocyte progenitors,23,33 had higher expression in T lymphocytes and induced a more powerful stimulation than its wild-type counterpart. Anti-CD19 CAR T cells equipped with EpoRm had superior cell growth in the presence of Epo, resulting in higher killing of CD19+ ALL cells in long-term cultures and a better suppression of leukemia cell growth in xenograft models. In mice, physiologic levels of murine Epo were sufficient to stimulate EpoRm-CAR T cells, suggesting that preferential expansion of adoptive T cells might be achieved in patients without the need for further Epo administration.
Expansion and persistence of CAR T cells are important determinants of treatment response,10,36 and blood levels of CAR T cells after infusion vary widely among patients.10,11,37 This difference depends on several factors, including number and quality of CAR T cells infused, signaling properties of the CAR, and degree of lymphodepletion before CAR T-cell infusion, as well disease distribution, expression of stimulatory ligands, and residual tumor load.9 EpoRm provides a significant boost to CAR T cell expansion and, therefore, might potentially overcome other limiting factors. A study of Epo response in the human erythroleukemia cell line TF-1 reported a 10-fold lower potency of murine Epo,38 whereas EpoRm-CAR T cells were activated equally well by murine and human Epo, presumably because the mutant receptor increased sensitivity to murine Epo. T cells expressing EpoRm were stimulated by murine Epo regardless of CAR expression, suggesting that CAR-derived tonic signaling did not augment sensitivity to Epo. Levels of Epo in mouse serum or plasma typically range between 0.001 and 0.03 IU/mL39,40 ; reported mean values in humans are between 0.010 and 0.030 IU/mL.41-43 In patients with leukemia, lymphoma, or solid tumors undergoing hematopoietic stem cell transplantation (a patient population comparable to candidates for adoptive T-cell immunotherapy), serum Epo levels were 0.079 ± 0.133 IU/mL before chemotherapy and increased to 0.213 ± 0.141 IU/mL after cessation of therapy before transplantation, reaching a peak of 0.284 ± 0.190 IU/mL 7 days’ posttransplant.44 Higher levels, approaching or exceeding 1 IU/mL, have been measured in patients with anemia.45 Thus, endogenous Epo should be sufficient to preferentially stimulate EpoRm-expressing T cells.
Our finding that EpoR can effectively signal in T cells differs from an early study using the murine IL-2–dependent T-cell line CTL-D as a model to test whether ectopic expression of EpoR could render these cells sensitive to Epo.46 Because CTL-D cells remained unresponsive, the authors developed a chimeric EpoR that contained the intracellular IL-2 receptor subunits β and γ. We found that 1 IU of Epo was at least equivalent to 100 IU of IL-2 on EpoRm-CAR T cells. We also observed differences in Epo and IL-2 signaling in T cells and synergistic activity, indicating that a combination of Epo and IL-2 signaling would provide a more powerful stimulus to CAR T cells than either cytokine alone.
Together with remarkable clinical responses, T-cell infusions can also produce serious toxicities, as shown by cytokine release syndrome (CRS) and neurotoxicity occurring in patients receiving CAR T cells.47-50 Conceivably, infusion of EpoRm-CAR T cells could carry a higher risk of toxicity. Nevertheless, we found that Epo-stimulated EpoRm-CAR T cells did not secrete higher amounts of IL-1, a cytokine implicated in CRS and neurotoxicity.51,52 We did observe higher production of IL-6, although the high levels of IL-6 in patients with CRS post-CAR T cells are primarily derived from macrophages.50-52 We contend that the higher survival capacity of EpoRm-CAR T cells may allow the infusion of lower numbers of CAR T cells, which may expand gradually and carry a lower risk of CRS than larger numbers of CAR T cells. Lowering the number of infused T cells should also facilitate protocols for cell preparation, possibly allowing replacement of leukapheresis with a blood draw, and might reduce costs of the procedure. Moreover, adequate T-cell expansion in vivo might be achieved with less aggressive lymphodepletion before infusion. It should be noted that ruxolitinib can completely shut down EpoRm signaling without affecting CAR-T cell viability, and therefore it could provide a safeguard to prevent excessive EpoRm-CAR-T expansion.
The results of this study show that EpoRm expression can convert Epo into a powerful growth factor for T cells, supporting their specific expansion and enhancing their antitumor activity. Although endogenous Epo is sufficient to sustain EpoRm-T cells, exogenous Epo, commonly administered in oncology, might further increase their numbers.
Conversely, the effects of Epo can be abrogated with ruxolitinib, providing a way to adjust adoptive T-cell numbers in vivo. Although we focused on CAR T cells, there are other settings in which specific stimulation of infused T cells could be useful. Thus, EpoRm expression could support T cells engineered with antibody-coupled T-cell receptors,53 with T-cell receptors directed against tumor antigens and viral peptides associated with cancer,54,55 as well as promote the expansion of tumor-infiltrating lymphocytes.1
Original data can be obtained by contacting the corresponding author.
The online version of this article contains a data supplement.
The publication costs of this article were defrayed in part by page charge payment. Therefore, and solely to indicate this fact, this article is hereby marked “advertisement” in accordance with 18 USC section 1734.
Acknowledgment
This study was supported by grant NMRC/STaR/0025/2015a from the National Medical Research Council of Singapore.
Authorship
Contribution: N.V., A.Y., and M.I. developed the EpoR, performed experiments, and analyzed data; D.W., Y.T.P., and S.V.S. performed experiments and analyzed data; and D.C. designed the study, analyzed data, and wrote the manuscript with N.V. and the input of the other authors.
Conflict-of-interest disclosure: N.V., A.Y., M.I., and D.C. are coinventors in patent applications describing the technologies used. D.C. is scientific founder, stockholder, and consultant of Unum Therapeutics, Nkarta Therapeutics, and MediSix Therapeutics. The remaining authors declare no competing financial interests.
Correspondence: Dario Campana, Department of Paediatrics, Yong Loo Lin School of Medicine, National University of Singapore, Centre for Translational Medicine, 14 Medical Dr, Level 9 South, Singapore 117599; e-mail: paedc@nus.edu.sg.

This feature is available to Subscribers Only
Sign In or Create an Account Close Modal