

Key Points
Reduced expression of miR-146a defines a subgroup of AML patients with inflammaging and poor outcome.
Reducing IL6- or TNF-mediated inflammation in miR-146a−/− mice prevents premature HSC aging and delays onset of malignancy.

Abstract
Aging is associated with significant changes in the hematopoietic system, including increased inflammation, impaired hematopoietic stem cell (HSC) function, and increased incidence of myeloid malignancy. Inflammation of aging (“inflammaging”) has been proposed as a driver of age-related changes in HSC function and myeloid malignancy, but mechanisms linking these phenomena remain poorly defined. We identified loss of miR-146a as driving aging-associated inflammation in AML patients. miR-146a expression declined in old wild-type mice, and loss of miR-146a promoted premature HSC aging and inflammation in young miR-146a–null mice, preceding development of aging-associated myeloid malignancy. Using single-cell assays of HSC quiescence, stemness, differentiation potential, and epigenetic state to probe HSC function and population structure, we found that loss of miR-146a depleted a subpopulation of primitive, quiescent HSCs. DNA methylation and transcriptome profiling implicated NF-κB, IL6, and TNF as potential drivers of HSC dysfunction, activating an inflammatory signaling relay promoting IL6 and TNF secretion from mature miR-146a−/− myeloid and lymphoid cells. Reducing inflammation by targeting Il6 or Tnf was sufficient to restore single-cell measures of miR-146a−/− HSC function and subpopulation structure and reduced the incidence of hematological malignancy in miR-146a−/− mice. miR-146a−/− HSCs exhibited enhanced sensitivity to IL6 stimulation, indicating that loss of miR-146a affects HSC function via both cell-extrinsic inflammatory signals and increased cell-intrinsic sensitivity to inflammation. Thus, loss of miR-146a regulates cell-extrinsic and -intrinsic mechanisms linking HSC inflammaging to the development of myeloid malignancy.
Introduction
HSCs maintain a lifelong supply of blood cells,1 but chronic inflammation or aging significantly impair HSC self-renewal and skew propensity toward myeloid differentiation.2-4 Inflammation in the absence of infection, or sterile inflammation, is a hallmark of aging termed inflammaging.5,6 The primary cytokines associated with inflammaging, which are interleukin-1 (IL1), IL6, and tumor necrosis factor (TNF), have been associated with systemic age-related functional decline and mortality in multiple studies.7-12 IL1 and TNF have been implicated in the impairment of HSC function in mouse models of chronic inflammation.13,14 Thus, it has been proposed that HSC aging occurs by a process of inflammaging, but molecular regulators of HSC inflammaging remain poorly defined.4 HSC dysfunction, inflammation, and aging are also associated with myeloid malignancies, such as myelodysplastic syndromes (MDS) and acute myeloid leukemia (AML).15-20 This raises the possibility that mechanisms driving inflammation may occur in HSC aging and establish a cell state that is a precursor to leukemic transformation.
There is no empirical evidence that HSC inflammaging is linked directly to development of myeloid malignancy, to our knowledge. However, levels of multiple proinflammatory cytokines are elevated in AML and MDS patients, including TNF, IL1, IL6, IL8, interferon-γ (IFNγ), and vascular endothelial growth factor.21-26 Furthermore, elevated TNF at diagnosis is an adverse prognostic factor for AML or high-risk MDS,27 suggesting possible mechanistic involvement in disease progression. Establishing a mechanistic link between HSC inflammaging and myeloid malignancy would provide evidence that anti-inflammatory therapies may be beneficial adjuvants to traditional chemotherapy regimens, or as a preventive approach, for myeloid malignancies.
Several microRNAs (miRNAs) have been identified as critical regulators of inflammation.25,28 Some of these miRNAs are downregulated or overexpressed in myeloid malignancies and have been implicated in the pathogenesis of myeloid malignancy.25,29 Thus, we hypothesized that altered miRNA expression is a potential mechanism linking HSC inflammaging and the development of myeloid malignancy. In this study, we performed high-throughput sequencing of messenger RNA (mRNA) and miRNA on 102 de novo AML samples to identify miRNAs that potentially repress inflammaging pathways in human AML. We present a single-cell resolution analysis of HSC function for the top candidate involved in inflammaging and myeloid malignancy, miR-146a.
Methods
See the supplemental Methods, available on the Blood Web site, for additional information.
AML samples
AML samples were collected from 102 patients with primary AML (age, 17-77 years; median, 45.6 years; 52% male). See supplemental Tables 1-4 and supplemental Figure 2 for subgroup comparisons. See supplemental Methods for ethics approval information.
Mice
All strains were bred and maintained in house at the BC Cancer Research Centre Animal Resource Centre barrier facility. Experiments were performed in 10- to 14-week-old male and female mice, unless otherwise indicated. See supplemental Methods for ethics approval details.
Gene expression profiling
RNA sequencing (RNA-seq) of fluorescence-activated cell sorting-identified mouse Lin−Sca-1+c-Kit+ (LSK) cells or AML patient samples, and miRNA-seq of AML samples was performed by using methods and data processing, as described.30-32
DNA methylation profiling
Flow cytometric analysis and sorting
Cells were stained with fluorochrome-conjugated primary antibodies and processed on a BD LSRFortessa or BD FACSAria (III or Fusion). Index data were collected during single-cell sorting, and fluorochrome mean fluorescence intensities were normalized when combining replicates. Gating boundaries were defined by using fluorescence-minus-one controls.
Single-ESLAM division kinetics
The timing of single ESLAM cell division was determined, as previously described.34 Where noted, cytokine stimulation with 50 ng/mL mouse recombinant IL6 (78052.1; StemCell Technologies) was performed.
Single-ESLAM clone proliferation and differentiation
Single ESLAM clones at 10 days after sorting were stained and analyzed by flow cytometry, using the LSK staining panel with the addition of AccuCheck Counting Beads (PCB100; Invitrogen) for absolute cell count calculations. Clone size represents the number of live cells per clone. The Lin−Sca-1−c-Kit+ (LK) count represents the number of LK cells per clone.
Statistics
Sample numbers reported in figure legends represent biological replicates. Animals were excluded from analyses if illness was attributable to known causes unrelated to hematopoietic issues (eg, fight wounds, malocclusion). Statistical tests were 2-sided and were chosen based on whether the data met the assumptions, including normality and homogeneity of variances. In comparisons between multiple variables, correction was applied. Statistical software included GraphPad Prism 7 (murine survival curve analyses), gene set enrichment analysis (GSEA),35 or Ingenuity Pathway Analysis (IPA)36 (QIAGEN) for gene expression program analyses, and RStudio, for all other analyses.
Results
miR-146a limits inflammaging pathway activity in human AML
To determine if increased inflammation in myeloid malignancy21-26 could be an effect of aging (ie, inflammaging), we performed whole-transcriptome sequencing (mRNA-seq) of 102 de novo AML samples and compared gene expression in aged patient samples to that in young patient samples (supplemental Table 1). Using GSEA,35 we compared the expression of inflammaging pathway target genes (IPTGs) of the primary inflammaging cytokines IL1, IL6, and TNF. IPTGs were upregulated in samples from old vs young AML patients (Figure 1A). This result was replicated in The Cancer Genome Atlas (TCGA) adult AML cohort with an even stronger signal (Figure 1A; supplemental Table 2). In CD34+ cells of aged vs young individuals,37 IPTGs were upregulated with age to a similar extent as in our AML cohort (Figure 1B). Thus, inflammaging may play a role in the pathogenesis of AML in older individuals.
![miR-146a limits inflammaging in human AML. (A) GSEA plots showing enrichment of inflammaging pathway target gene expression in aged vs young primary AML patient samples in this study’s AML cohort and in the TCGA adult AML cohort. (B) GSEA plot showing enrichment of inflammaging pathway target gene expression in aged vs young, normal CD34+ cells (microarray data from Pang et al37). (C) Number of miRNA genes significantly anticorrelated (Spearman’s false discovery rate [FDR]–adjusted P < .01) with inflammaging pathway target gene expression in this study and the TCGA cohort. (D) Ranking of overlapping miRNA candidates from panel C that were predicted to bind to >2 inflammaging pathway target genes. Ranking is based on the average rank of predicted seed sequences in inflammaging pathway target transcripts. Better-ranking candidates have lower average and overall rank scores. (E) Kaplan-Meier survival analysis of AML patients (this study’s cohort) with low (bottom tertile) vs high (top tertile) miR-146a expression. P by log-rank. (F) GO term EnrichmentMap of the largest gene expression network upregulated in miR-146a low vs miR-146a high AML. EnrichmentMap cutoffs: FDR <0.075; P < .005, and overlap >.75. AutoAnnotate network labels: Markov cluster analysis of GO term names. (G) GSEA hallmark gene sets upregulated in miR-146a low vs miR-146a high AML in this study and the TCGA cohort (normalized enrichment score [NES] >1.5). (H) GSEA plots showing enrichment of cytokine signaling hallmark gene sets in genes upregulated in miR-146a low vs miR-146a high AML.](https://ash.silverchair-cdn.com/ash/content_public/journal/blood/135/25/10.1182_blood.2019003105/1/m_bloodbld2019003105f1-1.png?Expires=1769696961&Signature=XLmt7FXWayxW5vleotxy99aWiSiY4zqxjKL-hifTx9ZgiNeKneeh1adsd5QJ~JKKfQnl6foPlmgJolipCewnfX8z~3YzczdaZ3vbeIJJWSWq5A3iWeMGv7A1ywBKWIbTHysauv0kUwFIXgo3ihsLEuRL98WY5HaxZZAxiIxWl-vi~6SQ6Axcnt6ah3pQEesdR7NGJA5deeK15nCNwH50q0EiNkhVYqciu3bHORcSNtSnKZ8xgfexwVsb2JvvxEXtTWWrH4-HG0~iXiq-5fDute-leaGt4cUlGglx51zOxyHqZkADt6HYaE4QE1SmOBLvF4y7nFKP7hU08L7~wPvpWw__&Key-Pair-Id=APKAIE5G5CRDK6RD3PGA)
![miR-146a limits inflammaging in human AML. (A) GSEA plots showing enrichment of inflammaging pathway target gene expression in aged vs young primary AML patient samples in this study’s AML cohort and in the TCGA adult AML cohort. (B) GSEA plot showing enrichment of inflammaging pathway target gene expression in aged vs young, normal CD34+ cells (microarray data from Pang et al37). (C) Number of miRNA genes significantly anticorrelated (Spearman’s false discovery rate [FDR]–adjusted P < .01) with inflammaging pathway target gene expression in this study and the TCGA cohort. (D) Ranking of overlapping miRNA candidates from panel C that were predicted to bind to >2 inflammaging pathway target genes. Ranking is based on the average rank of predicted seed sequences in inflammaging pathway target transcripts. Better-ranking candidates have lower average and overall rank scores. (E) Kaplan-Meier survival analysis of AML patients (this study’s cohort) with low (bottom tertile) vs high (top tertile) miR-146a expression. P by log-rank. (F) GO term EnrichmentMap of the largest gene expression network upregulated in miR-146a low vs miR-146a high AML. EnrichmentMap cutoffs: FDR <0.075; P < .005, and overlap >.75. AutoAnnotate network labels: Markov cluster analysis of GO term names. (G) GSEA hallmark gene sets upregulated in miR-146a low vs miR-146a high AML in this study and the TCGA cohort (normalized enrichment score [NES] >1.5). (H) GSEA plots showing enrichment of cytokine signaling hallmark gene sets in genes upregulated in miR-146a low vs miR-146a high AML.](https://ash.silverchair-cdn.com/ash/content_public/journal/blood/135/25/10.1182_blood.2019003105/1/m_bloodbld2019003105f1-2.png?Expires=1769696961&Signature=SG4u2kWeYVHYrsDMifRqO0H5S4rhWdElfXZ4nGzXkymfUibPBoAk1Kk5PDZRMpUHENii9M-Yu~iNsBd0LpVVOmh9Huq3HAlxiGKwMGmXY6u0k8Is1j4Zj2ZhI851UbMmLm0BQyDQEOKybYaFs2d8AsQlavtOEY8Jozo0GrfSK~yXnw59bqIlzT8xrZPNqIAYdOXb~UrFbjZleg1xwaN24NwUhMv6bPSV0cm9Ed2J5dm5yuFAXD-FVJjr4HtOT0vmWl1H4z1cL--P-mFRFgI3P7Xmgs9rUW0ztrdu6SGFWZ4DmJ0fmFL06P7yWB1y1Iy-~0t39GJbglYHUlKnuvpWvw__&Key-Pair-Id=APKAIE5G5CRDK6RD3PGA)
miR-146a limits inflammaging in human AML. (A) GSEA plots showing enrichment of inflammaging pathway target gene expression in aged vs young primary AML patient samples in this study’s AML cohort and in the TCGA adult AML cohort. (B) GSEA plot showing enrichment of inflammaging pathway target gene expression in aged vs young, normal CD34+ cells (microarray data from Pang et al37 ). (C) Number of miRNA genes significantly anticorrelated (Spearman’s false discovery rate [FDR]–adjusted P < .01) with inflammaging pathway target gene expression in this study and the TCGA cohort. (D) Ranking of overlapping miRNA candidates from panel C that were predicted to bind to >2 inflammaging pathway target genes. Ranking is based on the average rank of predicted seed sequences in inflammaging pathway target transcripts. Better-ranking candidates have lower average and overall rank scores. (E) Kaplan-Meier survival analysis of AML patients (this study’s cohort) with low (bottom tertile) vs high (top tertile) miR-146a expression. P by log-rank. (F) GO term EnrichmentMap of the largest gene expression network upregulated in miR-146a low vs miR-146a high AML. EnrichmentMap cutoffs: FDR <0.075; P < .005, and overlap >.75. AutoAnnotate network labels: Markov cluster analysis of GO term names. (G) GSEA hallmark gene sets upregulated in miR-146a low vs miR-146a high AML in this study and the TCGA cohort (normalized enrichment score [NES] >1.5). (H) GSEA plots showing enrichment of cytokine signaling hallmark gene sets in genes upregulated in miR-146a low vs miR-146a high AML.
miR-146a limits inflammaging in human AML. (A) GSEA plots showing enrichment of inflammaging pathway target gene expression in aged vs young primary AML patient samples in this study’s AML cohort and in the TCGA adult AML cohort. (B) GSEA plot showing enrichment of inflammaging pathway target gene expression in aged vs young, normal CD34+ cells (microarray data from Pang et al37 ). (C) Number of miRNA genes significantly anticorrelated (Spearman’s false discovery rate [FDR]–adjusted P < .01) with inflammaging pathway target gene expression in this study and the TCGA cohort. (D) Ranking of overlapping miRNA candidates from panel C that were predicted to bind to >2 inflammaging pathway target genes. Ranking is based on the average rank of predicted seed sequences in inflammaging pathway target transcripts. Better-ranking candidates have lower average and overall rank scores. (E) Kaplan-Meier survival analysis of AML patients (this study’s cohort) with low (bottom tertile) vs high (top tertile) miR-146a expression. P by log-rank. (F) GO term EnrichmentMap of the largest gene expression network upregulated in miR-146a low vs miR-146a high AML. EnrichmentMap cutoffs: FDR <0.075; P < .005, and overlap >.75. AutoAnnotate network labels: Markov cluster analysis of GO term names. (G) GSEA hallmark gene sets upregulated in miR-146a low vs miR-146a high AML in this study and the TCGA cohort (normalized enrichment score [NES] >1.5). (H) GSEA plots showing enrichment of cytokine signaling hallmark gene sets in genes upregulated in miR-146a low vs miR-146a high AML.
To identify potential regulators of inflammaging in myeloid malignancy, we compared the expression of IPTGs to that of miRNA (miRNA-seq) in our patient cohort and in the TCGA cohort. We identified 19 miRNAs common to both AML cohorts that were significantly anticorrelated with IPTG expression (Figure 1C). To identify miRNAs that directly regulate IPTGs, we ranked the overlapping candidates based on the average rank of predicted seed sequences within IPTG transcripts across the Miranda, PicTar, Targetscan, DIANA, and miRDB databases, using miRNAtap.38 We identified miR-146a as the top candidate miRNA regulator of the inflammaging pathway activity in AML (Figure 1D; supplemental Figure 1A-B).
Reduced miR-146a expression is associated with poor outcome in AML
miR-146a is located on chromosome 5q and is deleted in a subset of del(5q) MDS patients.39 To determine if reduced miR-146a expression affects patient outcomes, we compared the survival of patients to low vs high (bottom vs top tertile) miR-146a expression (supplemental Tables 3 and 4). Low miR-146a expression was significantly associated with reduced survival compared with high miR-146a expression in our AML cohort, and a similar trend was observed in the TCGA cohort (Figure 1E; supplemental Figure 2A). Low miR-146a expression was a significant predictor of poor survival in a univariable Cox proportional hazards model in both cohorts and was a significant predictor of poor survival in a multivariable model that included all significant univariable predictors in our cohort (supplemental Figure 2B-E). A similar trend was observed in a multivariable model for the TCGA cohort (supplemental Figure 2E). The European LeukemiaNet (ELN) adverse-risk category and advanced patient age were strong predictors of poor outcome in both cohorts in multivariable models (supplemental Figure 2B-E). Patients with low vs high miR-146a expression showed no difference in ELN risk category distribution in our cohort (supplemental Table 3). In the TCGA cohort, patients with low vs high miR-146a showed a significant difference in ELN risk category. However, the poor survival of patients with low miR-146a expression could not be explained by a higher proportion of 2patients with ELN adverse risk, because the low miR-146a expression group contained less patients with ELN adverse risk than did the high miR-146a expression group (25.9% vs 42.1%; supplemental Table 4). Considering both cohorts, our results suggested that ELN risk category alone did not account for survival differences between these miR-146a expression groups, consistent with an independent role of low miR-146a in poor outcomes. The patient group with low miR-146a expression contained a higher proportion of aged patients, whereas the group with high miR-146a expression contained a higher proportion of young patients in our cohort (supplemental Figure 2F). Because the ELN adverse-risk category was a significant contributor in multivariable survival models in both cohorts, we also assessed the relationship between miR-146a expression and age among patients in whom ELN adverse risk was not a potential confounding factor. Examining the subset of patients in low or intermediate ELN risk groups only, a relationship between low miR-146a expression and advanced age was apparent in both cohorts (supplemental Figure 2F). We did not observe consistent differences in mutations that were predictors of survival in low miR-146a expressors between the 2 cohorts (supplemental Figure 2G-I), suggesting that reduced miR-146a expression is not consistently associated with specific mutations.
Deletions on chromosome 5 were detected in a minority of patients with low miR-146a expression (supplemental Table 3 and 4), indicating that reduced miR-146a expression can occur by mechanisms independent of deletion. miR-146a regulation appeared to occur at the level of transcription, not at the level of miRNA processing, given that pri-miR-146a expression correlated significantly with mature miR-146a expression levels (supplemental Figure 3A-B). These findings were consistent with a model in which reduced miR-146a expression occurs in aging and contributes to poor patient outcomes.
Reduced miR-146a expression promotes inflammation in AML
We and others have shown that miR-146a represses innate immune signaling.39-41 We performed network analysis of differentially expressed gene ontology (GO) terms in AML samples with low vs high miR-146a, and identified broad upregulation of immune responses and cytokine signaling pathways in low-miR-146a AML (Figure 1F; supplemental Figure 3C). GSEA hallmark analysis identified TNF signaling via NF-κB, IFNγ response, and IL6 JAK STAT3 signaling as the top upregulated cytokine signaling pathways in low-miR-146a AML, in both our cohort and in the TCGA cohort (Figure 1G-H; supplemental Figure 3D). Thus, reduced miR-146a expression is associated with increased inflammation in AML, in line with a role as a regulator of inflammaging.
HSC aging phenotypes arise in young miR-146a−/− mice
Loss of miR-146a promotes development of myeloid malignancy in mice, and this effect is accelerated by chronic immune stimulation with lipopolysaccharide.39,40,42-45 However, the impact of miR-146a loss on HSC function before the onset of overt disease is not understood. We thus sought to determine if loss of miR-146a promotes myeloid malignancy by a process of HSC inflammaging. Aged mice exhibit expansion of the immunophenotypic HSC pool, but reduction of functional, serially transplantable HSCs.46 We assessed immunophenotypic HSCs in young (10-14-week-old) miR-146a−/− mice with the markers EPCR+CD45+CD150+CD48− (“ESLAM”; Figure 2A), which identifies a population of long-term HSCs with ∼40% durable repopulating activity in vivo.47,48 The frequency of immunophenotypic HSCs increased significantly in miR-146a−/− vs wild-type (WT) bone marrow (BM; Figure 2B). We assessed serial transplantation activity of miR-146a−/− HSCs in competitive primary transplants followed by secondary transplants with limiting dilution analysis (2° LDA; Figure 2A). Although there was no significant difference in competitive engraftment of miR-146a−/− vs WT marrow at 16 weeks (supplemental Figure 4A), 2° LDA revealed a significant reduction in serially transplantable miR-146a−/− HSCs compared with WT cells (Figure 2C-D).
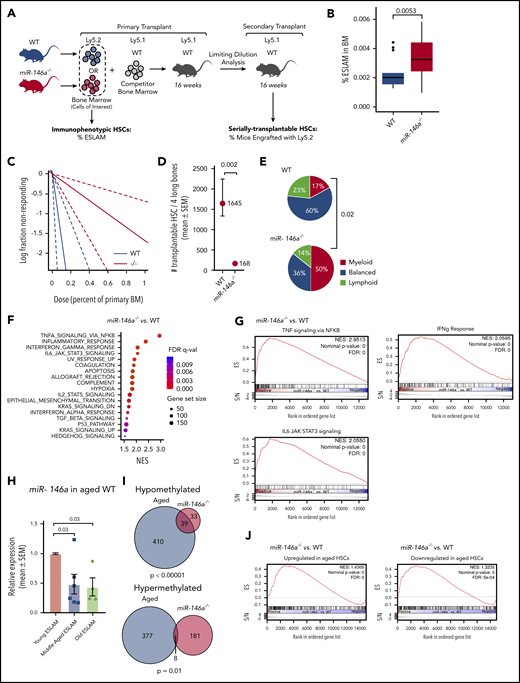
Loss of miR-146a promotes HSC aging in young, naïve mice. (A) Strategy for examining the impact of miR-146a deletion on frequency of immunophenotypic and serially transplantable HSCs. (B) Frequency of ESLAMs in BM of WT vs miR-146a−/− mice (n = 16; 21 mice; P by Student t test). (C) Extreme limiting dilution analysis (ELDA) plot for secondary transplants with WTLy5.2 vs miR-146a−/−Ly5.2 BM (n = 15 mice per genotype, with 4 dilutions). (D) Number of serially transplantable HSCs estimated from ELDA analysis in panel C. SEM, standard error of the mean (P by ELDA). (E) Proportion of single ESLAMs with myeloid, balanced, or lymphoid output profile in single-cell transplants from WT vs miR-146a−/− (n = 49; 14 transplants). Data for WT mice are from a previously published study.34 P by Fisher’s exact test comparing myeloid outputs. (F) GSEA hallmark gene sets upregulated in miR-146a−/− vs WT LSK HSPCs (NES >1.5). (G) GSEA plots showing enrichment of cytokine signaling hallmark gene sets in genes upregulated in miR-146a−/− vs WT LSK HSPCs. (H) miR-146a expression in young (10-12 weeks), middle-aged (12 months), and old (18 months) WT ESLAMs (n = 10 young, 6 middle-aged, 4 old mice; P by Student t test). (I) Overlap between differentially methylated genes in aged vs young WT HSCs from Sun et al54 (labeled Aged) and in miR-146a−/− (n = 6) vs WT (n = 12) HSPCs (labeled: miR-146a−/−). P by Fisher’s exact test. (J) GSEA plots showing enrichment of genes up- or downregulated in aged HSCs54 in miR-146a−/− vs WT LSK HSPCs.
Loss of miR-146a promotes HSC aging in young, naïve mice. (A) Strategy for examining the impact of miR-146a deletion on frequency of immunophenotypic and serially transplantable HSCs. (B) Frequency of ESLAMs in BM of WT vs miR-146a−/− mice (n = 16; 21 mice; P by Student t test). (C) Extreme limiting dilution analysis (ELDA) plot for secondary transplants with WTLy5.2 vs miR-146a−/−Ly5.2 BM (n = 15 mice per genotype, with 4 dilutions). (D) Number of serially transplantable HSCs estimated from ELDA analysis in panel C. SEM, standard error of the mean (P by ELDA). (E) Proportion of single ESLAMs with myeloid, balanced, or lymphoid output profile in single-cell transplants from WT vs miR-146a−/− (n = 49; 14 transplants). Data for WT mice are from a previously published study.34 P by Fisher’s exact test comparing myeloid outputs. (F) GSEA hallmark gene sets upregulated in miR-146a−/− vs WT LSK HSPCs (NES >1.5). (G) GSEA plots showing enrichment of cytokine signaling hallmark gene sets in genes upregulated in miR-146a−/− vs WT LSK HSPCs. (H) miR-146a expression in young (10-12 weeks), middle-aged (12 months), and old (18 months) WT ESLAMs (n = 10 young, 6 middle-aged, 4 old mice; P by Student t test). (I) Overlap between differentially methylated genes in aged vs young WT HSCs from Sun et al54 (labeled Aged) and in miR-146a−/− (n = 6) vs WT (n = 12) HSPCs (labeled: miR-146a−/−). P by Fisher’s exact test. (J) GSEA plots showing enrichment of genes up- or downregulated in aged HSCs54 in miR-146a−/− vs WT LSK HSPCs.
HSCs from old mice and humans also exhibit increased myeloid differentiation.46 We examined the myeloid bias of miR-146a−/− HSCs in single-cell transplants. Based on their contribution to peripheral blood lineages, HSCs can be classified as having a primarily myeloid, lymphoid, or balanced lymphomyeloid output.47,49 Compared with WT, miR-146a−/− ESLAMs were skewed toward myeloid differentiation, at the expense of balanced and lymphoid outputs (Figure 2E). Together, the miR-146a−/− HSC immunophenotyping, serial transplantation, and differentiation characteristics are similar to phenotypes observed in old WT HSCs,46 suggesting that loss of miR-146a promotes premature HSC aging.
To determine whether HSC inflammation occurs in miR-146a−/− mice before the onset of malignancy, we performed RNA-seq analysis of the hematopoietic stem and progenitor cell (HSPC) compartment (LSK cells) of young, naïve miR-146a−/− vs WT mice. GSEA hallmark analysis identified TNF signaling via NF-κB, IFNγ response, and IL6 JAK STAT3 signaling as the top cytokine signaling pathways upregulated in miR-146a−/− cells (Figure 2F-G). These were the same cytokine signaling pathways upregulated in miR-146a-low AML (Figure 1H; supplemental Figure 3D), indicating a conserved role of miR-146a in hematopoietic system function. Furthermore, the IPTG signature was upregulated in miR-146a−/− cells (supplemental Figure 4B), consistent with activation of inflammaging pathways. Thus, sterile inflammation affects the HSPC compartment in young, naïve miR-146a−/− mice, suggesting that inflammaging could be an underlying factor in the premature HSC aging phenotypes that we observed.
miR-146a expression declines in murine HSCs with normal aging
We next asked whether loss of miR-146a could be a driver of normal HSC aging. We compared miR-146a expression in ESLAM cells isolated from old (18 months), middle-aged (12 months), and young (10-14 weeks) WT mice. By middle age, ESLAMs exhibited a significant reduction in miR-146a expression, and this effect persisted in old age (Figure 2H). miR-146a was also significantly downregulated in T cells and showed a trend toward downregulation in GM and LSK cells of middle-aged (14-month-old) animals (supplemental Figure 4C), suggesting that miR-146a expression changes in the HSC compartment are propagated to some downstream lineages. Thus, miR-146a is reduced during normal HSC aging and may explain the premature HSC aging phenotype observed in miR-146a−/− mice.
The epigenome and transcriptome of blood cells are altered with age, and specific changes may be predictive of functional aging in mice and humans.50-54 To determine if loss of miR-146a causes epigenetic changes associated with HSC aging, we performed whole-genome bisulfite sequencing of LSK HSPCs from young miR-146a−/− vs WT mice and compared their profile to published aging-associated differential methylation events.54 Genes associated with differentially methylated regions in old vs young HSCs54 overlapped significantly with genes associated with differentially methylated regions in miR-146a−/− vs WT HSPCs (Figure 2I). We also performed GSEA of the top genes that were upregulated or downregulated in HSC aging54 in miR-146a−/− vs WT LSK HSPCs. Genes upregulated in HSC aging54 were significantly upregulated in miR-146a−/− vs WT LSK HSPCs (Figure 2J; supplemental Figure 5), consistent with features of HSC aging. Genes downregulated in HSC aging54 were in fact upregulated in miR-146a−/− cells (Figure 2J; supplemental Figure 6), suggesting that some but not all aging-related gene expression changes are recapitulated in young miR-146a−/− HSPCs. Finally, we observed that oxidative phosphorylation was among the most downregulated pathways in miR-146a−/− vs WT LSK HSPCs (supplemental Figure 7A), suggesting disruption of mitochondrial function. Superoxide anion levels increased, and mitochondrial membrane potential tended to decrease in miR-146a−/− vs WT BM (supplemental Figure 7B-C), consistent with disruption of mitochondrial oxidative phosphorylation, as seen with aging.55 Together, these findings are consistent with the notion that loss of miR-146a contributes to aspects of HSC aging.
A subpopulation of miR-146a−/− HSCs display altered quiescence and myeloid differentiation
Expansion of the immunophenotypic HSC pool coupled with reduction of serially transplantable HSCs in miR-146a−/− mice suggested expansion of a dysfunctional HSC subpopulation. Because loss of HSC function with age occurs in part because of the exit from cell cycle quiescence and replication stress,46,56 we used a single-cell assay of HSC quiescence34,47 to characterize the dysfunctional miR-146a−/− HSC subpopulation (Figure 3A). Timed measurements of the first division of single ESLAM cells revealed that miR-146a−/− ESLAMs entered the first cell division earlier than WT, and at 24 hours after plating, there was a greater than threefold increase in the fraction of divided miR-146a−/− compared with WT ESLAM cells (Figure 3B-C), indicative of reduced quiescence. This was confirmed by Ki-67/4′,6-diamidino-2-phenylindole staining of freshly isolated ESLAMs (supplemental Figure 8A-B). There was no difference in cell-doubling time after the first premature cell division (Figure 3B; supplemental Figure 8C), suggesting that loss of miR-146a does not affect subsequent cell cycles of the differentiated progeny. To assess proliferation, we cultured cells derived from single ESLAM cells for 10 days and then measured cell output (Figure 3A). miR-146a loss caused a slight but significant increase in clone size compared with WT (Figure 3D), amounting to ∼1.2 additional divisions per clone (supplemental Figure 8D), consistent with the loss of quiescence observed in cell division kinetics experiments.
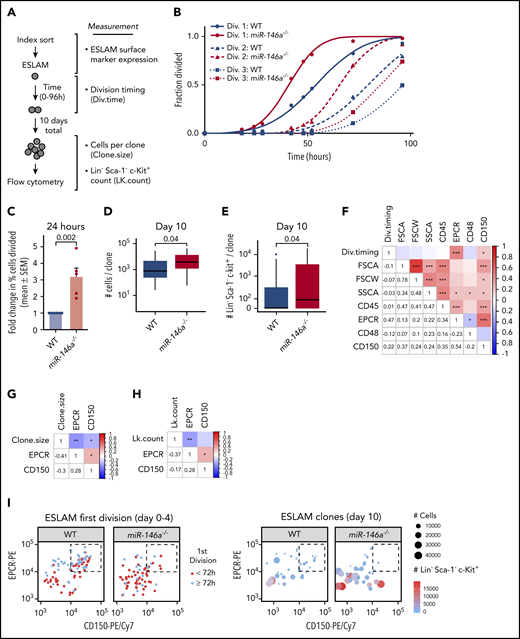
Loss of miR-146a alters quiescence, myeloid differentiation, and primitiveness of HSCs. (A) Strategy for determining quiescence, proliferation, and differentiation of single ESLAMs. (B) Single-ESLAM proliferation kinetics of WT vs miR-146a−/− (n = 97; 101 cells). (C) Percentage of single ESLAMs divided at 24 hours in culture, expressed as mean (±SEM) fold change relative to WT (n = 6; 5 replicates; P by Student t test). (D) Number of live cells produced from single ESLAMs after 10 days in culture (n = 34; 32 ESLAMs; P by Student t test). (E) Number of myeloid progenitor-like LK cells produced per single ESLAM clone shown in panel D (P by Student t test). (F-H) Pearson correlation coefficients and P-values (*P < .05; **P < .01, ***P < .001) for index sorting parameters vs (F) first cell division timing (Div.timing), determined in panel B; (G) clone size, determined in panel D; and (H) LK cell count (LK.count) per ESLAM clone, determined in panel E. (I) Relationship of EPCRhi/CD150hi ESLAM subpopulation (dashed boxes) to cell division timing (left), clone size, and LK cell count per clone (right), determined in panels B-E.
Loss of miR-146a alters quiescence, myeloid differentiation, and primitiveness of HSCs. (A) Strategy for determining quiescence, proliferation, and differentiation of single ESLAMs. (B) Single-ESLAM proliferation kinetics of WT vs miR-146a−/− (n = 97; 101 cells). (C) Percentage of single ESLAMs divided at 24 hours in culture, expressed as mean (±SEM) fold change relative to WT (n = 6; 5 replicates; P by Student t test). (D) Number of live cells produced from single ESLAMs after 10 days in culture (n = 34; 32 ESLAMs; P by Student t test). (E) Number of myeloid progenitor-like LK cells produced per single ESLAM clone shown in panel D (P by Student t test). (F-H) Pearson correlation coefficients and P-values (*P < .05; **P < .01, ***P < .001) for index sorting parameters vs (F) first cell division timing (Div.timing), determined in panel B; (G) clone size, determined in panel D; and (H) LK cell count (LK.count) per ESLAM clone, determined in panel E. (I) Relationship of EPCRhi/CD150hi ESLAM subpopulation (dashed boxes) to cell division timing (left), clone size, and LK cell count per clone (right), determined in panels B-E.
To assess myeloid differentiation of single ESLAMs, we examined differentiation toward a myeloid progenitor phenotype (LK) after 10 days in culture. We found that the LK myeloid progenitor population was significantly expanded in miR-146a−/− vs WT ESLAM clones, suggesting increased myeloid differentiation (Figure 3E). The LK population encompasses the leukemic stem cell population in several mouse models of acute leukemia.57,58 Together, these results suggest that loss of miR-146a impairs HSC quiescence and promotes myeloid progenitor expansion.
A primitive HSC subpopulation is depleted in miR-146a−/− mice
We next asked whether ESLAM cell characteristics could predict loss of quiescence and myeloid progenitor differentiation in individual HSC clones. We examined correlation of these phenotypes with parameters collected at the time of the index flow sorting of single ESLAM cells (Figure 3A). A longer time to first cell division correlated positively with higher expression of the ESLAM markers EPCR and CD150 (Figure 3F), whereas larger clone size and increased LK count correlated negatively with these parameters (Figure 3G-H). WT ESLAMs exhibited a subpopulation of EPCRhi/CD150hi cells that were enriched in late-dividing cells producing small, less differentiated clones (Figure 3I). However, this subpopulation was depleted in miR-146a−/− ESLAMs (Figure 3I), suggesting loss of a highly quiescent, undifferentiated subpopulation. Cell cycle analysis by Ki-67/4′,6-diamidino-2-phenylindole staining showed that most of the EPCRhi/CD150hi ESLAMs were in the G0 phase (supplemental Figure 8E-F), confirming the quiescence of this subpopulation (Figure 3F). The cell cycle quiescence of miR-146a−/− ESLAMs was equivalent to WT within the EPCRhi/CD150hi subpopulation and was reduced only within the non-EPCRhi/CD150hi ESLAM subpopulation (supplemental Figure 8F-G). As EPCRhi/CD150hi ESLAMs were depleted in the miR-146a−/− mice (Figure 3I), these results confirmed that loss of miR-146a draws ESLAMs into a cell cycle–activated pool, thus depleting the EPCRhi/CD150hi ESLAM subpopulation and expanding the non-EPCRhi/CD150hi subpopulation. High expression of EPCR and CD150 has been associated with enhanced HSC stemness in in vivo and ex vivo assays of HSC function.48,59 Thus, our findings support a model in which loss of miR-146a depletes a subpopulation of the most quiescent and primitive immunophenotypic HSCs.
Single-cell DNA methylation supports loss of primitive HSCs in miR-146a−/− mice
The DNA methylation profile of a cell reflects its differentiation state,60 and recent advances in single-cell DNA methylation analysis have identified epigenetically distinct subpopulations within immunophenotypic HSCs.33 We used a single-cell, whole-genome bisulfite sequencing method that we developed to probe the cell states of miR-146a−/− ESLAMs, WT ESLAMs, and WT LSK cells.33 The number of CpGs covered was similar across all 3 groups of single cells (supplemental Figure 9A), and there was excellent concordance between cis CpGs between all 3 cell types (supplemental Figure 9B). Unsupervised clustering of CpGs associated with genes implicated in HSC function61 identified a more primitive cluster enriched in ESLAM cells (cluster 1) and a more committed cluster containing a mixture of ESLAM and LSK cells (cluster 2; Figure 4A-B; supplemental Table 5). miR-146a−/− ESLAMs were underrepresented in primitive cluster 1 compared with WT ESLAMs (Figure 4A), consistent with depletion of a primitive ESLAM subpopulation.
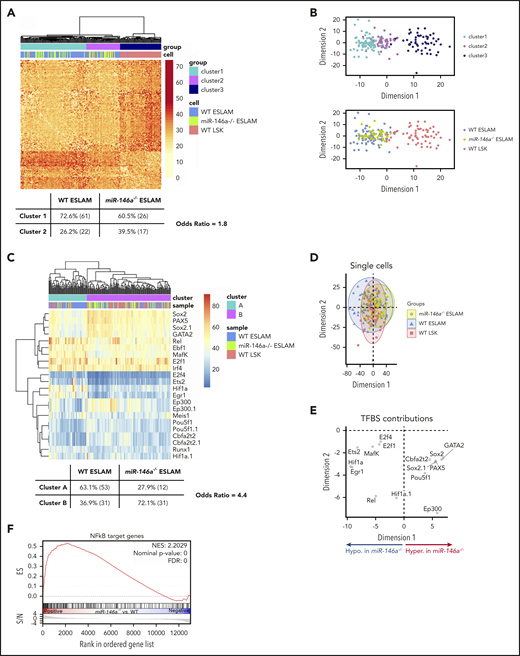
Loss of miR-146a alters epigenetic state consistent with altered HSC proliferation, differentiation, primitiveness, and function. (A) Distance matrix of pairwise cell similarity within HSC regulatory genes between single-cell DNA methylation profiles of miR-146a−/− ESLAMs, WT ESLAMs, and WT LSKs (n = 43, 84, 64 cells, respectively). Unsupervised clustering relationships and Fisher’s exact test odds ratio are shown. (B) Multidimensional scaling of distance matrix in panel A, showing relationships between cluster (top) and cell type (bottom). (C) Heat map of percentage methylation of DM-TFBSs in single cells from panel A. TFBS names with the suffix .1 indicate that 2 TFBS ChIP-seq profiles for the same TF, collected in different cell types, were identified. Unsupervised clustering relationships and Fisher’s exact test odds ratio are shown. (D) Principal component analysis (PCA) of single-cell DM-TFBS methylation profiles in panel C. (E) TFBS contributions to PCA in panel D. Based on cell type contributions to dimension 1 shown in panel D, TFBSs hypermethylated in miR-146a−/− ESLAMs appear on the right, and the hypomethylated ones appear on the left. (F) GSEA plot showing enrichment of NF-κB target genes in miR-146a−/− vs WT LSK HSPCs. ChIP-seq, chromatin immunoprecipitation sequencing; FDR, false discovery rate; NES, normalized enrichment score.
Loss of miR-146a alters epigenetic state consistent with altered HSC proliferation, differentiation, primitiveness, and function. (A) Distance matrix of pairwise cell similarity within HSC regulatory genes between single-cell DNA methylation profiles of miR-146a−/− ESLAMs, WT ESLAMs, and WT LSKs (n = 43, 84, 64 cells, respectively). Unsupervised clustering relationships and Fisher’s exact test odds ratio are shown. (B) Multidimensional scaling of distance matrix in panel A, showing relationships between cluster (top) and cell type (bottom). (C) Heat map of percentage methylation of DM-TFBSs in single cells from panel A. TFBS names with the suffix .1 indicate that 2 TFBS ChIP-seq profiles for the same TF, collected in different cell types, were identified. Unsupervised clustering relationships and Fisher’s exact test odds ratio are shown. (D) Principal component analysis (PCA) of single-cell DM-TFBS methylation profiles in panel C. (E) TFBS contributions to PCA in panel D. Based on cell type contributions to dimension 1 shown in panel D, TFBSs hypermethylated in miR-146a−/− ESLAMs appear on the right, and the hypomethylated ones appear on the left. (F) GSEA plot showing enrichment of NF-κB target genes in miR-146a−/− vs WT LSK HSPCs. ChIP-seq, chromatin immunoprecipitation sequencing; FDR, false discovery rate; NES, normalized enrichment score.
To explore mechanisms underlying these epigenetic differences, we identified differentially methylated transcription factor binding sites (DM-TFBSs) in miR-146a−/− ESLAMs compared with WT ESLAMs or WT LSKs (supplemental Figure 10). Unsupervised clustering of DM-TFBS methylation in single cells identified a more primitive cluster enriched in WT ESLAMs (cluster A) and a more committed cluster enriched in WT LSKs (cluster B; Figure 4C; supplemental Table 6). miR-146a−/− ESLAMs were again underrepresented in the primitive cluster A compared with WT ESLAMs (Figure 4C). With some exceptions, TFBS hypermethylation accompanies transcriptional repression, and hypomethylation accompanies transcriptional activation.62 The TFBS DNA methylation changes in miR-146a−/− ESLAMs (Figure 4D-E; supplemental Figure 10E-F) were consistent with increased HSC proliferation (hypomethylation of E2F1 sites); decreased HSC development, maintenance, transplantation ability, and self-renewal (hypomethylation of ETS2 sites, and hypermethylation of GATA2, POU5F1/OCT4, and SOX2 sites); reduced HSC-specific enhancer activity (hypermethylation of EP300 sites); and altered HSC differentiation (hypermethylation of PAX5 sites).63-70
In addition, binding site hypomethylation of Rel, an NF-κB subunit (Figure 4D-E; supplemental Figure 8F), suggests hyperactivation of NF-κB in miR-146a−/− ESLAMs. Previous studies have shown that miR-146a loss promotes NF-κB hyperactivation upon lipopolysaccharide stimulation or myeloablative drug treatment, and deletion of the NF-κB Nfkb1 subunit attenuates development of myeloid malignancy in miR-146a−/− mice.39,42,43 GSEA analysis of NF-κB target genes in miR-146a−/− vs WT LSK HSPC RNA-seq showed significant upregulation of NF-κB targets in miR-146a−/− cells (Figure 4F), suggesting that NF-κB hyperactivation contributes to the aging and inflammation phenotypes of young, naïve miR-146a−/− HSCs.
Cell-extrinsic signals drive altered HSC function in miR-146a−/− mice
To confirm that the complement of aging phenotypes observed in miR-146a−/− HSCs are mediated by inflammation, we conducted network analysis of differentially expressed GO terms in miR-146a−/− vs WT LSK HSPC RNA-seq (supplemental Figure 11A). Focusing on the largest network containing GO terms related to proliferation and differentiation upregulated in miR-146a−/− HSPCs, we found substantial overlap with upregulated GO terms related to immune response and cytokine production (Figure 5A). This included 2 of the primary cytokines associated with inflammaging, TNF and IL6 (supplemental Figure 11B), suggesting that cytokine signaling drives gene expression changes that lead to the aging phenotypes observed in miR-146a−/− HSCs.
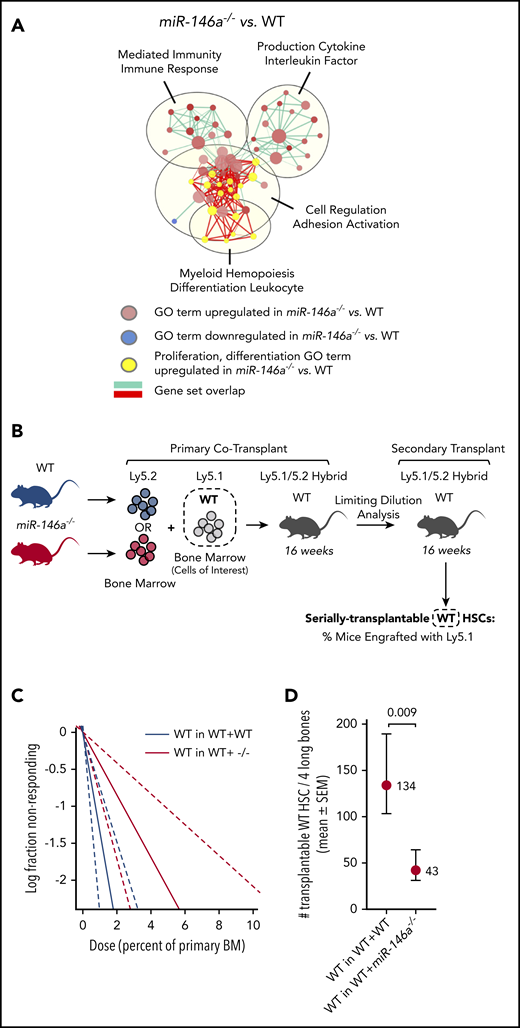
Cell-extrinsic signals drive altered HSC function in miR-146a−/−mice. (A) A gene expression network upregulated in miR-146a−/− vs WT HSPCs shows overlap between GO terms involved in cell proliferation and differentiation (yellow) and those involved in immunity and cytokine production. EnrichmentMap cutoffs: FDR <0.075; P < .005; and overlap >.75. AutoAnnotate network labels: community cluster analysis of GO term names. (B) Cotransplantation experiment assessing the cell nonautonomous effect of miR-146a−/− BM on HSC function. WTLy5.1 BM was cotransplanted with WT or miR-146a−/−Ly5.2 BM in Ly5.1/5.2 hybrid recipients, followed by 2° LDA transplants. Dashed box represents the WT cells of interest assessed in panels C-D. (C) Extreme limiting dilution analysis (ELDA) plot for secondary transplants with WTLy5.1 that had been cotransplanted with WTLy5.2 (WT in WT+WT) vs miR-146a−/−Ly5.2 (WT in WT+ −/−) BM (n = 36 mice per genotype, with 7 dilutions). (D) Number of serially transplantable WTLy5.1 HSCs estimated from ELDA analysis shown in panel C. P by ELDA.
Cell-extrinsic signals drive altered HSC function in miR-146a−/−mice. (A) A gene expression network upregulated in miR-146a−/− vs WT HSPCs shows overlap between GO terms involved in cell proliferation and differentiation (yellow) and those involved in immunity and cytokine production. EnrichmentMap cutoffs: FDR <0.075; P < .005; and overlap >.75. AutoAnnotate network labels: community cluster analysis of GO term names. (B) Cotransplantation experiment assessing the cell nonautonomous effect of miR-146a−/− BM on HSC function. WTLy5.1 BM was cotransplanted with WT or miR-146a−/−Ly5.2 BM in Ly5.1/5.2 hybrid recipients, followed by 2° LDA transplants. Dashed box represents the WT cells of interest assessed in panels C-D. (C) Extreme limiting dilution analysis (ELDA) plot for secondary transplants with WTLy5.1 that had been cotransplanted with WTLy5.2 (WT in WT+WT) vs miR-146a−/−Ly5.2 (WT in WT+ −/−) BM (n = 36 mice per genotype, with 7 dilutions). (D) Number of serially transplantable WTLy5.1 HSCs estimated from ELDA analysis shown in panel C. P by ELDA.
To determine if HSC aging in miR-146a−/− mice is mediated by cell-extrinsic signals, we assessed whether cotransplantation with miR-146a−/− BM could influence the serial transplantation activity of WT HSCs in 2° LDA transplants (Figure 5B). WT HSCs cotransplanted with miR-146a−/− BM showed significant impairment of serial transplantation activity compared with WT HSCs cotransplanted with WT BM (Figure 5C-D; supplemental Figure 11C-D). Therefore, cell-extrinsic signals from miR-146a−/− BM were sufficient to impair HSC function, in line with a cytokine-mediated mechanism.
NF-κB signaling activates an inflammatory relay in miR-146a−/− mature cell types
To further evaluate mechanisms by which loss of miR-146a promotes inflammaging, we compared genes upregulated in miR-146a−/− vs WT LSK HSPC RNA-seq to predicted miR-146a targets in miRNAtap.38 We found that 121 (23.2%) predicted miR-146a targets were upregulated >1.2-fold (Figure 6A). IPA36 of these targets identified a substantial proportion (23.4%) of immune-related pathways, including NF-κB signaling, among the significantly upregulated pathways (Figure 6B). We generated mice lacking both miR-146a and Il6, Tnf, or Nfkb1 and measured IL6 and TNF protein levels in BM. Both cytokines were upregulated in miR-146a−/− vs WT, as expected, and were rescued by the respective double knockout (Figure 6C-D). Nfkb1−/−miR-146a−/− double knockouts restored IL6 to near WT levels, suggesting that NF-κB hyperactivation drives IL6 upregulation in miR-146a−/− mice. Furthermore, Il6−/−miR-146a−/− double knockouts restored TNF to WT levels, but Tnf−/−miR-146a−/− did not suppress IL6 expression, suggesting that TNF upregulation is dependent on IL6 (Figure 6C-D). Thus, our findings suggest an inflammatory signaling relay in miR-146a−/− bone marrow: activation of NF-κB, an effector of the miR-146a target TRAF6,41 drives IL6 signaling, which in turn drives TNF signaling.
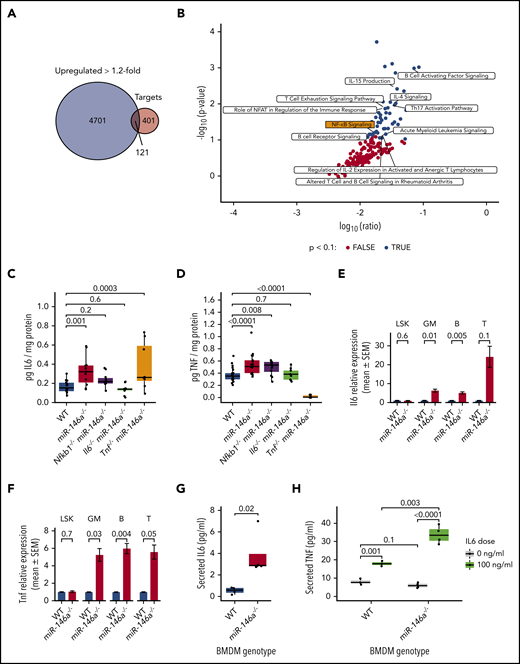
Loss of miR-146a activates an NF-κB-IL6-TNF signaling relay in mature cells. (A) Overlap between genes upregulated >1.2-fold in miR-146a−/− vs WT LSK HSPCs and predicted miR-146a target genes.38 (B) IPA of the 121 overlapping genes from panel A. Black points represent significantly enriched pathways (P < .1), and hematopoietic and immune-related pathways are labeled. (C-D) ELISA assay of IL6 or TNF in BM of WT, miR-146a−/−, Nfkb1−/−miR-146a−/−, Il6−/−miR-146a−/−, and Tnf−/−miR-146a−/− mice (from IL6 ELISA: n = 15 WT, 13 miR-146a−/−, 11 Nfkb1−/−miR-146a−/−, 10 Il6−/−miR-146a−/−, and 8 Tnf−/−miR-146a−/− mice; in TNF ELISA: n = 22 WT, 17 miR-146a−/−, 12 Nfkb1−/−miR-146a−/−, 9 Il6−/−miR-146a−/−, and 10 Tnf−/−miR-146a−/− mice) P by Student t test, with Benjamini-Hochberg correction. (E-F) Quantitative reverse transcription-polymerase chain reaction analysis of Il6 or Tnf in LSK HSPCs, GM (CD11b+ and/or Gr-1+), B (CD19+), and T (CD3+) lineage cells (n = 8 WT; 9 miR-146a−/− mice; P by t test). (G) ELISA assay of secreted IL6 in WT and miR-146a−/− BMDM cultures (n = 4 replicates). P by linear regression. (H) ELISA assay of secreted TNF in WT and miR-146a−/− BMDMs treated with IL6 or control (n = 4 replicates; P by linear regression).
Loss of miR-146a activates an NF-κB-IL6-TNF signaling relay in mature cells. (A) Overlap between genes upregulated >1.2-fold in miR-146a−/− vs WT LSK HSPCs and predicted miR-146a target genes.38 (B) IPA of the 121 overlapping genes from panel A. Black points represent significantly enriched pathways (P < .1), and hematopoietic and immune-related pathways are labeled. (C-D) ELISA assay of IL6 or TNF in BM of WT, miR-146a−/−, Nfkb1−/−miR-146a−/−, Il6−/−miR-146a−/−, and Tnf−/−miR-146a−/− mice (from IL6 ELISA: n = 15 WT, 13 miR-146a−/−, 11 Nfkb1−/−miR-146a−/−, 10 Il6−/−miR-146a−/−, and 8 Tnf−/−miR-146a−/− mice; in TNF ELISA: n = 22 WT, 17 miR-146a−/−, 12 Nfkb1−/−miR-146a−/−, 9 Il6−/−miR-146a−/−, and 10 Tnf−/−miR-146a−/− mice) P by Student t test, with Benjamini-Hochberg correction. (E-F) Quantitative reverse transcription-polymerase chain reaction analysis of Il6 or Tnf in LSK HSPCs, GM (CD11b+ and/or Gr-1+), B (CD19+), and T (CD3+) lineage cells (n = 8 WT; 9 miR-146a−/− mice; P by t test). (G) ELISA assay of secreted IL6 in WT and miR-146a−/− BMDM cultures (n = 4 replicates). P by linear regression. (H) ELISA assay of secreted TNF in WT and miR-146a−/− BMDMs treated with IL6 or control (n = 4 replicates; P by linear regression).
Both HSPCs and mature immune cells are capable of cytokine production upon activation of NF-κB signaling.71 To investigate the cellular source of IL6 and TNF in young, naïve miR-146a−/− mice, we sorted LSK HSPCs and mature GM-, B-, or T-lineage cells and analyzed Il6 and Tnf expression by quantitative reverse transcription-polymerase chain reaction. Il6 and Tnf expression was significantly upregulated in GM- and B-lineage cells and showed a trend toward upregulation in T-lineage cells (Figure 6E-F), suggesting that mature myeloid and lymphoid cells are the primary source of IL6 and TNF in miR-146a−/− BM. We next explored regulation of IL6 and TNF cytokine production in cultured BM-derived macrophages (BMDMs). miR-146a−/− BMDMs secreted significantly higher levels of IL6 than did WT cells (Figure 6G). There was no significant difference in TNF secretion from miR-146a−/− vs WT BMDMs; however, upon IL6 stimulation, miR-146a−/− BMDMs secreted significantly higher levels of TNF than did WT cells (Figure 6H). These results were consistent with our in vivo findings (Figure 6C-D). That is, although the levels of IL6 secreted by miR-146a−/− cultured BMDMs were not sufficient to activate TNF, the addition of exogenous IL6 strongly activated TNF secretion by miR-146a−/− BMDMs. Together, these findings support that IL6 signaling drives TNF expression, and demonstrate that mature cells are the primary source of IL6 and TNF in miR-146a−/− BM.
Blockade of Il6 or Tnf restores miR-146a−/− HSC function and reduces myeloid malignancy
We next investigated the effect of inflammaging-related proinflammatory cytokines on HSC function in mice lacking miR-146a and Il6, Tnf, or Nfkb1. Whereas miR-146a−/− single-knockout mice lacked a primitive and quiescent subpopulation of EPCRhi/CD150hi ESLAMs (Figure 3B-I), all 3 double-knockout strains significantly restored this subpopulation of immunophenotypic HSCs and restored the ESLAM cell cycle quiescence, compared with miR-146a−/− mice (Figure 7A-C). We next assessed the overall effect of miR-146a loss, with or without concomitant deletion of Il6 or Tnf, on the development of myeloid malignancy. As reported,40,42 we found that the survival of miR-146a−/− mice was significantly reduced compared with WT mice, because of the development of a hematological malignancy (Figure 7D). Loss of Il6 or Tnf significantly improved survival of miR-146a−/− mice, with loss of Il6 exerting the stronger effect (Figure 7D). A small number of Il6−/− miR-146a−/− and Tnf−/− miR-146a−/− mice still succumbed to disease, suggesting that Il6 and Tnf are not the sole drivers of disease, but contribute to an inflammatory milieu that enhances the development or aggressiveness of disease. Together these findings demonstrate that loss of miR-146a promotes NF-κB–related IL6- and TNF-mediated inflammaging and thus contributes to the development of myeloid malignancy.
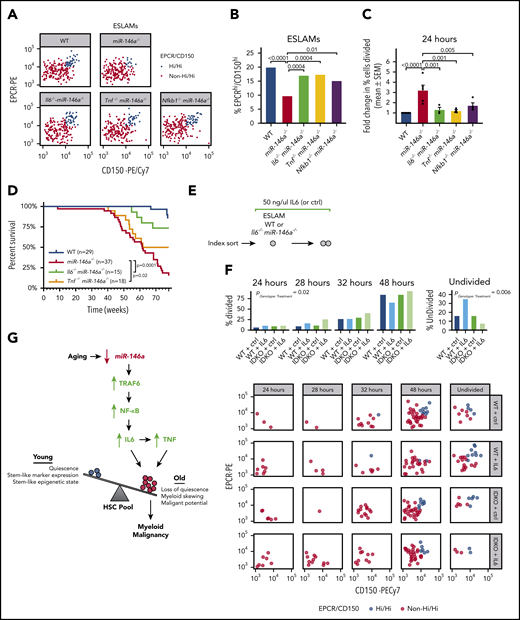
Il6- and Tnf-mediated inflammation drive HSC dysfunction and hematological malignancy in miR-146a−/−mice. (A) EPCRhi/CD150hi ESLAM subpopulation in WT, miR-146a−/−, Il6−/−miR-146a−/−, Tnf−/−miR-146a−/−, and Nfkb1 miR-146a−/− ESLAMs (sample of 200 cells shown per genotype). (B) Percentage of EPCRhi/CD150hi ESLAMs calculated from panel A (n = 660, 716, 394, 360, and 285 cells, respectively). P by binomial logistic regression. (C) Percentage of single ESLAMs divided at 24 hours in culture, expressed as mean (±SEM) fold change relative to WT (n = 6, 5, 3, 3, 4 replicates). Data for WT and miR-146a−/− are adapted from Figure 3C. P by linear regression analysis. (D) Survival curve of WT, miR-146a−/−, Il6−/−miR-146a−/−, and Tnf−/−miR-146a−/− mice to 1.5 years. Sample sizes (n) and log-rank test Ps shown. (E) Strategy for investigating the sensitivity of WT and miR-146a−/− ESLAMs to IL6 stimulation. (F) Cell division timing and index data of WT and Il6−/−miR-146a−/− (IDKO) ESLAMs treated with 50 ng/mL IL6 or control (n = 69, 69, 68, and 70 cells). P by ordinal logistic regression, for interaction between genotype and cytokine treatment. (G) Model showing how aging promotes loss of miR-146a expression in HSCs. Loss of miR-146a promotes activation of NF-κB, an effector of the miR-146a target TRAF6,41 driving IL6 signaling, which in turn drives TNF signaling. IL6 and TNF promote expansion of an HSC subpopulation with inflammaging phenotypes. Reducing inflammation mediated by IL6 or TNF restores HSC subpopulation composition and reduces the malignant potential of miR-146a−/− HSCs, demonstrating that loss of miR-146a is a genetic mechanism linking HSC inflammaging and myeloid malignancy. SEM, standard error of the mean.
Il6- and Tnf-mediated inflammation drive HSC dysfunction and hematological malignancy in miR-146a−/−mice. (A) EPCRhi/CD150hi ESLAM subpopulation in WT, miR-146a−/−, Il6−/−miR-146a−/−, Tnf−/−miR-146a−/−, and Nfkb1 miR-146a−/− ESLAMs (sample of 200 cells shown per genotype). (B) Percentage of EPCRhi/CD150hi ESLAMs calculated from panel A (n = 660, 716, 394, 360, and 285 cells, respectively). P by binomial logistic regression. (C) Percentage of single ESLAMs divided at 24 hours in culture, expressed as mean (±SEM) fold change relative to WT (n = 6, 5, 3, 3, 4 replicates). Data for WT and miR-146a−/− are adapted from Figure 3C. P by linear regression analysis. (D) Survival curve of WT, miR-146a−/−, Il6−/−miR-146a−/−, and Tnf−/−miR-146a−/− mice to 1.5 years. Sample sizes (n) and log-rank test Ps shown. (E) Strategy for investigating the sensitivity of WT and miR-146a−/− ESLAMs to IL6 stimulation. (F) Cell division timing and index data of WT and Il6−/−miR-146a−/− (IDKO) ESLAMs treated with 50 ng/mL IL6 or control (n = 69, 69, 68, and 70 cells). P by ordinal logistic regression, for interaction between genotype and cytokine treatment. (G) Model showing how aging promotes loss of miR-146a expression in HSCs. Loss of miR-146a promotes activation of NF-κB, an effector of the miR-146a target TRAF6,41 driving IL6 signaling, which in turn drives TNF signaling. IL6 and TNF promote expansion of an HSC subpopulation with inflammaging phenotypes. Reducing inflammation mediated by IL6 or TNF restores HSC subpopulation composition and reduces the malignant potential of miR-146a−/− HSCs, demonstrating that loss of miR-146a is a genetic mechanism linking HSC inflammaging and myeloid malignancy. SEM, standard error of the mean.
miR-146a−/− HSCs are more sensitive to IL6-mediated disruption of quiescence
Because we found that the cell-extrinsic factors IL6 and TNF disrupt HSC function in miR-146a−/− mice, we next investigated whether miR-146a−/− HSCs are intrinsically more sensitive to these signals than are WT HSCs. We focused on IL6, because targeting Il6 produced the strongest effects on survival and inflammation (Figures 6C-D and 7D). We performed single-cell assays of HSC quiescence on WT and Il6−/− miR-146a−/− (IL6-naïve) ESLAMs stimulated ex vivo with 50 ng/mL IL6 vs control (Figure 7E). IL6 stimulation promoted more cell division in ESLAMs lacking miR-146a than in WT cells (Figure 7F), indicating that miR-146a−/− HSCs are more sensitive to IL6-mediated disruption of quiescence. Early cell divisions (24-32–hour time points) occurred in the non-EPCRhi/CD150hi ESLAMs, whereas later cell divisions (48 hours or more) included EPCRhi/CD150hi ESLAMs (Figure 7F), indicating that exogenous IL6 stimulation affects ESLAM subpopulation quiescence similar to what we had observed endogenously in miR-146a−/− mice. Overall, our findings demonstrate that loss of miR-146a promotes HSC aging via cell-extrinsic inflammatory signals and via increased cell-intrinsic sensitivity to inflammation.
Discussion
The association of inflammation with myeloid malignancy has long been appreciated.21-26 However, it is unknown whether HSC inflammaging precedes the development of myeloid malignancy and whether blocking inflammaging could reduce or prevent development of malignancy. In this study, we investigated our top candidate miRNA regulator of inflammaging in AML, miR-146a. We demonstrated that loss of miR-146a promotes HSC inflammaging mediated by IL6 and TNF in young adult mice, preceding the development of myeloid malignancy in later adulthood. As miR-146a expression was downregulated in aged HSCs, our results suggest a model in which loss of miR-146a drives normal aging of HSCs by promoting inflammaging. Using single-cell profiling of HSC function and DNA methylation state, we demonstrated that loss of miR-146a leads to depletion of a quiescent, primitive HSC subpopulation and expands a subpopulation of less quiescent, myeloid-biased HSCs, further indicative of HSC aging. As reducing inflammation by targeting Il6 or Tnf, or their upstream regulator Nfkb1, restored single-cell measures of HSC function and subpopulation structure, and reduced the development or aggressiveness of hematological malignancy in miR-146a−/− mice, our results demonstrate that HSC inflammaging contributes to the development of malignancy upon loss of miR-146a. In addition, we demonstrated that miR-146a−/− HSCs are intrinsically more sensitive to IL6-mediated disruption of quiescence, suggesting that miR-146a plays a role in regulating both the cell-intrinsic response and cell-extrinsic signals contributing to HSC inflammaging. Thus, we have established that loss of miR-146a contributes to the development of myeloid malignancy through cell autonomous and nonautonomous effects on HSCs that drive inflammaging (Figure 7G).
Previous studies have established that loss of miR-146a promotes development of myeloproliferative disease in mice during aging or chronic stimulation of the innate immune system,39,40,43,45,72 and that this pathology is accompanied by depletion of immunophenotypic HSCs/HSPCs.43 However, the impact of miR-146a loss on HSC function before the onset of overt disease was not understood. In contrast to prior analyses that identified depletion of immunophenotypic HSPCs/HSCs in aged or immune-stimulated miR-146a−/− mice,43 our study of young, naïve miR-146a−/− mice identified expansion of the immunophenotypic HSC compartment, depletion of serially transplantable HSCs, and HSC myeloid bias, indicative of premature HSC aging. Furthermore, prior analyses examining miR-146a−/− HSC abundance during aging or chronic immune stimulation43 did not account for HSC heterogeneity, which profoundly influences HSC function.48 Through the use of single-cell assays of HSC function and epigenetic state, our study revealed that disruption of HSC function and subpopulation structure are early events that occur in young, naïve miR-146a−/− mice, suggesting early establishment of a cell state that is a precursor to myeloid malignancy. We found that increased IL6- and TNF-mediated inflammation and increased intrinsic sensitivity to these extrinsic signals, underlies this early cell state. Subsequently, IL6- and TNF-mediated inflammation contributes to development or aggressiveness of later hematological malignancy in miR-146a−/− mice. Identification of an early role for IL6- and TNF-mediated inflammation in premalignant miR-146a−/− HSC dysfunction and a later role in myeloid malignancy has important potential implications for prevention of malignancy. Overall, this study provides new insight into the early mechanisms of HSC dysfunction before development of myeloid malignancy, because it demonstrates the differential effects of inflammation on subpopulations within a heterogeneous HSC pool.
We found that downregulation of miR-146a occurred in a substantial fraction of samples from AML patients. Whereas prior studies have focused on the role of miR-146a in del(5q) MDS or AML,39,44 our findings extend to a larger subgroup of patients with downregulated miR-146a expression independent of chromosome 5 deletions. miR-146a downregulation was strongly associated with induction of proinflammatory cytokine-driven transcription in AML. As this result was recapitulated in young miR-146a−/− mice, loss of miR-146a appears to be sufficient to drive inflammation before the development of overt disease. We and others have shown that loss of miR-146a promotes myeloproliferative disease but rarely promotes development of frank leukemia in mice,42 and loss of miR-146a and the associated inflammation appears to contribute to myeloid malignancy, but must cooperate with other mutations to achieve leukemic transformation. Overall, this study provides evidence that anti-inflammatory therapies may be beneficial as a preventative approach or as an adjuvant therapy for myeloid malignancies in elderly patients with low hematopoietic expression of miR-146a.
The gene expression and DNA methylation data reported in this article have been deposited in the Gene Expression Omnibus database (accession numbers GSE149097, GSE148990, GSE95697, GSE148989, GSE89545, and GSE148988).
The online version of this article contains a data supplement.
The publication costs of this article were defrayed in part by page charge payment. Therefore, and solely to indicate this fact, this article is hereby marked “advertisement” in accordance with 18 USC section 1734.
Contact the corresponding author for original data.
Acknowledgments
The authors thank Angela Mo, Patrick Coulombe, and Sarah Grasedieck for helpful discussions and technical assistance.
This work was supported by grants from the Canadian Institutes of Health Research (grants PJT-166051 and PJT-162131), the Terry Fox Research Institute (grant 1074), and the Leukemia and Lymphoma Society of Canada (619121) (A.K.); a Leukemia and Lymphoma Society Career Development Program award (J.M.G.); and the John Auston BC Cancer Foundation Clinician-Scientist Award (A.K.).
Authorship
Contribution: A.K. conceived the project; J.M.G., J.W., and A.K. designed the experiments; J.M.G., J.W., T.H., D.J.H.F.K., Y.D., A.G., and M.F. planned and performed experiments; J.M.G., J.W., T.H., K.O., M.S., J.P., T.R.D., M.F., J.L., and A.K. analyzed data and interpreted the results; J.M.G. and A.K. wrote the manuscript; and M.B., C.J.E., and M.H. provided technical expertise and intellectual contributions.
Conflicts-of-interest disclosure: The authors declare no competing financial interests.
Correspondence: Aly Karsan, BC Cancer, 675 W Tenth Ave, Vancouver, BC V5Z 1G1, Canada; e-mail: akarsan@bcgsc.ca.

This feature is available to Subscribers Only
Sign In or Create an Account Close Modal