

Key Points
Constitutive NF-κB and Notch signaling drives splenic marginal zone lymphoma–like B-cell lymphoma in mice.
Dedifferentiation and epigenetic changes in B-cell lymphoma precursors underlie a switch to myeloid leukemia.

Abstract
NF-κB and Notch signaling can be simultaneously activated in a variety of B-cell lymphomas. Patients with B-cell lymphoma occasionally develop clonally related myeloid tumors with poor prognosis. Whether concurrent activation of both pathways is sufficient to induce B-cell transformation and whether the signaling initiates B-myeloid conversion in a pathological context are largely unknown. Here, we provide genetic evidence that concurrent activation of NF-κB and Notch signaling in committed B cells is sufficient to induce B-cell lymphomatous transformation and primes common progenitor cells to convert to myeloid lineage through dedifferentiation, not transdifferentiation. Intriguingly, the converted myeloid cells can further transform, albeit at low frequency, into myeloid leukemia. Mechanistically, coactivation of NF-κB and Notch signaling endows committed B cells with the ability to self renew. Downregulation of BACH2, a lymphoma and myeloid gene suppressor, but not upregulation of CEBPα and/or downregulation of B-cell transcription factors, is an early event in both B-cell transformation and myeloid conversion. Interestingly, a DNA hypomethylating drug not only effectively eliminated the converted myeloid leukemia cells, but also restored the expression of green fluorescent protein, which had been lost in converted myeloid leukemia cells. Collectively, our results suggest that targeting NF-κB and Notch signaling will not only improve lymphoma treatment, but also prevent the lymphoma-to-myeloid tumor conversion. Importantly, DNA hypomethylating drugs might efficiently treat these converted myeloid neoplasms.
Introduction
Coactivation of NF-κB and Notch signaling has been demonstrated in a variety of B-cell lymphomas, including chronic lymphocytic leukemia, splenic marginal zone lymphoma (SMZL) and diffuse large B-cell lymphoma.1-9 NF-κB comprises a family of transcription factors, including RelA, RelB, c-Rel, p105/p50, and p100/p52.10,11 Notch receptor genes encode a family of heterodimeric transmembrane proteins (Notch1-4) that function as ligand-activated transcription factors to regulate cell fate, proliferation, and differentiation.12,13 Constitutive NF-κB and Notch signaling in lymphomas is due to activating somatic mutations or upregulation of pathway regulators.1,8,14-16 Although activation of Notch and NF-κB signaling individually in lymphoma has been well studied, whether simultaneous activation of both is sufficient to induce lymphomatous transformation remains to be established.
Patients with B-cell lymphoma occasionally develop clonally related myeloid neoplasms, such as histiocytic sarcoma, myeloid neoplasm,17-19 or acute myeloid leukemia (AML).20 Although the switch from lymphoma to myeloid neoplasm is well recognized, the underlying molecular mechanisms are largely unknown as a result of the low incidence of the switch and the lack of good in vivo models to study it. Experimentally, forced expression of myeloid transcription factor CCAAT/enhancer-binding protein α (CEBPα), alone or in combination with deletion of B-cell transcription factor PAX5, or expression of Yamanaka factors (Oct3/4, Sox2, Klf4, Myc) in mature B cells induces B-myeloid reprogramming.21-30 However, the significance of these findings in an intact model organism, such as the laboratory mouse, is largely unknown. Because most patients in whom B-cell lymphoma undergoes conversion to myeloid tumor have a poor prognosis as a result of diagnostic difficulties and lack of standard threatment,31,32 it is important to elucidate the biological underpinning of the B-to-myeloid switch and develop new approaches to treat and prevent these uncommon but usually fatal neoplasms.
Previous studies have shown that neither activation of NF-κB (by stabilization of NF-κB–inducing kinase [NIK]) nor activation of Notch2 (by expression of the intracellular domain of Notch2 [ICN]) alone in committed B cells is sufficient to induce lymphoma in mice.33,34 Intriguingly, the expression of NF-κB noncanonical components RelB and p100/p52 is largely suppressed in Notch2-activated splenic B cells for unknown reasons, suggesting an inhibitory crosstalk between the NF-κB and Notch pathways.34 Inspired by these findings, we wondered whether enhancing NF-κB signaling in Notch-activated B cells would overcome the Notch-dependent downregulation of NF-κB signaling and thereby induce malignant B-cell transformation. Our data show that coactivation of NF-κB/Notch signaling in CD19+ B cells is sufficient to induce B-cell transformation. Unexpectedly, transplanted NF-κB/Notch–coactivated marginal zone precursor B cells (MZPs), but not marginal zone B cells (MZBs) or fully transformed lymphoma cells, converted to myeloid cells in lethally irradiated recipient mice, presumably by virtue of an MZP-to-progenitor dedifferentiation process. Intriguingly, in 3 of 20 mice, progenitors of this sort gave rise to transplantable AML harboring clonotypic VDJ rearrangements. Our data reveal the important role of coactivation of NF-κB/Notch signaling in both B-cell transformation and the priming of B-cell lineage plasticity.
Methods
Mice
ROSA26-NIKΔT3flSTOP and ROSA26-Notch2ICN mice have been described previously.33,35-37 CD19-Cre mice were purchased from the Jackson Laboratory. All strains were in a C57BL6 background and used at age ≥4 weeks, with a mix of male and female mice. Transplant recipients (C57BL/Ka CD45.1) were age 8 to 12 weeks. The experiments were conducted under approved protocol 1891002 of the Animal Component of Research Protocol and Institutional Animal Care and Use Committee of the University of Iowa.
BM and spleen cell analysis and cell sorting
All antibodies were purchased from Thermo Fisher Scientific and BD Biosciences. For analysis of hematopoietic/stem progenitor cells (HSPCs), whole bone marrow (WBM) cells were incubated with lineage markers (CD3ε, CD11b, B220, Gr-1, Ter119), as well as CD117 and Sca1. For BM B-cell analysis, WBM cells were incubated with B220, CD127, and CD117, as well as lineage markers (CD11b, Gr1, CD11c, CD3, CD4, CD8, NK1.1, Ter119). For spleen B-cell analysis and fluorescence-activated cell sorting (FACS), whole spleen cells were incubated with different combinations of B220, CD19, CD21, CD23, CD34, CD117, Sca1, CD135, IgD, IgM, CD93, CD11b, and CD138. In these analyses, the green fluorescent protein (GFP)/fluorescein isothiocyanate channel was open for monitoring transgenic cells. LSRII was used for all analyses, and FACSAria was used for cell sorting. Data were analyzed using FlowJo software (TreeStar).
In vivo B-cell or BM transplantation
For adoptive B-cell transplantation, spleen B cells, MZBs, or MZPs (3 × 10⁶ per recipient), fresh from FACS, from control or TriB mice or retrovirally transduced B cells (0.2 × 10⁶ to 0.5 × 10⁶ per recipient) along with 2 × 10⁶ to 3 × 10⁵ CD45.1 WBM rescue cells were transplanted retroorbitally into lethally irradiated (950 cGy, single dose) CD45.1 recipients. For BM transplantation, WBM cells from control, NIK, Notch, or TriB mice were transplanted retroorbitally into lethally irradiated CD45.1 recipients (3 × 10⁶ per recipient). After transplantation, peripheral blood was obtained from recipient mice at different time points to monitor donor chimerism. For secondary lymphoma or leukemia cell transplantation, 3 × 10⁶ cells per recipient were used and transplanted into sublethally (6 Gy) irradiated CD45.1 recipients, who were then observed daily for signs of morbidity.
RNA-seq and ATAC-seq analyses
The RNA sequencing (RNA-seq) and assay for transposase-accessible chromatin using sequencing (ATAC-seq) data were deposited in the Gene Expression Omnibus under accession numbers GSE116960 and GSE136408, respectively. RNA-seq was performed as previously described37 (supplemental Methods). Gene set enrichment analysis (GSEA) was performed using the software downloaded from the GSEA Web site (http://software.broadinstitute.org/gsea/index.jsp). Ingenuity pathway analysis (IPA; Qiagen) was performed using the differential gene expression results of the RNA-seq experiment comparing TriBDN (lymphoma) vs TriB MZP samples. Differential genes were defined as genes with log2-fold change >1 or <1 with an adjusted P value <.05. Canonical pathway results were isolated from the IPA and displayed by z score and P value, with the size of the marker denoting significant genes altered in the canonical pathway. Selected statistically significant canonical pathways were also isolated and displayed.
ATAC-seq was performed according to the published standard protocol.38 For analysis, the adaptors were first removed from ATAC-seq reads using Trimmomatic,39 and the paired-end reads were then mapped to the mouse reference genome (GRCm38/mm10) using Bowtie2,40 with the parameter setting of “–very-sensitive -k 10 -X 2000.” Mitochondrial DNA were filtered using SAMTools,41 and duplicated reads were removed using Picard tools MarkDuplicates (https://broadinstitute.github.io/picard/). The properly mapped paired reads with a MAPQ score >30 were retained for downstream analyses. To check the postalignment quality, we applied Bioconductor package ATACsesqQC to our data set.42 ATAC-seq peak regions were called using MACS2,43 with the parameter “-B –f BAMPE –g mm –keep-dup all –cutoff-analysis.” ENCODE blacklist regions were removed for downstream analysis (https://www.encodeproject.org/annotations/ENCSR064IDX/). To generate consensus peaks between Bswitch and TriBMZP cells, we used BEDTools merge.44 In total, we identified 79 337 peaks and quantified the fragments in each peak using featureCounts.45 We further normalized fragments (CR) using library size (SL) and the formula CN = log2(CR/SL × 1 000 000 + 1).46 Peak annotations were performed using ChIPseeker package.47 Coverage of ATAC-seq signals along the genome was generated using deepTools48 and visualized using Integrated Genomics Viewer49 for the identified peaks.
Statistical analysis
Student t test was used for all but survival curve statistical analyses, and significance was set at P < .05. Values are means ± standard error of mean. For the Kaplan-Meier survival curve, the log-rank test was used.
Results
Coactivation of NF-κB/Notch signaling in committed B cells induces a B-cell lymphoproliferative disorder with morphology indistinguishable from SMZL
Analysis of published data showed that the frequency of coactivating mutations of Notch/NF-κB signaling components in different subtypes of human B-cell lymphomas ranged from 6% to 56.2% (supplemental Figure 1A). To investigate the impact of coactivation of NF-κB/Notch signaling on B-cell development and lymphomatous transformation, we interbred ROSA26-NIKΔT3flSTOP, ROSA26-Notch2ICNflSTOP, and CD19-Cre mice to generate compound transgenic mice hereafter called TriB (supplemental Figure 1B). In addition, we named ROSA26-NIKΔT3flSTOP × CD19-Cre and ROSA26-Notch2ICNflSTOP × CD19-Cre mice as NIK and Notch mice, respectively. Because the phenotypes of these NIK and Notch mice have been reported previously,33,34 we focused on analyzing TriB mice. The lack of a TRAF3-binding domain (NIKΔT3) renders NIK protein stably expressed as a result of its resistance to proteasomal degradation.33,36,37 The expression of NIKΔT3 and Notch2ICN can be traced by GFP and yellow fluorescent protein expression, respectively. Because the expression of yellow fluorescent protein is weaker in Notch mice, to keep it simple, we used GFP to track doubly activated B cells. Flow cytometric analysis showed that GFP faithfully labeled CD19+ B cells, but not HSPCs (lineage negative [Lin−] cKit+Sca1+; supplemental Figure 1C). We further validated the activation of NF-κB/Notch pathways in committed B cells by RNA-seq (Figure 1A).
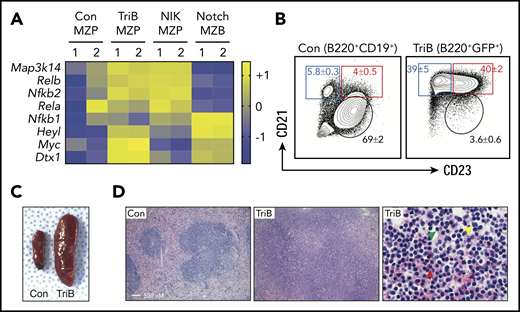
Concurrent activation of NF-κB and Notch signaling induces splenomegaly and marginal zone expansion. (A) Heatmap of RNA-seq–based gene expression results (n = 2 biological replicates for each genotype) showing upregulation of NF-κB pathway genes Map3k14, Relb, and Nfkb2 in MZP B cells from NIK and TriB mice and upregulation of Notch signaling components Heyl, Myc, and Dtx1 in MZB cells from Notch mice and MZPs from TriB mice. Comparison with protein levels in Figure 3A. (B) FACS diagrams gated on B220+CD19+ B cells (left) or B220+GFP+ B cells (right) demonstrating a marked increase in MZPs (red rectangle) and MZBs (blue rectangle) in TriB relative to normal mice used as controls (Con; n = 10 in both groups). MZBs (CD21+CD23−/dim) and MZPs (CD21+CD23+) are distinguished by level of CD23 expression. Table 1 provides additional data. (C) Photographic image depicting the difference in spleen size of age-matched 4-month-old Con and TriB mice. (D) Hematoxylin and eosin–stained tissue sections of spleens obtained from a 4-month-old Con mouse (left) and a TriB mouse (center and right). Original magnification, ×100 (left and center) and ×500 (right). Green, yellow, and red arrows denote small lymphocytes, scattered large transformed cells, and plasma cells, respectively.
Concurrent activation of NF-κB and Notch signaling induces splenomegaly and marginal zone expansion. (A) Heatmap of RNA-seq–based gene expression results (n = 2 biological replicates for each genotype) showing upregulation of NF-κB pathway genes Map3k14, Relb, and Nfkb2 in MZP B cells from NIK and TriB mice and upregulation of Notch signaling components Heyl, Myc, and Dtx1 in MZB cells from Notch mice and MZPs from TriB mice. Comparison with protein levels in Figure 3A. (B) FACS diagrams gated on B220+CD19+ B cells (left) or B220+GFP+ B cells (right) demonstrating a marked increase in MZPs (red rectangle) and MZBs (blue rectangle) in TriB relative to normal mice used as controls (Con; n = 10 in both groups). MZBs (CD21+CD23−/dim) and MZPs (CD21+CD23+) are distinguished by level of CD23 expression. Table 1 provides additional data. (C) Photographic image depicting the difference in spleen size of age-matched 4-month-old Con and TriB mice. (D) Hematoxylin and eosin–stained tissue sections of spleens obtained from a 4-month-old Con mouse (left) and a TriB mouse (center and right). Original magnification, ×100 (left and center) and ×500 (right). Green, yellow, and red arrows denote small lymphocytes, scattered large transformed cells, and plasma cells, respectively.
The earliest stage of B-cell development occurs in BM from common lymphoid progenitors and passes through stages of pre–pro-B cells/early pro-B cells, late pro-B cells/early pre-B cells, and late pre-B cells/immature B cells to mature circulating B cells.50-52 Flow cytometric analysis using a published staining strategy53 showed that the percentage of TriB BM B cells in each developmental stage (1-4) was significantly decreased compared with wild-type control mice (supplemental Figure 1D-E). In addition, the absolute number of B220+ B cells was significantly lower in TriB mice, with no changes in BM counts. Furthermore, the absolute numbers of doubly activated (GFP+) B cells in the BM were lower at every developmental stage than those in controls (supplemental Figure 1F). These data suggest that coactivation of NF-κB/Notch signaling reduced BM B-cell numbers.
In contrast to the reduced BM B-cell numbers, B-cell numbers were markedly increased in TriB vs control spleens (Table 1). The increased B cells were mainly MZPs and MZBs, whereas the frequencies of CD21−CD23+ follicular B cells were markedly decreased (Figure 1B). Similar results were obtained by using different cell surface markers and gating strategies to define B-cell subsets in the spleen (supplemental Figure 2A). These data indicate that B-cell differentiation was accelerated in the spleen, and the cells accumulated in the MZP/MZB stage. Consistent with the increased spleen B cells, spleens were significantly enlarged, with marked expansion of marginal zones in 4-month-old TriB vs control mice (Figure 1C-D). Immunohistochemical staining confirmed that B-cell zones were expanded, whereas T-cell zones were decreased, along with reduced follicle numbers in TriB spleens (supplemental Figure 2B). Histologically, the expanded marginal zone consists of sheets of small B cells intermixed with scattered large transformed cells and plasma cells (Figure 1D right). Although the morphology is equivalent to that of human SMZL, we named this early lesion a B-cell lymphoproliferative disorder because immunoglobulin VDJ gene rearrangement analysis by genomic polymerase chain reaction (PCR) failed to detect clonality (data not shown).
Frequency and abundance of splenic B-cell subpopulations in TriB mice
| Spleen | Total spleen cells, × 106 | Mean ± SE | |||||||||||
|---|---|---|---|---|---|---|---|---|---|---|---|---|---|
| T1 | T2 | T3 | Follicular B cells | MZBs | MZPs | ||||||||
| Control | 102 ± 19 | 25.8 ± 12.9 | 1.7 ± 0.9 | 21.9 ± 12.3 | 1.5 ± 0.8 | 3.1 ± 1.7 | 0.7 ± 0.4 | 75.1 ± 8.5 | 9.2 ± 2.6 | 67.6 ± 11.5 | 1.1 ± 0.2 | 29.2 ± 10.2 | 0.6 ± 0.4 |
| TriB | 535 ± 42* | 40.3 ± 20.0 | 1.7 ± 1.2 | 8.0 ± 3.7 | 0.3 ± 0.2 | 2.3 ± 1.1 | 0.9 ± 0.6 | 40.0 ± 11.8 | 6.4 ± 3.1 | 52.6 ± 13.9 | 48.8 ± 18.5* | 42.6 ± 11.7 | 28.6 ± 4.6* |
| TriB (GFP+) | 39.3 ± 21.0 | 1.4 ± 1.0 | 6.5 ± 3.2 | 0.2 ± 0.2 | 2.1 ± 1.1 | 0.8 ± 0.6 | 37.9 ± 9.6† | 5.9 ± 3.0 | 52.8 ± 9.7 | 63.0 ± 12.3‡ | 42.6 ± 11.7 | 28.0 ± 4.7‡ | |
| TriB (GFP−) | 41.4 ± 18.3 | 0.3 ± 0.2 | 13.7 ± 6.6 | 0.1 ± 0.1 | 3.2 ± 1.4 | 0.1 ± 0.1 | 40.1 ± 15.7 | 0.5 ± 0.1 | 54 ± 16.0 | 0.6 ± 0.2 | 38.3 ± 12.3 | 0.6 ± 0.3 | |
Frequency of six distinct splenic B-cell populations was determined using flow cytometry. Absolute numbers were calculated by frequency times total spleen cell number. Five TriB and normal mice each, age 4 to 5 mo in both cases, were used. T1, T2, and T3 refer to transitional type 1, 2, and 3 B cells. Absolute numbers were calculated as follows: T1, spleen cell count × single cell percentage × CD19+B220+ percentage × CD21−IgMhigh percentage × AA4.1+CD23− percentage; T2, spleen cell count × single cell percentage × CD19+B220+ percentage × CD21−IgM+ percentage × AA4.1+CD23+ percentage; T3, spleen cell count × single cell percentage × CD19+B220+ percentage × CD21intIgMint percentage × AA4.1+CD23+ percentage; follicular B cells, spleen cell count × single cell percentage × CD19+B220+ percentage × CD21intIgMhigh percentage × AA4.1−CD23+ percentage; MZPs, spleen cell count × single cell percentage × CD19+B220+ percentage × CD21highIgMhigh percentage × AA4.1−CD23+ percentage; MZBs, spleen cell count × single cell percentage × CD19+B220+ percentage × CD21highIgMint percentage × AA4.1−CD23− percentage.
SE, standard error.
P < .01 (control vs TriB).
P < .05.
P < .01 (control vs TriB [GFP+]).
Coactivation of NF-κB/Notch signaling induces overt lymphoma in TriB mice age >6 months
TriB mice became sick after 6 months of age and developed overt SMZL. Consistent with previous studies,33,34 we found that activation of either NF-κB or Notch signaling alone in committed B cells did not induce lymphomatous transformation as efficiently as coactivation of both (Figure 2A). This, along with the pathway gene expression (Figure 1A), protein expression (see "Epigenetic regulation is involved in B-myeloid conversion"), and the fact that only TriB MZPs could engraft in recipient mice (supplemental Figure 4A) further demonstrated that both pathways were activated in TriB B cells. Analysis of TriB mice of different ages showed that the expanded MZPs (GFP+B220+CD21+CD23+) gradually differentiated to MZBs (GFP+B220+CD21+CD23−), along with loss of expression of the pan-B marker B220, and eventually all became GFP+CD19+B220−CD21−CD23− lymphoma cells (Figure 2B-C). In addition, expression of the MZB markers34 CD1d and CD36 was slightly decreased in lymphoma cells, but their expression was mildly increased in TriB MZPs compared with control MZPs. The expression of another marginal zone marker, CD25, was maintained in lymphoma cells (Figure 2D). Furthermore, the lymphoma cells were essentially negative for CD138 (plasma cell marker) and CD11b/Gr1 (myeloid markers; Figure 2E). Histologically, spleens and livers were infiltrated by sheets of medium atypical lymphocytes (Figure 2F). Immunostaining confirmed the loss of B220 and demonstrated strong expression of B-cell transcription factor PAX5. Lymphoma cells were negative for germinal center B-cell marker BCL6 and, for the most part, plasma cell marker MUM1. The presence of scattered plasma cells suggested the plasmacytic differentiation potential of these lymphoma cells, similar to what is seen in human SMZL (supplemental Figure 2C). Genomic PCR VDJ recombination analysis detected single bands in most tumor-bearing mice, with subsequent DNA sequencing demonstrating the mono- or oligoclonality of the lymphomas (Figure 2G-H; supplemental Figure 3A). Importantly, lymphoma cells were readily propagated in syngeneic host mice, demonstrating that the putative tumor cells were indeed fully transformed (data not shown). TriB mice developed lymphoma with full genetic penetrance (100% tumor incidence). IPA showed that the malignant transformation was accompanied by upregulated B-cell receptor and growth/cancer-related signaling and downregulated tumor inhibitory p53 and AMPK signaling (Figure 2I-J). Collectively, our data provide definitive genetic evidence that coactivation of NF-κB/Notch signaling induces B-cell lymphoma.
![Concurrent activation of NF-κB and Notch signaling induces B-cell lymphomatous transformation in adult mice. (A) Reduced tumor-dependent survival of double transgenic TriB mice (coactivation of NF-κB and Notch2ICN) compared with single transgenic NIK mice (NF-κB activation only), single transgenic Notch mice (Notch activation only), and normal B6 mice (no genetic pathway activation) used as controls (Con; n ≥ 12 for each phenotype). Lymphoma development was fully penetrant (100% tumor incidence in TriB mice). (B) Flow cytometric analysis of changes in the mature B-cell compartment leading to lymphoma development in TriB mice. CD21 and CD23 expression of GFP+-gated B cells was measured at 5 time points ranging from 4 to 15 months of age. Progressive loss of, first, CD23 expression and, later on, CD21 expression leads to a largely homogeneous double-negative population of CD21−CD23− lymphoma cells. B cells of normal mice (Con) gated on CD19+ were included as control. Mean frequencies ± standard error of cell fractions are indicated (n = 3). (C) Loss of B220 expression in the course of neoplastic B-cell development, using tumor-bearing 12-month-old TriB mice (n = 6) as an example. The flow result shown was confirmed by B220 immunostaining of tissue sections presented in supplemental Figure 2C. (D) Representative flow diagrams of expression levels of MZB markers CD1d, CD36 and CD25 in MZPs (red) and lymphoma cells (green) of TriB mice relative to MZPs in normal mice (wild type [WT]) used as control (black; n = 3 in both groups). (E) Flow diagram indicating limited potential for expression of plasma cell marker CD138 and lack of expression of myeloid markers Mac1/Gr1 in TriB lymphoma cells (n = 3). (F) Hematoxylin and eosin–stained tissue sections of liver and spleen of TriB mice diffusely infiltrated with neoplastic B cells (original magnification, ×500; n = 3). Residual hepatocytes in the liver are discernible to the right of the yellow dotted line. (G) Agarose gel containing ethidium bromide–stained PCR fragments of genomic VDJ rearrangements that indicate monoclonal growth (single band) of lymphomas obtained from TriB mice (right; panel, n = 3) but polyclonal B cells (multiple bands) in WBM or spleen (Spl) samples from TriB mice. Germ line JH1-3 fragments are denoted by arrow heads on the left, next to the size marker. A PCR indicator fragment of T-cell gene Thy1 served as positive control. (H) PCR products from TriB lymphoma shown in panel G were subcloned with the help of a TA cloning kit, DNA sequenced, and aligned to corresponding regions of the immunoglobulin heavy-chain germ line locus using the IgBLAST software tool (n = 5; supplemental Figure 3A). In the example shown, 9 of 10 PCR fragments were identified as V3D3J4 rearrangements. The remaining fragment used diversity gene D2 instead. (I) Ingenuity pathway analysis results for canonical pathways using differentially expressed genes comparing TriB lymphoma with TriB MZPs. Differentially expressed genes were defined as q value <.05 and log2-fold change ≥1 or ≤ −1. z score refers to the direction and magnitude of the enrichment. (J) z scores of selected significant canonical pathways that are enriched in TriB lymphoma (yellow) or TriB MZPs (blue). For all pathways listed, P < .05. **P < .01.](https://ash.silverchair-cdn.com/ash/content_public/journal/blood/135/2/10.1182_blood.2019001438/2/m_bloodbld2019001438f2.png?Expires=1767734001&Signature=N66KMc4~~TxHEuuGyMETT1-penwXAaWWcW5VE2Hfei1ZGRsBJIW2cIsEa0Edn063ke-aqiY7yaltdu1Biu7H8vcq-ija3UyQnXB0z2nzyF5jSNpYLNMcGLq89mqKhKzLvQp~lmfE~CeFq7oB2zIn2pmCJ78lgsk1HPcq64gFAzK-UaJuvn-8ePQbOwidcdEfyaWdltjUcqa9qvkBX~U67-9Ng6ih~qJkQJxFPGKncRT0UUd4m-i7BgQ-eDG2C7EhiXVc~HyzX~j6eLaSKX-62VDI9XAgIFhDeJKMX7VKidU57MXSALxkw0u4xVw40d0LFeNUcacS8qfH5InD~2asoA__&Key-Pair-Id=APKAIE5G5CRDK6RD3PGA)
Concurrent activation of NF-κB and Notch signaling induces B-cell lymphomatous transformation in adult mice. (A) Reduced tumor-dependent survival of double transgenic TriB mice (coactivation of NF-κB and Notch2ICN) compared with single transgenic NIK mice (NF-κB activation only), single transgenic Notch mice (Notch activation only), and normal B6 mice (no genetic pathway activation) used as controls (Con; n ≥ 12 for each phenotype). Lymphoma development was fully penetrant (100% tumor incidence in TriB mice). (B) Flow cytometric analysis of changes in the mature B-cell compartment leading to lymphoma development in TriB mice. CD21 and CD23 expression of GFP+-gated B cells was measured at 5 time points ranging from 4 to 15 months of age. Progressive loss of, first, CD23 expression and, later on, CD21 expression leads to a largely homogeneous double-negative population of CD21−CD23− lymphoma cells. B cells of normal mice (Con) gated on CD19+ were included as control. Mean frequencies ± standard error of cell fractions are indicated (n = 3). (C) Loss of B220 expression in the course of neoplastic B-cell development, using tumor-bearing 12-month-old TriB mice (n = 6) as an example. The flow result shown was confirmed by B220 immunostaining of tissue sections presented in supplemental Figure 2C. (D) Representative flow diagrams of expression levels of MZB markers CD1d, CD36 and CD25 in MZPs (red) and lymphoma cells (green) of TriB mice relative to MZPs in normal mice (wild type [WT]) used as control (black; n = 3 in both groups). (E) Flow diagram indicating limited potential for expression of plasma cell marker CD138 and lack of expression of myeloid markers Mac1/Gr1 in TriB lymphoma cells (n = 3). (F) Hematoxylin and eosin–stained tissue sections of liver and spleen of TriB mice diffusely infiltrated with neoplastic B cells (original magnification, ×500; n = 3). Residual hepatocytes in the liver are discernible to the right of the yellow dotted line. (G) Agarose gel containing ethidium bromide–stained PCR fragments of genomic VDJ rearrangements that indicate monoclonal growth (single band) of lymphomas obtained from TriB mice (right; panel, n = 3) but polyclonal B cells (multiple bands) in WBM or spleen (Spl) samples from TriB mice. Germ line JH1-3 fragments are denoted by arrow heads on the left, next to the size marker. A PCR indicator fragment of T-cell gene Thy1 served as positive control. (H) PCR products from TriB lymphoma shown in panel G were subcloned with the help of a TA cloning kit, DNA sequenced, and aligned to corresponding regions of the immunoglobulin heavy-chain germ line locus using the IgBLAST software tool (n = 5; supplemental Figure 3A). In the example shown, 9 of 10 PCR fragments were identified as V3D3J4 rearrangements. The remaining fragment used diversity gene D2 instead. (I) Ingenuity pathway analysis results for canonical pathways using differentially expressed genes comparing TriB lymphoma with TriB MZPs. Differentially expressed genes were defined as q value <.05 and log2-fold change ≥1 or ≤ −1. z score refers to the direction and magnitude of the enrichment. (J) z scores of selected significant canonical pathways that are enriched in TriB lymphoma (yellow) or TriB MZPs (blue). For all pathways listed, P < .05. **P < .01.
Concurrent activation of NF-κB and Notch signaling induces B-cell lymphomatous transformation in adult mice. (A) Reduced tumor-dependent survival of double transgenic TriB mice (coactivation of NF-κB and Notch2ICN) compared with single transgenic NIK mice (NF-κB activation only), single transgenic Notch mice (Notch activation only), and normal B6 mice (no genetic pathway activation) used as controls (Con; n ≥ 12 for each phenotype). Lymphoma development was fully penetrant (100% tumor incidence in TriB mice). (B) Flow cytometric analysis of changes in the mature B-cell compartment leading to lymphoma development in TriB mice. CD21 and CD23 expression of GFP+-gated B cells was measured at 5 time points ranging from 4 to 15 months of age. Progressive loss of, first, CD23 expression and, later on, CD21 expression leads to a largely homogeneous double-negative population of CD21−CD23− lymphoma cells. B cells of normal mice (Con) gated on CD19+ were included as control. Mean frequencies ± standard error of cell fractions are indicated (n = 3). (C) Loss of B220 expression in the course of neoplastic B-cell development, using tumor-bearing 12-month-old TriB mice (n = 6) as an example. The flow result shown was confirmed by B220 immunostaining of tissue sections presented in supplemental Figure 2C. (D) Representative flow diagrams of expression levels of MZB markers CD1d, CD36 and CD25 in MZPs (red) and lymphoma cells (green) of TriB mice relative to MZPs in normal mice (wild type [WT]) used as control (black; n = 3 in both groups). (E) Flow diagram indicating limited potential for expression of plasma cell marker CD138 and lack of expression of myeloid markers Mac1/Gr1 in TriB lymphoma cells (n = 3). (F) Hematoxylin and eosin–stained tissue sections of liver and spleen of TriB mice diffusely infiltrated with neoplastic B cells (original magnification, ×500; n = 3). Residual hepatocytes in the liver are discernible to the right of the yellow dotted line. (G) Agarose gel containing ethidium bromide–stained PCR fragments of genomic VDJ rearrangements that indicate monoclonal growth (single band) of lymphomas obtained from TriB mice (right; panel, n = 3) but polyclonal B cells (multiple bands) in WBM or spleen (Spl) samples from TriB mice. Germ line JH1-3 fragments are denoted by arrow heads on the left, next to the size marker. A PCR indicator fragment of T-cell gene Thy1 served as positive control. (H) PCR products from TriB lymphoma shown in panel G were subcloned with the help of a TA cloning kit, DNA sequenced, and aligned to corresponding regions of the immunoglobulin heavy-chain germ line locus using the IgBLAST software tool (n = 5; supplemental Figure 3A). In the example shown, 9 of 10 PCR fragments were identified as V3D3J4 rearrangements. The remaining fragment used diversity gene D2 instead. (I) Ingenuity pathway analysis results for canonical pathways using differentially expressed genes comparing TriB lymphoma with TriB MZPs. Differentially expressed genes were defined as q value <.05 and log2-fold change ≥1 or ≤ −1. z score refers to the direction and magnitude of the enrichment. (J) z scores of selected significant canonical pathways that are enriched in TriB lymphoma (yellow) or TriB MZPs (blue). For all pathways listed, P < .05. **P < .01.
NF-κB/Notch–coactivated MZPs, but not MZBs, are transplantable and convert to myeloid lineage
The marked marginal zone expansion with morphology indistinguishable from SMZL prompted us to test if TriB splenic B cells are transplantable and able to regenerate lymphoma in recipient mice. Compared with splenic B cells from control, NIK, or Notch spleen B cells, only TriB B cells were able to give rise to significant chimerisms at 3 months posttransplantation (supplemental Figure 4A), suggesting a synergistic impact of NF-κB/Notch signaling on engraftment, survival, and maintenance of spleen B cells. Unexpectedly, a great majority of CD45.2+ donor cells in the BM and peripheral blood expressed no B-cell markers (supplemental Figure 4B). We prolonged the observation period to 6 months, anticipating that the mice would eventually develop lymphoma. However, no chimerisms were detected at 6 months posttransplantation (data not shown). To determine the nature of donor B cell–derived non-B cells in recipient mice and test whether MZBs or MZPs contribute to the chimerisms, we next transplanted highly purified MZPs and MZBs separately into lethally irradiated recipient mice (supplemental Figure 4C). Three months later, we found that only MZPs had given rise to significant chimerisms. Unexpectedly, all circulating peripheral blood CD45.2+ donor cells were CD11b+Gr1+ myeloid cells, and almost no remaining GFP+ B cells could be detected (Figure 3A). Similar to when using whole spleen B cells, donor cells could not be detected in the peripheral blood 6 months posttransplantation in a majority of recipient mice, suggesting that TriB MZPs converted to myeloid cells initially, but they eventually were exhausted due to a lack of the ability to self renew. However, we did observe a small fraction of donor B cells in the spleen (data not shown), which, along with persistent existence of GFP+ B cells even 5 months after transplantation, suggests that a portion of TriB B cells can self renew (Figure 3B).
![NF-κB/Notch–coactivated MZPs are transplantable and convert to myeloid cells in recipient mice. (A) Flow analysis of donor (CD45.2+) chimerisms in host (CD45.1+) mice (n = 5) 3 months after administration of TriB MZBs (upper left) or MZPs (upper right; 3 × 10⁶ per recipient in both cases). Unexpectedly, CD45.2+ MZPs lacked B220 and GFP expression (lower left) but were positive for myeloid markers Mac1 and Gr1 (lower right). (B) Time course of abundance of CD45.2+GFP+ donor BM cells in CD45.1 hosts 2 to 3 months after cell transfer. WBM cells (3 × 10⁶ per recipient) were transferred to lethally irradiated CD45.1 recipients, and GFP+ cells were enumerated by flow cytometry at monthly intervals. BM from normal mice (black) was used as control. Unlike donor B cells from NIK mice (green) or ICN mice (blue), B cells from TriB mice (red) exhibited self renewal, with a peak at 3 months after BM transplantation (n = 5 for all groups). (C) Representative FACS plots of peripheral blood from mice receiving TriB MZP transplants. The Mac1+Gr1+ phenotype of these cells is consistent with AML (n = 3). (D) Flow analysis showing that a significant fraction of converted myeloid leukemia cells shown in panel C express stemness marker cKit (n = 3). (E) PCR VDJ recombination assay demonstrating clonality of converted myeloid leukemia cells (Bswitch, lanes 4 and 5). In contrast, TriB whole splenocytes (lane 2) and flow-sorted CD45.2+ cells recovered from host mice that had received TriB MZPs on day 4.5 (lane 3) were polyclonal. Lane 1, size marker. Bottom, germ line fragment of a T-cell gene used as control. (F) Sequencing analysis of VDJ rearrangements from panel E, as described in Figure 2H (supplemental Figure 3B). (G) Immunoblots showing levels of CEBPα and PAX5 in TriB splenic B cells (TriB), normal splenic B cells (Con), converted myeloid leukemia cells (Bswitch), and TriB lymphoma cells (TriB[lym]). Actin was included as a loading control.](https://ash.silverchair-cdn.com/ash/content_public/journal/blood/135/2/10.1182_blood.2019001438/2/m_bloodbld2019001438f3.png?Expires=1767734001&Signature=ByQ4yilI0p68kWa3Yo8ONXMwS08LISiLmrDGiCx3hOxbGgo-STT~G3e9MQkKL9I8W3LYJ76XFjya9jYN5aVQK-W0zLG0~NrgbxRyYEQxy~2D0MBfy85Wx4WcWfjRqHjn-DpUq4w1Se6jAma8FdeD3klwlzqAoPoyT9gvgrS56iuh1a-CUjvfB94B3yqT7juVuwveJFVdt-0CFocHC0VvFHwhoyVwrN0mQlm7c9yO2OaHvR5o4fvg51B4POSg47i5AwJj43r2~9KgBbbwSKOQfTB45xuFaubipBvOospEQtre2AI0UUztlVAZ34pWacUGuPdfy9HFJjD6nu3dPWwcrw__&Key-Pair-Id=APKAIE5G5CRDK6RD3PGA)
NF-κB/Notch–coactivated MZPs are transplantable and convert to myeloid cells in recipient mice. (A) Flow analysis of donor (CD45.2+) chimerisms in host (CD45.1+) mice (n = 5) 3 months after administration of TriB MZBs (upper left) or MZPs (upper right; 3 × 10⁶ per recipient in both cases). Unexpectedly, CD45.2+ MZPs lacked B220 and GFP expression (lower left) but were positive for myeloid markers Mac1 and Gr1 (lower right). (B) Time course of abundance of CD45.2+GFP+ donor BM cells in CD45.1 hosts 2 to 3 months after cell transfer. WBM cells (3 × 10⁶ per recipient) were transferred to lethally irradiated CD45.1 recipients, and GFP+ cells were enumerated by flow cytometry at monthly intervals. BM from normal mice (black) was used as control. Unlike donor B cells from NIK mice (green) or ICN mice (blue), B cells from TriB mice (red) exhibited self renewal, with a peak at 3 months after BM transplantation (n = 5 for all groups). (C) Representative FACS plots of peripheral blood from mice receiving TriB MZP transplants. The Mac1+Gr1+ phenotype of these cells is consistent with AML (n = 3). (D) Flow analysis showing that a significant fraction of converted myeloid leukemia cells shown in panel C express stemness marker cKit (n = 3). (E) PCR VDJ recombination assay demonstrating clonality of converted myeloid leukemia cells (Bswitch, lanes 4 and 5). In contrast, TriB whole splenocytes (lane 2) and flow-sorted CD45.2+ cells recovered from host mice that had received TriB MZPs on day 4.5 (lane 3) were polyclonal. Lane 1, size marker. Bottom, germ line fragment of a T-cell gene used as control. (F) Sequencing analysis of VDJ rearrangements from panel E, as described in Figure 2H (supplemental Figure 3B). (G) Immunoblots showing levels of CEBPα and PAX5 in TriB splenic B cells (TriB), normal splenic B cells (Con), converted myeloid leukemia cells (Bswitch), and TriB lymphoma cells (TriB[lym]). Actin was included as a loading control.
NF-κB/Notch–coactivated MZPs are transplantable and convert to myeloid cells in recipient mice. (A) Flow analysis of donor (CD45.2+) chimerisms in host (CD45.1+) mice (n = 5) 3 months after administration of TriB MZBs (upper left) or MZPs (upper right; 3 × 10⁶ per recipient in both cases). Unexpectedly, CD45.2+ MZPs lacked B220 and GFP expression (lower left) but were positive for myeloid markers Mac1 and Gr1 (lower right). (B) Time course of abundance of CD45.2+GFP+ donor BM cells in CD45.1 hosts 2 to 3 months after cell transfer. WBM cells (3 × 10⁶ per recipient) were transferred to lethally irradiated CD45.1 recipients, and GFP+ cells were enumerated by flow cytometry at monthly intervals. BM from normal mice (black) was used as control. Unlike donor B cells from NIK mice (green) or ICN mice (blue), B cells from TriB mice (red) exhibited self renewal, with a peak at 3 months after BM transplantation (n = 5 for all groups). (C) Representative FACS plots of peripheral blood from mice receiving TriB MZP transplants. The Mac1+Gr1+ phenotype of these cells is consistent with AML (n = 3). (D) Flow analysis showing that a significant fraction of converted myeloid leukemia cells shown in panel C express stemness marker cKit (n = 3). (E) PCR VDJ recombination assay demonstrating clonality of converted myeloid leukemia cells (Bswitch, lanes 4 and 5). In contrast, TriB whole splenocytes (lane 2) and flow-sorted CD45.2+ cells recovered from host mice that had received TriB MZPs on day 4.5 (lane 3) were polyclonal. Lane 1, size marker. Bottom, germ line fragment of a T-cell gene used as control. (F) Sequencing analysis of VDJ rearrangements from panel E, as described in Figure 2H (supplemental Figure 3B). (G) Immunoblots showing levels of CEBPα and PAX5 in TriB splenic B cells (TriB), normal splenic B cells (Con), converted myeloid leukemia cells (Bswitch), and TriB lymphoma cells (TriB[lym]). Actin was included as a loading control.
Surprisingly, 3 of 20 mice receiving transplants developed AML with strong CD11b/Gr1 expression in the peripheral blood and BM (Figure 3C; data not shown). These transformed leukemia cells also expressed cKit/CD117 (Figure 3D), which was not expressed by TriB B cells (supplemental Figure 1C). Intriguingly, these leukemia cells had clonal VDJ gene rearrangement, indicating that they were derived from committed B cells, not contaminating HSPCs (Figure 3E-F; supplemental Figure 3B). Immunoblots showed that the converted AML cells (Bswitch) lost expression of B-cell transcription factor PAX5 and gained expression of CEBPα, further substantiating their myeloid nature (Figure 3G). In addition, these converted leukemia cells were transplantable, with higher repopulating capacity in the CD11b+cKit+ population (data not shown). Collectively, these data indicate that NF-κB/Notch–coactivated MZPs can convert to myeloid lineage and further transform into myeloid leukemia in a permissive microenvironment.
NF-κB/Notch–coactivated MZPs convert to myeloid lineage through dedifferentiation
Currently, there are 3 hypotheses to explain B-myeloid conversion: direct transdifferentiation (conversion of 1 cell type to another without undergoing an intermediate progenitor stage), dedifferentiation (reversion to an earlier developmental stage) followed by redifferentiation along the myeloid pathway, and divergent evolution from a common progenitor.19,26,54-57 Our mouse model supports the existence of a common progenitor, because TriB MZPs were able to transform into lymphoma de novo and convert to myeloid lineage posttransplantation. We next performed experiments to determine whether transdifferentiation or dedifferentiation was involved in myeloid conversion. We repeated the transplantation experiments using purified TriB MZPs, but stopped earlier, on days 4.5 and 9 posttransplantation. On day 4.5, an Lin− population was recognized, but no clear Lin−cKit+Sca1+ HSPCs were detected (Figure 4A). On day 9, the donor cells were mainly composed of B220−Mac/Gr1+ myeloid cells. However, a small number of donor B cells were converted to Lin−cKit+Sca1+ HSPCs (Figure 4B), indicating that the transplanted TriB MZPs can dedifferentiate to non-B/nonmyeloid cells and sometimes even gain an HSPC immunophenotype.
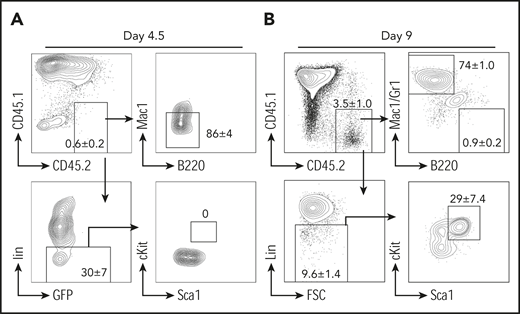
B-myeloid conversion is through dedifferentiation. Representative flow contour diagrams of donor MZPs on day 4.5 (A) and day 9 (B) after cell transfer. Most donor CD45.2+ cells (upper left) converted to myeloid marker–negative or Lin− cells, but by day 9, a small yet clearly discernable number of donor B cells had undergone dedifferentiation to an immature Lin− cell type (lower left) exhibiting HSPC immunophenotype cKit+Sca1+Lin− (lower right; n = 4).
B-myeloid conversion is through dedifferentiation. Representative flow contour diagrams of donor MZPs on day 4.5 (A) and day 9 (B) after cell transfer. Most donor CD45.2+ cells (upper left) converted to myeloid marker–negative or Lin− cells, but by day 9, a small yet clearly discernable number of donor B cells had undergone dedifferentiation to an immature Lin− cell type (lower left) exhibiting HSPC immunophenotype cKit+Sca1+Lin− (lower right; n = 4).
Epigenetic regulation is involved in B-myeloid conversion
Because we were using a CD19-Cre–driven lineage tracing system in which the ROSA26 locus is permanently rearranged, leading to stable GFP expression in all cells that have undergone Cre-mediated excision, the loss of GFP was unexpected (Figure 3A). Consistent with that, we noted a marked decrease in NIK and ICN protein levels in converted leukemia cells (Bswitch), even though these proteins were elevated in TriB B cells (Figure 5A). The observed downregulation of NIK in leukemia cells was in accordance with our recent finding that NIK is a myeloid leukemia suppressor.37 A possible reason for the lack of GFP expression in leukemia cells is the silencing of the ROSA26 promoter by epigenetic means either directly or indirectly during myeloid conversion. To evaluate this, we first confirmed with the help of genomic PCR analysis that Cre-mediated transgene activation actually took place in Bswitch cells (Figure 5B).
![Epigenetic change in part governs B-myeloid conversion. (A) Western blot of NF-κB (right) and Notch (left) signaling proteins in TriB splenic B cells (TriB), normal splenic B cells (Con), converted myeloid leukemia cells (Bswitch), and transformed TriB lymphoma cells (TriB[lym]). Actin is used as a loading control. Note that these results further confirm the activation of both NF-κB and Notch signaling in TriB mice. (B) Genomic PCR analysis of Cre-mediated transgene recombination in converted myeloid leukemia cells (Bswitch) from 2 different mice. TriB genomic DNA was used for detection of transgenes without recombination. Note the deletion of transgene Neo gene after Cre-mediated recombination. (C) Quantitative PCR (qPCR) analysis of Gt(ROSA)26Sor expression in TriB MZPs (MZP) and converted myeloid leukemia cells (Bswitch; n = 3). (D) Chromatin immunoprecipitation (ChIP)–qPCR measurement of histone 3 lysine 27 acetylation (H3K27ac) in the promoter regions of Gt(ROSA)26Sor, Itgam (CD11b), and Cd19 genes in TriB MZPs and converted myeloid cells (Bswitch). (E) ATAC-seq signal coverage across Gt(ROSA)26Sor, Itgam, and Cd19 regions in TriB MZPs (upper) and Bswitch cells (lower) were visualized with Integrated Genomics Viewer. (F) Relative expression of Tet2 and Dnmt1 in TriB MZPs (MZP) and converted myeloid leukemia cells (Bswitch) by qPCR (n = 3). (G) Determination of cell growth in vitro indicating that DNA demethylating drug 5-aza-2′-deoxycytidine (5AZA) suppressed the growth of converted myeloid leukemia cells (n = 3). (H) Flow cytometric analysis of GFP expression in converted myeloid leukemia cells treated with 5AZA (n = 3); representative contour plots comparing untreated cells (dimethyl sulfoxide [DMSO]) with treated cells (left), and recovery of GFP expression upon treatment using 5AZA (right). (I) Expression levels of NIK and Notch2ICN (ICN) before and after drug treatment (5AZA) of converted myeloid leukemia cells (n = 3). Glyceraldehyde-3-phosphate dehydrogenase (GAPDH) is used as a loading control. *P < .05, **P < .01.](https://ash.silverchair-cdn.com/ash/content_public/journal/blood/135/2/10.1182_blood.2019001438/2/m_bloodbld2019001438f5.png?Expires=1767734001&Signature=TMzw4Lvk4lbYds5KhoLWM8j2seQYGwlvYfjBb8CGyuaIqYq7N9NbqjTxyKuIgw-6MUheBRnQqlO0PQVeTxDoF5w4j7ZtAAu~6CAT~A1BgY1wtpxuEunWspYuVH1sBorMGT5FpNsj6kGl31Pax63vPXgmpaHjkOMOs772a4Ps4aL6scF8IwSt4YgmqZ5QHcl-Zc0A3MY67b8ClGPFpk5UYPghI9h5-wGqGh4C~dOtcDDBKUdRruCgfNp9HFJIsM1MagALCas1E3PTzGbR06lYNsRVxBgUu2mQFRk7fbmDl3B4-Ty6uX~mCHhODYfh-MTtpwaVOg-HHm8Lkm3eD-JmPw__&Key-Pair-Id=APKAIE5G5CRDK6RD3PGA)
Epigenetic change in part governs B-myeloid conversion. (A) Western blot of NF-κB (right) and Notch (left) signaling proteins in TriB splenic B cells (TriB), normal splenic B cells (Con), converted myeloid leukemia cells (Bswitch), and transformed TriB lymphoma cells (TriB[lym]). Actin is used as a loading control. Note that these results further confirm the activation of both NF-κB and Notch signaling in TriB mice. (B) Genomic PCR analysis of Cre-mediated transgene recombination in converted myeloid leukemia cells (Bswitch) from 2 different mice. TriB genomic DNA was used for detection of transgenes without recombination. Note the deletion of transgene Neo gene after Cre-mediated recombination. (C) Quantitative PCR (qPCR) analysis of Gt(ROSA)26Sor expression in TriB MZPs (MZP) and converted myeloid leukemia cells (Bswitch; n = 3). (D) Chromatin immunoprecipitation (ChIP)–qPCR measurement of histone 3 lysine 27 acetylation (H3K27ac) in the promoter regions of Gt(ROSA)26Sor, Itgam (CD11b), and Cd19 genes in TriB MZPs and converted myeloid cells (Bswitch). (E) ATAC-seq signal coverage across Gt(ROSA)26Sor, Itgam, and Cd19 regions in TriB MZPs (upper) and Bswitch cells (lower) were visualized with Integrated Genomics Viewer. (F) Relative expression of Tet2 and Dnmt1 in TriB MZPs (MZP) and converted myeloid leukemia cells (Bswitch) by qPCR (n = 3). (G) Determination of cell growth in vitro indicating that DNA demethylating drug 5-aza-2′-deoxycytidine (5AZA) suppressed the growth of converted myeloid leukemia cells (n = 3). (H) Flow cytometric analysis of GFP expression in converted myeloid leukemia cells treated with 5AZA (n = 3); representative contour plots comparing untreated cells (dimethyl sulfoxide [DMSO]) with treated cells (left), and recovery of GFP expression upon treatment using 5AZA (right). (I) Expression levels of NIK and Notch2ICN (ICN) before and after drug treatment (5AZA) of converted myeloid leukemia cells (n = 3). Glyceraldehyde-3-phosphate dehydrogenase (GAPDH) is used as a loading control. *P < .05, **P < .01.
Epigenetic change in part governs B-myeloid conversion. (A) Western blot of NF-κB (right) and Notch (left) signaling proteins in TriB splenic B cells (TriB), normal splenic B cells (Con), converted myeloid leukemia cells (Bswitch), and transformed TriB lymphoma cells (TriB[lym]). Actin is used as a loading control. Note that these results further confirm the activation of both NF-κB and Notch signaling in TriB mice. (B) Genomic PCR analysis of Cre-mediated transgene recombination in converted myeloid leukemia cells (Bswitch) from 2 different mice. TriB genomic DNA was used for detection of transgenes without recombination. Note the deletion of transgene Neo gene after Cre-mediated recombination. (C) Quantitative PCR (qPCR) analysis of Gt(ROSA)26Sor expression in TriB MZPs (MZP) and converted myeloid leukemia cells (Bswitch; n = 3). (D) Chromatin immunoprecipitation (ChIP)–qPCR measurement of histone 3 lysine 27 acetylation (H3K27ac) in the promoter regions of Gt(ROSA)26Sor, Itgam (CD11b), and Cd19 genes in TriB MZPs and converted myeloid cells (Bswitch). (E) ATAC-seq signal coverage across Gt(ROSA)26Sor, Itgam, and Cd19 regions in TriB MZPs (upper) and Bswitch cells (lower) were visualized with Integrated Genomics Viewer. (F) Relative expression of Tet2 and Dnmt1 in TriB MZPs (MZP) and converted myeloid leukemia cells (Bswitch) by qPCR (n = 3). (G) Determination of cell growth in vitro indicating that DNA demethylating drug 5-aza-2′-deoxycytidine (5AZA) suppressed the growth of converted myeloid leukemia cells (n = 3). (H) Flow cytometric analysis of GFP expression in converted myeloid leukemia cells treated with 5AZA (n = 3); representative contour plots comparing untreated cells (dimethyl sulfoxide [DMSO]) with treated cells (left), and recovery of GFP expression upon treatment using 5AZA (right). (I) Expression levels of NIK and Notch2ICN (ICN) before and after drug treatment (5AZA) of converted myeloid leukemia cells (n = 3). Glyceraldehyde-3-phosphate dehydrogenase (GAPDH) is used as a loading control. *P < .05, **P < .01.
Previous studies58,59 have reported decreased Gt(ROSA)26Sor gene expression, promoter accessibility, and activity during B-cell reprogramming (supplemental Figure 5). Although the results were from a B-myeloid conversion system relying on sequential overexpression of CEBPα and Yamanaka factors, we noted that 2 of the Yamanaka factors, KLF4 and MYC,21 were upregulated in TriB MZPs (Figure 6A). We used qPCR to measure the expression of Gt(ROSA)26Sor in Bswitch and TriB MZPs and found it had significantly decreased in the former (Figure 5C). Consistent with that, ChIP-qPCR analysis using an antibody to K27-acetylated histone H3 demonstrated a marked reduction in acetylation at the Gt(ROSA)26sor promoter in Bswitch cells relative to MZPs, likely rendering the promoter in the former largely inactive (Figure 5D left). ChIP-qPCR additionally revealed higher and lower acetylation levels at the Itgam (coding CD11b) promoter (center) and Cd19 promoter (right), respectively, in Bswitch compared with TriB MZP cells. This agreed with the phenotypic switch of converting B cells. The relatively high level of acetylation at Itgam in TriB MZPs (which do not express CD11b) may suggest that the promoter is poised for activation (Figure 5D). In support of these results, ATAC-seq pointed to differential chromatin accessibility at the Cd19 and Itgam loci in Bswitch and TriB MZPs (Figure 5E center and right). However, there was no difference in ATAC signal strength at Gt(ROSA)26sor (Figure 5E left), possibly indicating a configuration in the case of Bswitch cells that allows some transcription factors to bind to the open-configuration Gt(ROSA)26sor promoter, yet somehow keeps the promoter in the inactive state (eg, may not be able to recruit key chromatin modifiers, such as histone acetyltransferase, during B-myeloid conversion).
![Coactivation of NF-κB and Notch signaling downregulates lymphoma and myeloid gene suppressor Bach2 and upregulates genes regulating stemness in MZPs. (A) RNA-seq analyses (n = 2 biological replicates for each genotype) of flow-sorted MZPs from control (Con), TriB, or NIK mice, MZBs from Notch mice, and transformed lymphoma cells (TriB[lym]). Heatmaps were generated from selected genes of interest. (B) GSEA showed gene sets enriched in TriB or Con MZPs. (C-D) Relative expression of Bach2 (C) and Cebpα (D) in Con MZPs (CMZP), TriB MZPs (TMZP), TriB(lym), or converted myeloid leukemia (Bswitch) cells (n = 3). (E) The expression of Bach2 proteins in Con and TriB B cells, TriB(lym), and Bswitch leukemia cells (n = 3). **P < .01. FDR, false-discovery rate.](https://ash.silverchair-cdn.com/ash/content_public/journal/blood/135/2/10.1182_blood.2019001438/2/m_bloodbld2019001438f6.png?Expires=1767734001&Signature=ChXG8EOx2sLl8mHbEk9Mue492ft12hVA1QpRxhrGta2DFoxuJ8kG6tAQTYet0JXlYwpLxJ-exBg~oDiSBY0KwqqGlIcHXxvrwnkQFsVQcMoiF7cvfnFRv2JyrMLyLn6ei5-0a7F~geuiZVzIssxzuJl0M~sdGF0cytfV69BYYYBM2P0x~LKvdYRCUrOwmR34OKKUuklhsx7MLGuH0DWWJk1izjc8MelsOwpRC0zrjNZonFHGBYB0bys5ajkZ6p6tXIIGsI7gsegpTNHXbuvPEnjXfv8Kv5Hl6BEYizpMaid0a-zgmsHsWVHPNC3hkn8UHwr5o4KX89DAohAI2KnOUw__&Key-Pair-Id=APKAIE5G5CRDK6RD3PGA)
Coactivation of NF-κB and Notch signaling downregulates lymphoma and myeloid gene suppressor Bach2 and upregulates genes regulating stemness in MZPs. (A) RNA-seq analyses (n = 2 biological replicates for each genotype) of flow-sorted MZPs from control (Con), TriB, or NIK mice, MZBs from Notch mice, and transformed lymphoma cells (TriB[lym]). Heatmaps were generated from selected genes of interest. (B) GSEA showed gene sets enriched in TriB or Con MZPs. (C-D) Relative expression of Bach2 (C) and Cebpα (D) in Con MZPs (CMZP), TriB MZPs (TMZP), TriB(lym), or converted myeloid leukemia (Bswitch) cells (n = 3). (E) The expression of Bach2 proteins in Con and TriB B cells, TriB(lym), and Bswitch leukemia cells (n = 3). **P < .01. FDR, false-discovery rate.
Coactivation of NF-κB and Notch signaling downregulates lymphoma and myeloid gene suppressor Bach2 and upregulates genes regulating stemness in MZPs. (A) RNA-seq analyses (n = 2 biological replicates for each genotype) of flow-sorted MZPs from control (Con), TriB, or NIK mice, MZBs from Notch mice, and transformed lymphoma cells (TriB[lym]). Heatmaps were generated from selected genes of interest. (B) GSEA showed gene sets enriched in TriB or Con MZPs. (C-D) Relative expression of Bach2 (C) and Cebpα (D) in Con MZPs (CMZP), TriB MZPs (TMZP), TriB(lym), or converted myeloid leukemia (Bswitch) cells (n = 3). (E) The expression of Bach2 proteins in Con and TriB B cells, TriB(lym), and Bswitch leukemia cells (n = 3). **P < .01. FDR, false-discovery rate.
DNA methylation plays an important role in B-cell reprogramming58,60 and B-cell lymphoma–to–myeloid tumor conversion.61 To investigate whether it is also involved in the loss of GFP expression in converted leukemia cells in our new mouse model, we used qPCR to measure the expression of DNMT (Dnmt1, Dnmt3a, and Dnmt3b) and TET (Tet1, Tet2, and Tet3) family members in converted leukemia cells. We found that the expression of Tet2 and Dnmt1 (and Dnmt3b; data not shown) was significantly upregulated (Figure 5F). Because upregulation of DNA methylases such as DNMTs may lead to GFP shutdown effected by DNA hypermethylation, we evaluated whether demethylating drug 5AZA was able to restore GFP expression in converted leukemia cells. Figure 5G-H shows that this was the case, although it took a cytotoxic dose of 1 μM of 5AZA to clearly demonstrate that GFP was reexpressed. However, whether restoration of GFP was due to the DNA demethylating activity of 5AZA as opposed to some other unknown effect of the drug remains to be shown. Just like GFP, NIK and Notch2 proteins were also reexpressed in 5AZA-treated leukemia cells (Figure 5I). Taken together, the results suggest involvement of epigenetic change in the B-myeloid conversion in the TriB model, with DNA hypermethylation playing a critical role in maintaining the malignant myeloid cells.
Coactivation of NF-κB/Notch signaling represses lymphoma and myeloid gene suppressor Bach2
RNA-seq of TriB lymphoma and flow-sorted MZPs from TriB, NIK, and normal mice was used to gain additional insight into neoplastic B-cell development in the TriB model (Figure 6A). Because we could not collect enough MZPs from Notch mice as a result of markedly accelerated differentiation into MZBs, as reported previously,34 we used Notch MZBs for comparison. In addition to the expected pathway activation (Figure 1A), the expression of lymphoma and myeloid gene suppressor Bach2 (BTB domain and CNC homolog 2) and lymphoma promoting genes Ezh2 and Myc was gradually down- and upregulated, respectively, in TriB MZPs or transformed lymphoma cells (Figure 6A).62-70 The upregulation of Ezh2 may regulate acquisition of stemness by epigenetic repression of genes involved in cell fate decisions.71 Interestingly, the expression of Myc and Klf4 (along with other family members Klf2 and Klf6) was synergistically upregulated in TriB MZPs compared with controls, NIK MZPs, and Notch MZBs (Figure 6A). Upregulation of these transcription factors may endow TriB MZP with self-renewal ability. Consistent with gene expression, GSEA revealed an enrichment for stemness genes, genes with high CpG density promoters bearing the histone 3 lysine 27 trimethylation mark in embryonic stem cells, Myc target genes, and multiple myeloma genes, whereas genes involved in lymphocyte maturation were downregulated in TriB MZPs compared with control MZPs (Figure 6B). We further confirmed that Bach2 was downregulated, with no significant changes in the expression of Cebpα in TriB MZPs compared with control MZPs by qPCR (Figure 6C-D) and immunoblotting (Figure 6E). In addition, the expression of Bach2 was reduced in both transformed lymphoma cells and converted leukemia cells (Figure 6C,E).
Bach2 is a downstream target of NF-κB/Notch signaling, and overexpression of Bach2 suppresses the growth of lymphoma cells and B-myeloid conversion
We were specifically interested in Bach2 because it is required for normal germinal center B-cell maturation, functions as a lymphoma suppressor, and, importantly, controls B-myeloid specification by repressing myeloid genes.69,70,72-74 We first asked if Bach2 is a direct target of NF-κB/Notch signaling. There are multiple NF-κB and Notch target (Myc or Heyl) binding sites in the Bach2 promoter region (Figure 7A top). ChIP-PCR analysis demonstrated that NF-κB signaling component RelB and Notch signaling target Myc bind to the Bach2 regulatory region (Figure 7A bottom). To follow up on this, we generated a Bach2 retroviral expression plasmid and tested the impact of Bach2 overexpression on B-myeloid conversion and cell growth of TriB MZPs and transformed lymphoma and converted leukemia cells (Figure 7B). We found that both the growth of TriB MZPs (Figure 7C) and their capability for myeloid conversion (Figure 7D-E) were significantly repressed by Bach2 expression. qPCR analysis showed that overexpression of Bach2 suppressed the expression of myeloid genes Cebpα and Spic; the growth of both transformed lymphoma and converted leukemia cells was also suppressed (Figure 7G-I). Of interest from a clinical point of view, we found that Bach2 protein levels were consistently lower in tumor samples from patients with converted myeloid tumors relative to Bach2 expression in the underlying B lymphoma/leukemia cells, whereas CEBPα protein was upregulated in some but not all samples (supplemental Figure 6). PU.1, however, was consistently upregulated in all converted myeloid tumors, suggesting that upregulation of PU.1 is more common than upregulation of CEBPα during B-myeloid conversion in vivo (supplemental Figure 6). Collectively, these results support the contention that downregulation of Bach2 plays an important role during B-myeloid conversion.

Overexpression of Bach2 suppresses the growth of MZPs, transformed lymphoma and leukemia cells, and B-myeloid conversion. (A) Scheme of 5′ Bach2 locus including exon 1 and the upstream regulatory region. Predicted binding sites of Notch pathway component MYC and NF-κB/RelB are indicated with short colored dashes below the scheme. Column diagrams show ChIP-qPCR data demonstrating binding of Myc and RelB to the Bach2 locus in TriB spleen B cells. (B) Outlines of Bach2 overexpression experiments. (C) Enforced expression of Bach2 inhibits growth of TriB MZPs. Cells were retrovirally transfected with Bach2 expression vector (white column) or empty vector used as control (black), fractionated by flow sorting, and cocultured with OP9 stromal cells in the presence of SCF, Flt3l, interleukin-7 (IL-7), and IL-4 (10 ng/mL each). The experiment was performed in 3 biological replicates. The cell numbers were calculated by total cell numbers × 45.2% (to exclude cocultured stromal cells; data not shown). (D) Experiment was performed as described in panel C, except the MZP/OP9 coculture was supplemented with SCF, Flt3L, and IL-3 (10 ng/mL each). Flow cytometry revealed the Bach2-dependent shift from Mac1+ myeloid cells to CD19+ B cells. (E) Experiment was performed as described in panel C except instead of coculturing in vitro, cells were transferred to lethally irradiated and BM-rescued CD45.1 recipient mice (n = 4). (F) qPCR analysis of Bach2, Cebpα, and Spic expression in TriB MZPs cocultured with OP9 cells. MZPs overexpressing Bach2 (white) are compared with MZPs containing normal levels of Bach2 (vector, black; n = 3). (G) Growth inhibition of flow-sorted TriB lymphoma cells containing elevated levels of Bach2. Cells were retrovirally transduced with Bach2 or empty vector and cocultured with OP9 stromal cells in the presence of SCF, Flt3l, IL-7, and IL-4 (10 ng/mL each). Cell numbers were calculated by multiplying the total cell numbers × CD45.2 percentage (n = 3). (H) Sorted inducible Bach2-transduced converted leukemia cells (Bswitch) were cultured in RPMI with 15% fetal bovine serum (FBS) in the presence of SCF, Flt3L, and IL3 (10 ng/ml each) with or without 4-OHT and cells were counted 3 days later (n = 3). (I) BrdU (3 hours, 10 μM, in vitro) incorporation assay indicating suppressed proliferative activity of Bach2-expressing converted leukemia cells (n = 3). *P < .05, **P < .01.
Overexpression of Bach2 suppresses the growth of MZPs, transformed lymphoma and leukemia cells, and B-myeloid conversion. (A) Scheme of 5′ Bach2 locus including exon 1 and the upstream regulatory region. Predicted binding sites of Notch pathway component MYC and NF-κB/RelB are indicated with short colored dashes below the scheme. Column diagrams show ChIP-qPCR data demonstrating binding of Myc and RelB to the Bach2 locus in TriB spleen B cells. (B) Outlines of Bach2 overexpression experiments. (C) Enforced expression of Bach2 inhibits growth of TriB MZPs. Cells were retrovirally transfected with Bach2 expression vector (white column) or empty vector used as control (black), fractionated by flow sorting, and cocultured with OP9 stromal cells in the presence of SCF, Flt3l, interleukin-7 (IL-7), and IL-4 (10 ng/mL each). The experiment was performed in 3 biological replicates. The cell numbers were calculated by total cell numbers × 45.2% (to exclude cocultured stromal cells; data not shown). (D) Experiment was performed as described in panel C, except the MZP/OP9 coculture was supplemented with SCF, Flt3L, and IL-3 (10 ng/mL each). Flow cytometry revealed the Bach2-dependent shift from Mac1+ myeloid cells to CD19+ B cells. (E) Experiment was performed as described in panel C except instead of coculturing in vitro, cells were transferred to lethally irradiated and BM-rescued CD45.1 recipient mice (n = 4). (F) qPCR analysis of Bach2, Cebpα, and Spic expression in TriB MZPs cocultured with OP9 cells. MZPs overexpressing Bach2 (white) are compared with MZPs containing normal levels of Bach2 (vector, black; n = 3). (G) Growth inhibition of flow-sorted TriB lymphoma cells containing elevated levels of Bach2. Cells were retrovirally transduced with Bach2 or empty vector and cocultured with OP9 stromal cells in the presence of SCF, Flt3l, IL-7, and IL-4 (10 ng/mL each). Cell numbers were calculated by multiplying the total cell numbers × CD45.2 percentage (n = 3). (H) Sorted inducible Bach2-transduced converted leukemia cells (Bswitch) were cultured in RPMI with 15% fetal bovine serum (FBS) in the presence of SCF, Flt3L, and IL3 (10 ng/ml each) with or without 4-OHT and cells were counted 3 days later (n = 3). (I) BrdU (3 hours, 10 μM, in vitro) incorporation assay indicating suppressed proliferative activity of Bach2-expressing converted leukemia cells (n = 3). *P < .05, **P < .01.
Discussion
The main finding of this study is that coactivation of NF-κB/Notch signaling in committed B cells markedly accelerates lymphoma development in mice and endows progenitors that reside in a permissive microenvironment with the potential to convert to myeloid lineage through dedifferentiation. Strain TriB mice exhibiting bipotential tumor development provide a heretofore unavailable model system to investigate malignant B-myeloid conversion in vivo. Because the intracellular domains of Notch1 and Notch2 are functionally equivalent during development and carcinogenesis, and the stabilization of NIK is only 1 option to activate NF-κB signaling, we believe our results reflect the impact of combined activation of NF-κB/Notch signaling in committed B cells in general.33,75,76
Our data show that a small fraction of NF-κB/Notch–coactivated B cells maintained long-term repopulating ability, and we reason that it may be these self-renewing prelymphoma cells or lymphoma-initiating cells, but not the overt lymphoma cells, that have the potential to transform into myeloid neoplasms. Because NF-κB and Notch signaling are coactivated in a variety of human lymphomas, which have the potential to develop myeloid tumors, coactivation of NF-κB/Notch signaling in prelymphoma cells may be a shared underlying mechanism for lymphoma-to–myeloid tumor conversion.
Although experimental evidence suggests transdifferentiation as mechanism of B-myeloid conversion,19,26,56 our data are more consistent with a dedifferentiation process that, perhaps in response to cues from the tissue microenvironment, gives rise to myeloid lineage. This discrepancy with previous studies may be attributable to the different experimental systems and the timing at which cells were analyzed. In vivo B-cell transplantation and analysis of transplanted B cells shortly after transplantation enabled us to capture the transient dedifferentiation process. Even in the previous studies, during transdifferentiation, a small Mac1−CD19− population was observed, which actually supports the existence of a transient dedifferentiation process.60,77 Why do only a few lymphomas/leukemias convert to myeloid tumors? We think that malignant B-myeloid conversion also requires an optimal microenvironment, as supported by our observation that NF-κB/Notch–coactivated B cells transformed to lymphoma de novo but converted to myeloid lineage posttransplantation.
Mechanistically, we found that during lymphoma development, several B-cell receptor or cancer-related signaling pathways were activated, whereas tumor-suppressive signaling pathways (eg, p53) were downregulated (Figure 4I-J). In addition, NF-κB/Notch–induced downregulation of BACH2 seems to be an early event in both lymphomatous transformation and myeloid conversion. In contrast, upregulation of myeloid transcription factor CEBPα may be less critical. It has been reported that B cells exposed to a pulse of CEBPα gain many properties shared with granulocyte/macrophage progenitors through regulation and interaction with KLF4.78 Therefore, even if there was no change in the expression of CEBPα, the upregulation of KLF4 in TriB MZPs may have effects similar to those of CEBPα. BACH2 has been shown to play a critical role in suppression of myeloid genes,73 consistent with our observation that downregulation of BACH2 primes B-myeloid conversion. Importantly, downregulation of BACH2 was confirmed in all 9 clonally related human myeloid tumors that converted from preexisting lymphoma (4 cases shown in supplemental Figure 6). Consistent with this, BACH2 seems to be a myeloid leukemia suppressor because its overexpression inhibits converted AML growth. We also provide some evidence that epigenetic modulations that alter chromatin accessibility, promoter activity, and DNA methylation are involved in B-myeloid conversion. However, additional experiments will be necessary to determine how promoter activity, DNA hypermethylation, and DNMT family members, either directly or indirectly, are involved in B-myeloid conversion. It should be noted that although downregulation of BACH2 triggers B-myeloid conversion, downregulation of BACH2 itself is not sufficient to complete lineage switch. The final outcome depends on the interactions with the microenvironment and epigenetic modulation. The finding that converted malignant myeloid cells are effectively eliminated by DNA demethylating drugs may provide new insights into the treatment of these converted myeloid neoplasms. In addition, targeting Notch and NF-κB pathways (both have been tested in hematological malignancies79-82 ) may not only facilitate lymphoma treatment, but also prevent B-myeloid conversion and, most importantly, eradicate those common progenitor cells.
The RNA sequencing (RNA-seq) and assay for transposase-accessible chromatin using sequencing (ATAC-seq) data have been deposited in the Gene Expression Omnibus database (accession numbers GSE116960 and GSE136408, respectively). Contact the corresponding author (chen-zhao@uiowa.edu) for material request.
The online version of this article contains a data supplement.
The publication costs of this article were defrayed in part by page charge payment. Therefore, and solely to indicate this fact, this article is hereby marked “advertisement” in accordance with 18 USC section 1734.
Acknowledgments
The authors thank Klaus Rajewsky (Max Delbrück Center for Molecular Medicine, Berlin, Germany) for permission to use NIKΔT3flSTOP mice. The authors thank Heath Vignes, Michael Shey, and Justin Fishbaugh (University of Iowa Flow Cytometry Core Facility) for cell sorting, Amanda Kalen (Radiation Core Facility) for mouse irradiation, Linzhi Liu for providing 5AZA, Paul Casella for critical reading of the manuscript, and the Millard and Muriel Jacobs Genetics and Genomics Laboratory at California Institute of Technology for ATAC-seq studies.
This work was supported by a departmental startup fund of the University of Iowa Pathology Department, a University of Iowa and Mayo Clinic Lymphoma Specialized Program of Research Excellence Developmental Research Program Award, the US Department of Veterans Affairs (I01 BX004255) (C.Z.), the National Natural Science Foundation of China (81772468) (Q.D.), and the National Institute of Arthritis and Musculoskeletal and Skin, National Institutes of Health (R01 AR043510) (B.B.).
Authorship
Contribution: Y.X., Q.D, L.F., X.T., and Q.L. performed the experiments and analyzed the data; N.B. analyzed RNA-seq data; J.L.S. analyzed RNA-seq, ATAC-seq, and H3K27 acetylation deposition at ROSA26 promoter during highly efficient C/EBPα-mediated B-cell reprogramming system; L.W. and M.J. analyzed ATAC-seq data; Y.Y., W.W., S.H., E.W., J.Y., M.L., J.K., and A. Bossler assisted with human sample collection and immunohistochemical studies; F.B. and I.A. advised on viral transduction; I.A. provided Notch2-ICNLSL mice; M.M. provided the Bach2 expression vector for subcloning and advised on viral transduction; J.C. and T.W. advised on B-cell staining; A. Bagg, B.B., A.F., H.X., B.D., H.H., and S.J. assisted with data interpretation; and C.Z. conceived and supervised the overall study and wrote the paper.
Conflict-of-interest disclosure: The authors declare no competing financial interests.
Correspondence: Chen Zhao, 25 South Grand Ave, 1163 Medical Laboratories, Iowa City, IA 52242-1181; e-mail: chen-zhao@uiowa.edu.

This feature is available to Subscribers Only
Sign In or Create an Account Close Modal