

Key Points
AML cells are uniquely sensitive to genetic or chemical inhibition of salt-inducible kinase 3 in vitro and in vivo.
A SIK inhibitor YKL-05-099 suppresses MEF2C function and AML in vivo.
Visual Abstract

Abstract
Lineage-defining transcription factors (TFs) are compelling targets for leukemia therapy, yet they are among the most challenging proteins to modulate directly with small molecules. We previously used CRISPR screening to identify a salt-inducible kinase 3 (SIK3) requirement for the growth of acute myeloid leukemia (AML) cell lines that overexpress the lineage TF myocyte enhancer factor (MEF2C). In this context, SIK3 maintains MEF2C function by directly phosphorylating histone deacetylase 4 (HDAC4), a repressive cofactor of MEF2C. In this study, we evaluated whether inhibition of SIK3 with the tool compound YKL-05-099 can suppress MEF2C function and attenuate disease progression in animal models of AML. Genetic targeting of SIK3 or MEF2C selectively suppressed the growth of transformed hematopoietic cells under in vitro and in vivo conditions. Similar phenotypes were obtained when cells were exposed to YKL-05-099, which caused cell-cycle arrest and apoptosis in MEF2C-expressing AML cell lines. An epigenomic analysis revealed that YKL-05-099 rapidly suppressed MEF2C function by altering the phosphorylation state and nuclear localization of HDAC4. Using a gatekeeper allele of SIK3, we found that the antiproliferative effects of YKL-05-099 occurred through on-target inhibition of SIK3 kinase activity. Based on these findings, we treated 2 different mouse models of MLL-AF9 AML with YKL-05-099, which attenuated disease progression in vivo and extended animal survival at well-tolerated doses. These findings validate SIK3 as a therapeutic target in MEF2C-addicted AML and provide a rationale for developing druglike inhibitors of SIK3 for definitive preclinical investigation and for studies in human patients.
Introduction
Acute myeloid leukemia (AML) is a hematopoietic malignancy characterized by an aberrant self-renewal potential of myeloid progenitor cells. This cellular phenotype is imposed by a diverse set of genetic drivers, which often promote leukemogenesis via direct or indirect deregulation of lineage-defining transcription factors (TFs).1-6 Hence, an altered transcriptional program of cell identity underpins that pathogenesis of AML, a process that is known to render leukemia cells hypersensitive to perturbations of lineage TFs when compared with normal hematopoietic cells.6 Although lineage TFs represent an important category of molecular vulnerabilities in AML, this knowledge has yet to achieve clinical significance, because TFs are among the most challenging proteins to target directly with drugs.7,8 For this reason, a major objective in AML research is to identify chemical matter capable of direct or indirect TF modulation.
Myocyte enhancer factor 2C (MEF2C) is a leukemogenic TF that regulates normal cell fate specification programs, including myogenesis, neurogenesis, and hematopoiesis.9 Knockout studies in mice indicate that Mef2c is essential in the normal lymphoid and megakaryocytic lineages, but is largely dispensable for myelopoiesis and for hematopoietic stem cell self-renewal.10-13 Insertional mutagenesis screens performed in mice first revealed a leukemogenic function of MEF2C,14 which was later shown to be overexpressed in a variety of human myeloid and lymphoid cancers in association with poor clinical outcomes.15-21 The MLL-rearranged subtype of leukemia exemplifies a hematopoietic cancer with high MEF2C expression.15 In this disease, mixed-lineage leukemia (MLL) fusion oncoproteins induce an active chromatin state and transcriptional hyperactivation at the MEF2C locus.9,15,16 This results in overexpression of MEF2C, which promotes enhancer-mediated gene activation to promote self-renewal, tissue invasion, and chemotherapy resistance.15,16,20,21 Importantly, it has been shown that MLL fusion AML cells are addicted to continuous MEF2C expression for their growth and viability.15,22 The powerful nature of MEF2C addiction in MLL-rearranged AML has been most convincingly demonstrated in the hypomorphic Mef2cS222A/S222A mouse strain, which lacks any detectable developmental abnormalities, but is entirely resistant to leukemic transformation by the MLL-AF9 oncoprotein.21 Collectively, these genetic experiments validate MEF2C as a vulnerability in AML cells and an attractive target for therapy.
The transcriptional output of MEF2C is dynamically regulated during cell differentiation by several kinase signaling cascades,9 which presents an opportunity for pharmacological MEF2C modulation in cancer. For example, kinases regulate the interaction between MEF2C and the class IIa family of histone deacetylases (HDAC4, HDAC5, HDAC7, and HDAC9),23,24 which bind directly to the MADS box/MEF2 domain of MEF2C, to form a complex on DNA that is incapable of transcriptional activation.25,26 Each class IIa HDAC can be phosphorylated by several different kinases, such as calmodulin-dependent protein kinase (CaMK) and salt-inducible kinases (SIKs), at conserved serine residues to promote their interaction with 14-3-3 proteins, which function to sequester HDAC proteins in the cytoplasm.23,27,28 In addition, MEF2C can be directly phosphorylated by microtubule-associated protein/microtubule affinity-regulating kinase (MARK) at S222 to promote its transcriptional function.21 Through such mechanisms, kinase signaling pathways are able to control MEF2C function in a variety of cellular contexts.23,24,27
We previously applied kinase domain-focused CRISPR screening to human cancer cell lines in search of context-specific dependencies, which revealed a correlation between salt-inducible kinase-3 (SIK3, in a partially redundant manner with SIK2) and MEF2C essentiality in AML.22 Our subsequent mechanistic experiments showed that inactivation of SIK3 induced the formation of HDAC4-MEF2C complexes at distal enhancer elements. This triggered a reduction in vicinal histone lysine acetylation and transcriptional suppression of MEF2C target genes.22 This study demonstrated a mechanistic link between SIK3 and MEF2C in AML and raised the hypothesis that pharmacological targeting of SIK3 may have therapeutic significance in this disease. We tested this hypothesis using the tool compound YKL-05-099, which inhibits the SIK family and has a suitable bioavailability for preclinical studies in mice.29 As described below, our experiments revealed that YKL-05-099 suppresses the transcriptional output of MEF2C and attenuates disease progression in 2 animal models of MLL-rearranged AML at well-tolerated doses.
Materials and methods
Plasmid constructions
The lentiviral single-guide RNA (sgRNA) expression vectors (LRG2.1, Addgene_108098; LRG, Addgene_65656) and the lentiviral Cas9 (LentiV_Cas9_puro, Addgene_108100) or luciferase (Lenti-luciferase-P2A-Neo, Addgene_105621) expression vectors were described previously.22,30 LentiV_Cas9_Blast (Addgene_125592) was derived from LentiV_Cas9_puro by replacing a puromycin resistance gene with a blasticidin resistance gene. LRG2.1_Neo (Addgene_125593) or LRG2.1_Puro (Addgene_125594) was derived from LRG2.1 by inserting a P2A-Neo or a P2A-Puro sequence, respectively, after the GFP sequence. For in vitro knockout experiments, sgRNAs targeting the human or mouse gene were cloned into BsmBI-digested LRG2.1 or LRG, respectively. For in vivo knockout experiments, sgRNAs were cloned into BsmBI-digested LRG2.1_Neo or LRG2.1_Puro. For knockdown, short hairpin RNAs (shRNAs) were cloned into the retroviral expression vector LEPG (Addgene_111160), according to the procedure described previously.31 Sequences of sgRNA and shRNA are provided in supplemental Table 1 (available on the Blood Web site). The mouse Sik3 cDNA purchased from GE Dharmacon (clone ID: 6515742) was cloned into a LentiV Neo vector (Addgene_108101) using the In-Fusion cloning system (Clontech). The gatekeeper mutation (T142Q) was introduced by site-directed mutagenesis.
Cell lines and virus transduction
Human and murine (RN2) AML cells32 were cultured in RPMI supplemented with 10% fetal bovine serum (FBS), except for OCI-AML3 and KASUMI-1, which were cultured in α-MEM with 20% FBS or RPMI with 20% FBS, respectively. MA9-FLT3ITD and MA9-NRASG12D cells were cultured in Iacove’s modified Dulbecco’s medium (IMDM) supplemented with 20% FBS. HEK293T or NIH-3T3 cells were cultured in Dulbecco’s modified Eagle medium (DMEM) with 10% FBS or 10% bovine calf serum, respectively. Plat-E cells were cultured in DMEM with 10% FBS, 1 µg/mL puromycin, and 10 µg/mL blasticidin. Penicillin/streptomycin was added to all media. All cell lines were cultured at 37°C with 5% CO2 and were periodically tested for mycoplasma and confirmed to be negative. Cas9-expressing RN2 (RN2c), NIH-3T3, and MOLM-13 cells have been established.22,33
Lentivirus was produced in HEK293T cells using helper plasmids (VSVG and psPAX2 [Addgene_12260]) with polyethylenimine (PEI 25000). Retrovirus was produced in Plat-E cells by following standard procedures.34 Target cells were spin infected with the virus and 4 µg/mL polybrene. Media were changed at 24 hours after infection, and antibiotics (1-2 µg/mL puromycin, 1 mg/mL G418, or 10 µg/mL blasticidin) were added at 48 hours after infection if selection was needed.
Patient-derived xenograft samples
Primary patient samples were acquired after informed consent, and patient-derived xenografts (PDXs) were established under protocols approved by Dana-Farber Cancer Institute and Cincinnati Children’s Hospital Medical Center Institutional Review Boards. The karyotype and other information of PDXs are provided in supplemental Table 2. Healthy CD34+ umbilical cord blood (UCB) cells were purchased from Lonza. For short-term in vitro culture, UCB and PDX cells were maintained in IMDM containing 20% FBS and supplemented with 10 ng/mL human SCF (300-07; PeproTech), TPO (300-18; PeproTech), FLT3L (300-19; PeproTech), IL3 (200-03; PeproTech), and IL6 (200-06; PeproTech).
Analysis of genetic dependencies and gene expression in DepMap and other data sets
Genetic dependency (CRISPR; Avana) data and RNA expression (CCLE) data from cancer cell lines were extracted from the DepMap Public 19Q1 database (https://depmap.org/portal/).35,36 RNA expression data with genomic information in AML patient samples was extracted from The Cancer Genome Atlas database via cBioPortal (https://www.cbioportal.org/).1,37 Other independent genomic and expression data sets of AML patient samples were extracted from prior reports: Wouters et al,38 GSE14468 from the Gene Expression Omnibus (GEO),39 Tumor Alterations Relevant for Genomics-Driven Therapy (TARGET) AML40 (https://ocg.cancer.gov/programs/target/data-matrix), and the Beat AML Master Trial.2
Competition-based proliferation assay
Cas9-expressing RN2 or NIH-3T3 cells were transduced with sgRNA linked with GFP in an LRG vector. The percentage of GFP+ cells was measured every 2 days with the Guava EasyCyte Flow Cytometer (MilliporeSigma).
Western blot analysis and fractionation
For preparation of whole-cell extracts, cell pellets were suspended in Laemmli sample buffer (Bio-Rad), containing 2-mercaptoethanol, and boiled. The lysates were resolved in sodium-dodecyl sulfate-polyacrylamide gel electrophoresis, followed by transfer to nitrocellulose membrane and immunoblot analysis. Fractionation was performed with an NE-PER Nuclear and Cytoplasmic Extraction Kit (Thermo Fisher Scientific), according to the manufacturer’s protocol. The antibodies used include HSC70 (Sc-7298; Santa Cruz Biotechnology); MEF2C (5030S; Cell Signaling Technology); SIK3 for mouse (HPA045245; MilliporeSigma); SIK3 for human (HPA048161; MilliporeSigma); phospho-HDAC4/5/7 (3442; Cell Signaling Technology); HDAC4 (15164 or 7628; Cell Signaling Technology); lamin B2 (12255; Cell Signaling Technology); actin, (ACTN05; NeoMarkers); and tubulin (T0198; MilliporeSigma).
Preparation of hematopoietic stem and progenitor cells from mice
For western blot analysis, bone marrow cells were harvested from 6- to 8-week-old female C57BL/6 mice (Taconic Biosciences) and lysed with ACK buffer (150 mM NH4Cl, 10 mM KHCO3, and 0.1 mM EDTA). Cells were suspended in fluorescence-activated cell sorting (FACS) buffer and purified with CD117 MicroBeads (Miltenyi Biotec) according to the manufacturer’s protocol. CD117+ cells were cultured for 3 days in IMDM, with 10% FBS supplemented with 100 ng/mL rat stem cell factor, 100 ng/mL TPO, 10 ng/mL mIL-3, and 10 ng/mL mIL-6.
Colony formation assay
For Sik3 knockdown in mouse cells, bone marrow cells were obtained by flushing from the femurs of 7- to 9-week-old female C57BL/6 mice and lysed with ACK buffer. Normal myeloid progenitor cells were cultured in RPMI with 10% FBS, 2 ng/mL rmIL-3, 2 ng/mL rmIL-6, 10 ng/mL recombinant murine (rm) stem cell factor and 50 µM 2-mercaptoethanol. RN2 and normal myeloid progenitor cells were retrovirally transduced with shRNA in an LEPG vector. On day 2 after infection, 2500 shRNA/GFP+ RN2 cells or 10 000 shRNA/GFP+ normal myeloid progenitor cells were plated into methylcellulose-based medium, without or with cytokines, respectively (MethoCult M3234 or MethoCult GF M3434; Stemcell Technologies). Cells were cultured in the medium containing 2 µg/mL puromycin to select shRNA+ cells. Blastlike (poorly differentiated) colonies were counted on day 7 after infection (day 5 after plating).
For human cells, 2500 CD34+ UCB cells, 500 cells of AML cell lines, or 5000 to 50 000 cells of PDX samples were plated in triplicate in methylcellulose (MethoCult Express; Stemcell Technologies) with dimethyl sulfoxide (DMSO) or 1 µM YKL-05-099. Myeloid colonies were scored at day 10 after plating.
SIK inhibitor treatment
The chemical derivation and characterization of YKL-05-099 from the parental HG-9-91-01 compound has been reported29 (supplemental Figure 3A). In brief, the fused core structure was changed from the pseudobicyclic ring of 4,6-diaminopyrimidine to 6,6-bicyclic pyrimidopyrimidinone, and several side chains were substituted to improve the microsomal stability of the compound. Methoxy substitution at the ortho position of the 2-anilino substituent improved kinase selectivity and reduced toxicity, while the replacement of methylpiperazine with methylpiperidine at the terminus of the aniline tail further increased microsomal stability.
For 50% effective concentration (EC50) calculations, 1000 cells were plated in an opaque-walled, 96-well plate and mixed with serially diluted concentrations of YKL-05-099 or 0.1% DMSO as the control. The number of viable cells was measured after 72-hour incubation, using a CellTiter Glo Luminescent Cell Viability Assay kit (Promega) with a SpectraMax plate reader (Molecular Devices), according to the manufacturer’s protocol. Data were analyzed with GraphPad Prism software. For western blot analysis, cells were harvested after YKL-05-099 treatment at various concentrations and time points.
The combination effect is additive if the Bliss score equals 0, whereas the combination effect is synergistic if the Bliss score is positive.
Cell cycle and apoptosis analysis
Cell cycle analysis was performed with Vybrant DyeCycle Violet Stain (Thermo Fisher Scientific). Cells were incubated with the DNA dye at 37°C for 2 hours and analyzed with a BD LSRFortessa flow cytometer (BD Biosciences) with FlowJo software (TreeStar). Apoptosis was analyzed by flow cytometry with an APC Annexin V Apoptosis Detection Kit (BioLegend), according to the manufacturer’s protocol.
Leukemia transplantation and in vivo experiments
Animal procedures and studies were conducted in accordance with the institutional animal care and use committees at Cold Spring Harbor Laboratory and Dana-Farber Cancer Institute. For knockout experiments in murine AML cells in vivo, Cas9-expressing RN2 cells were infected with sgRNA in LRG2.1_Neo vector. sgRNA+ cells were selected for 2 days by addition of G418, and 400 000 cells were transplanted into sublethally irradiated (5.5 Gy) 8-week-old female C57BL/6 mice by tail vein injection on day 3 after infection. For knockout experiments in human AML cells in vivo, MV4-11 cells were transduced with luciferase and Cas9 (Blast) expression vectors, and then infected with sgRNA in LRG2.1_Puro vector. sgRNA+ cells were selected for 3 days by the addition of puromycin, and 500 000 cells were transplanted into sublethally irradiated (2.5 Gy), 8-week-old female NSG mice (Jackson Laboratory) by tail vein injection on day 5 after infection. AML development was monitored by biofluorescence imaging with an IVIS Spectrum system (Caliper Life Sciences). Images were taken 10 minutes after intraperitoneal injection of d-luciferin (50 mg/kg).
For SIK inhibitor treatment in murine AML model, 500 000 RN2 cells were transplanted into sublethally irradiated (5.5 Gy) 8-week-old female C57BL/6 mice by tail vein injection. Six mg/kg YKL-05-099 or vehicle (PBS+25 mM HCl) was administrated via intraperitoneal injection once daily from day 1 after transplantation for 3 weeks, and AML development was monitored by imaging, as described above. To test the effect of YKL-05-099 on leukemia-initiating cells, RN2 cells were pretreated with 500 nM YKL-05-099 or DMSO for 3 days in vitro, and then 500 000 or 100 000 cells were transplanted into the C57BL/6 mice, as described above.
In the PDX model, 400 000 or 1 000 000 AML PDX cells were transplanted into 7-week-old female NSGS mice (Jackson Laboratory) for monitoring leukemia expansion or the survival curve, respectively. YKL-05-099 was administrated by intraperitoneal injection once daily at the indicated dosage from day 7 after transplantation. The leukemia burden in bone marrow was evaluated by human CD45 flow cytometry analysis 24 hours after the last dose of a 2-week treatment of YKL-05-099. Cells from mouse tissues were incubated with nonspecific binding blocker (anti-mouse/human CD16/CD32 Fcγ receptor; BD Biosciences) before staining for V450-human CD45 (560368; BD Biosciences) and then were subjected to flow cytometry analysis.
To evaluate the long-term toxicities of YKL-05-099 in vivo, 8-week-old female C57BL/6 mice were treated with vehicle (PBS+25 mM HCl) or YKL-05-099 at 18 mg/kg via intraperitoneal injection, once daily for 28 days, and mouse tissues were collected at 2 hours after the last treatment. Complete blood count analysis was obtained from submandibular vein bleed samples by using a HemaVet 950FS (Drew Scientific). Serum collected via cardiac puncture was subjected to basic chemistry analysis by the Superchem service provided by Antech Diagnostics (Weymouth, MA). For histological analysis, tissues were fixed in 10% formalin, sectioned, and stained with hematoxylin and eosin (performed by Applied Pathology Systems; Shrewsbury, MA). Images were obtained with the Olympus BX41 microscope and Idea 5Mp color camera (SPOT). Lineage composition of peripheral blood and bone marrow samples were analyzed by flow cytometry using the following antibody cocktail (all from BioLegend, unless otherwise noted): BV510-CD19 (6D5) and BV510-B220 (RA3-6B2) for B cells; APC-CD11b (M1/70) and APC-Gr-1 (RB6-8C5) for myeloid cells; and BV421-CD4 (RM4-5), BV421-CD8a (53-6.7), and BV421-CD3 (17A2) for T cells. For Lin−Sca1+Kit+ (LSK) analysis, the antibodies used were APC-CD117 (2B8), BV510-Sca1 (D7), and eFluor-450-ineage cocktail (88-7772-72; eBioscience). The dead cells were excluded by 7-amino-actinomycin D staining (420404; BioLegend). The cellularity per femur was determined by Countess II FL Automated Cell Counter (Thermo Fisher Scientific).
ChIP-qPCR and ChIP-seq analysis
Chromatin immunoprecipitation (ChIP) analysis was performed, essentially as previously described.22 In brief, MOLM-13 cells were treated with 250 nM YKL-05-099 or 0.1% DMSO for 2 hours and cross-linked with 1% formaldehyde for 10 minutes at room temperature. Nuclear lysates were prepared by sonication (Bioruptor; Diagenode), low amplitude (On 30 seconds, Off 30 seconds, for 10 cycles), and centrifugation. Supernatants were incubated with H3K27ac (ab4729; Abcam) or HDAC4 (15164; Cell Signaling Technology) antibody with protein A magnetic beads (Dynabeads; Thermo Fisher Scientific) overnight for immunoprecipitation. The beads were extensively washed, and DNA was purified with a QIAquick Polymerase Chain Reaction (PCR) Purification Kit (Qiagen) after RNase and proteinase K treatment. ChIP-quantitative PCR (qPCR) analysis was performed at previously described binding sites of MEF2C-bound enhancers from our prior study.22 Primer sequences are provided in supplemental Table 1. Signals were quantified using Power SYBR Green PCR Master Mix (Thermo Fisher Scientific) with a QuantStudio 6 Flex Real-Time PCR System (Thermo Fisher Scientific). ChIP-sequence (ChIP-seq) libraries were prepared by using a TruSeq ChIP Sample prep kit (Illumina), according to the manufacturer’s protocol and were analyzed by 75-bp single-end sequencing using NextSeq (Illumina). H3K27ac ChIP-seq upon SIK3 knockout and MEF2C ChIP-seq data in MOLM-13 cells were obtained from the previous work (GEO: accession number GSE109492).22
Bowtie2 and MACS2 were used for mapping of sequencing reads onto the reference human genome hg19 and peak calling.42,43 In MACS2, a false discovery rate cutoff of 5% with the broad peak and narrow peak option was set for H3K27ac and MEF2C, respectively. BEDtools were used to merge the H3K27ac peaks in SIK3 knockout and SIK inhibitor (YKL-05-099) treatment experiments with corresponding control ChIP-seq.44 The Bamliquidator package (https://github.com/BradnerLab/pipeline) was used for calculation of normalized tag counts. H3K27ac loci were considered to be decreased when log2-fold change of peak intensity was <−1, upon knockout or treatment. The TRAP Web tool (http://trap.molgen.mpg.de/cgi-bin/home.cgi) was used for analysis of transcription factor binding motifs within 500 bp around the center of the decreased H3K27ac regions.45 The University of California Santa Cruz genome browser was used to generate ChIP-seq tracks.46 A metagene plot and heat map density plots were generated using ±5 kb around each center of the decreased H3K27ac peaks or the same number of random H3K27ac peaks with 50-bp binning size.
Reverse transcriptase-qPCR analysis of gene expression
MOLM-13 cells were harvested after treatment with DMSO or 250 nM YKL-05-099 for 2 hours. Total RNA was prepared with TRIzol, according to the manufacturer’s protocol. After DNase I treatment, RNA was reverse transcribed, using qScript cDNA SuperMix (Quanta Bio). PDX cells were treated with DMSO or 1 µM YKL-05-099 for 6 hours, RNA was extracted by using the RNeasy Mini Kit (Qiagen), and cDNA was generated with iScript Reverse Transcription Supermix (Bio-Rad). Relative gene expression was measured by Power SYBR Green PCR Master Mix with a QuantStudio 6 Flex Real-Time PCR System and was calculated by the ΔΔCt method, normalized to 18s rRNA. Primer sequences are provided in supplemental Table 1.
RNA-seq and data analysis
RNA-seq analysis was performed as previously described, with some modifications.22 In brief, cells were harvested after treatment of the indicated concentration of YKL-05-099 for 2 hours in MOLM-13 and RN2 cells or on 2 days after infection of sgRNA for gene knockout in RN2 cells. The RNA-seq library was prepared using 2 µg total RNA with a TruSeq Sample Prep Kit v2 (Illumina), according to the manufacturer’s protocol, and analyzed by 75-bp single-end sequencing with NextSeq (Illumina).
HISAT2 was used to map sequencing reads to the reference human (hg19) or mouse (mm10) genome.47 FeatureCounts was used to count the reads assigned to protein-coding genes.48 DESeq2 was used for comparison of gene expressions.49 Custom gene signatures for Gene Set Enrichment Analysis (GSEA) were prepared from the top 200 downregulated genes upon gene knockout or YKL-05-099 treatment. Gene signatures for SIK3 or MEF2C knockout in MOLM-13 were obtained from a previous work (GEO: accession number GSE109491).22 The leukemia stem cell (LSC) gene expression signature was extracted from a prior study.50 GSEA was performed with custom signatures.51 All gene signatures used for GSEA analysis are included in supplemental Table 3.
Results
SIK3 and MEF2C are selectively essential for the growth of AML and multiple myeloma cells
To complement our prior mechanistic characterization of the SIK3-MEF2C codependency in AML22 (supplemental Figure 1A), we explored the therapeutic significance of SIK3 with an expanded genetic and pharmacological evaluation of this target. Because our prior CRISPR screens were limited to 26 cancer cell lines, we began by examining the essentiality of SIK3 in a larger collection of cancer contexts, by using recently published genome-wide CRISPR screening data sets.35 Across more than 500 lines representing 28 different cancer cell lineages, we found that SIK3 was exclusively essential in AML and multiple myeloma contexts (Figure 1A; supplemental Figure 1B). Importantly, this pattern resembled that of MEF2C, which was also selectively essential in these 2 cancer subtypes (Figure 1A; supplemental Figure 1C). A correlation between SIK3 and MEF2C essentiality in AML was observed in these data sets (Figure 1B) and also in an independent set of CRISPR screens performed by Wang et al52 (Figure 1C). The pattern of SIK3 essentiality is distinct from other kinases, such as CDK1, which lacks specificity for any particular tumor subtype (supplemental Figure 1B). Notably, multiple myeloma and AML cell lines express the highest levels of MEF2C and SIK3 when compared with other cancer cell lines36 (supplemental Figure 1D). In an analysis of 162 genomically characterized human AML samples in The Cancer Genome Atlas,1 we found that MEF2C expression correlated with the presence of MLL (11q23) translocations, KRAS mutations, and RUNX1 mutations (supplemental Figure 1E). High MEF2C expression was also associated with MLL rearrangements in other independent AML genome studies (supplemental Figure 1F-H).2,38,40 Together, these findings suggest that SIK3 and MEF2C are not general requirements for cell proliferation, but their essentiality is highly specific to the hematological malignancies AML and multiple myeloma.

SIK3 and MEF2C are selectively essential for the growth of AML and multiple myeloma cells. (A) SIK3 and MEF2C essentiality scores extracted from the DepMap database of cancer cell lines.35 Shown is a boxplot distribution of the copy number–adjusted essentiality score (CERES; a normalized metric of gene essentiality) of SIK3 and MEF2C across all 558 cell lines, 16 AML lines, 18 multiple myeloma lines, and 498 solid tumor cell lines. (B-C) Scatterplots of SIK3 and MEF2C essentiality scores in human AML cell lines in the DepMap (CERES) or from Wang et al52 (CRISPR scores). (D) Western blot analysis of MEF2C in RN2 and 3T3 whole-cell lysates. (E) Competition-based proliferation assays in which cells were infected with the indicated sgRNAs linked to GFP. Bar graphs represent the mean ± standard error of the mean (SEM; n = 3). (F) Bright-field images of methylcellulose-based colony-formation assays of normal myeloid progenitors or RN2 cells on day 7 after retroviral transduction with control or Sik3 shRNAs. (G) Quantification of the immature/blast colonies shown in panel F. Mean ± SEM (n = 4). (H) Western blot analysis of SIK3 performed on day 6 after infection of the indicated shRNAs. (I) Bioluminescence imaging of wild-type C57BL/6 mice receiving transplants of Cas9-expressing RN2 cells transduced with the indicated sgRNA. Representative images are shown on the indicated day after transplantation. (J) Quantification of bioluminescence from panel I. Values represent photons per second (p/s) of bioluminescent signal detection (mean ± SEM). The P value was calculated by unpaired Student t test (n = 5). (K) Survival curves of the mice in panel I. The P value was calculated by log-rank (Mantel-Cox) test (n = 5). (L) Bioluminescence imaging of NSG (NOD-SCID/IL2Rgammanull) mice which received transplants of Cas9-expressing MV4-11 cells transduced with the indicated sgRNA. Representative images are shown on the indicated day after transplantation. (M) Quantification of bioluminescence from panel L. Values represent photons per second (p/s) of bioluminescent signal detection (mean ± SEM). The P value was calculated by unpaired Student t test (n = 5). (N) Survival curves of the mice in panel L. The P value was calculated by log-rank (Mantel-Cox) test (n = 5). sgNeg1, sgNeg2, shREN: negative controls. sgRpa3: positive control.
To further validate the specificity of SIK3 and MEF2C as dependencies in AML, we inactivated each gene in immortalized 3T3 murine fibroblasts and in the murine AML cell line RN2, which was generated by expressing the MLL-AF9 and NrasG12D oncogenes in hematopoietic stem and progenitor cells.32 As expected, RN2 cells expressed higher levels of MEF2C than 3T3 cells (Figure 1D). Using CRISPR-Cas9 genome editing and competition-based assays of cellular fitness, we found that inactivating Sik3 or Mef2c elicited a severe growth arrest in RN2 cells, whereas the same manipulation had no detectable impact on the growth of 3T3 cells (Figure 1E; supplemental Figure 2A). We further compared the specificity of Sik3 dependence by using shRNAs to acutely deplete Sik3 in RN2 and in bone marrow–derived myeloid progenitor cells. After plating the cells in methylcellulose, we observed a stronger reduction of myeloid colony formation upon knockdown of Sik3 in RN2 than in normal myeloid cells (Figure 1F-H). These findings are in agreement with the prior characterization of Sik3 and Mef2c knockout mice, which lack a defect in normal myelopoiesis.12,53 These findings also corroborate our prior analysis of human AML cell lines22 and suggest an enhanced dependence on SIK3 and MEF2C in MLL-rearranged leukemia relative to normal myeloid cells.
We next investigated whether SIK3-deficient AML cells exhibit a growth defect under in vivo conditions. To this end, control and Sik3 knockout RN2 cells were injected via tail vein into sublethally irradiated C57BL/6 mice. AML progression was monitored using bioluminescence imaging of luciferase, which is constitutively expressed from a retroviral promoter in RN2 cells32 (supplemental Figure 2B-C). Notably, these experiments revealed that inactivation of Sik3 led to a marked attenuation of AML progression and extended animal survival (Figure 1I-K). Similar results were obtained upon transplantation of SIK3-knockout MV4-11 cells (a human MLL-AF4 AML line) into immune-deficient NSG mice (Figure 1L-N; supplemental Figure 2D-E). These findings demonstrate that SIK3 is essential for the expansion of MLL-fusion AML cells under both in vitro and in vivo conditions.
YKL-05-099 inhibits the growth of MLL-rearranged leukemia cells by modulating SIK3-mediated regulation of HDAC4
The specificity and in vivo relevance of SIK3 essentiality in AML led us to investigate pharmacological approaches to inhibit SIK3 as a therapeutic strategy. The tool compound HG-9-91-01 is a widely used pan-SIK inhibitor for tissue culture studies,54 which we previously used to validate SIK3 as a dependency in AML.22 However, HG-9-91-01 is rapidly degraded in liver microsomes and is not suitable for in vivo studies.29 To overcome this issue, we recently developed YKL-05-099, which has improved pharmacokinetic properties relative to HG-9-91-01 (Figure 2A; supplemental Figure 3A).29,55 Using comparative kinome profiling, we have found that YKL-05-099 also has improved selectivity for SIKs over other kinases and a modest decrease in potency relative to HG-9-91-01.29

YKL-05-099 inhibits the growth of MLL-rearranged leukemia cells by modulating SIK3-mediated regulation of HDAC4. (A) Chemical structure of YKL-05-099. (B) Relative growth of the indicated cells using CellTiter-Glo assays. Normalized relative luminescence units (RLU) are shown after 3 days in culture with DMSO (0.1%) or YKL-5-099 at the indicated concentrations. The mean ± standard error of the mean (SEM; n = 3) and 4-parameter dose-response curves are plotted. (C) Scatterplot of SIK2/SIK3 essentiality CRISPR scores from our prior study22 and YKL-05-099 EC50 in the indicated AML cell lines. The CRISPR scores were calculated in cells cotransduced with SIK2 and SIK3 sgRNAs and cell fitness tracked in competition-based assays. (D) Western blot analysis of MEF2C in the indicated AML cell lines. (E) Flow cytometry analyses of DNA content to infer cell cycle status after 24-hour treatment with 1 µM YKL-05-099 or DMSO. (F) Flow cytometry analyses of side scatter (SSC) and annexin-V staining (a preapoptotic cell marker) after 24-hour treatment with 1 µM YKL-05-099 or DMSO. (G) Relative growth of RN2 cells transduced with empty vector, Sik3, or Sik3T142Q cDNA, after YKL-05-099 treatment. Normalized relative luminescence units (RLU) are shown after 3 days of culture with DMSO (0.1%) or YKL-05-099 at the indicated concentrations. The mean ± SEM (n = 3) and 4-parameter dose-response curves are plotted. (H) Bright-field images of methylcellulose-based colony formation assays of UCB cells, AML cell lines, and PDX models with DMSO or 1 µM YKL-05-099 on day 10 after plating. Scale bar, 500 µm. (I) Quantification of the myeloid colonies shown in panel H. Mean ± standard deviation (n = 3). (J) Western blot analysis in MOLM-14 and MV4-11 cells treated with 1 µM YKL-05-099 or DMSO for 6 hours. (K) Western blot analysis in RN2 cells transduced with empty vector, Sik3, or Sik3T142Q cDNA, following treatment with DMSO (0.1%) or 350 nM YKL-05-099 for 2 hours. (L) Accumulated number of Cas9-expressing RN2 cells transduced with the indicated sgRNAs upon treatment with DMSO (0.1%) or 350 nM YKL-05-099. An average of 3 independent experiments is shown. sgNeg1: negative control.
Using a 12-point compound titration and CellTiter-Glo proliferation assays, we found that the growth of AML cell lines was inhibited by YKL-05-099 (eg, with an EC50 of 240 nM in MOLM-13 cells) in a manner that overlapped with the overall sensitivity to MEF2C and SIK2/SIK3 knockout22 (Figure 2B-C; supplemental Figure 3B). In addition, western blot analysis showed that AML cells with high MEF2C protein expression tended to be more sensitive to YKL-05-099 (Figure 2D). Notably, 2 of the human AML lines most sensitive to YKL-05-099 (MOLM-13 and MV4-11) both contain an MLL rearrangement and an FLT3-ITD allele. However, results of experiments using genetically engineered human AML cell lines suggest that the presence of an FLT3-ITD does not have a strong effect in conferring sensitivity to YKL-05-099 (supplemental Figure 3C). In addition, the hypersensitivity of KASUMI-1 cells may be attributable to an off-target effect of YKL-05-099 on KIT (supplemental Figure 3D), which is activated by a mutation in this cell line context.29,56 Nevertheless, these findings suggest that human AML cell lines with MLL rearrangements are sensitive to YKL-05-099.
Flow cytometry analysis revealed that YKL-05-099 treatment led to a G1/G0 cell cycle arrest and the induction of apoptosis in MLL-rearranged human AML cell lines (Figure 2E-F). Because YKL-05-099 inhibits several cancer-relevant kinases in addition to SIKs (eg, SRC and ABL) (supplemental Figure 3D),29 we also pursued genetic confirmation that YKL-05-099–induced growth arrest occurs via an on-target inhibition of SIK3. For this purpose, we made use of a gatekeeper mutant SIK3T142Q, which has been shown previously to render this kinase resistant to chemical inhibition.22 Importantly, lentiviral expression of SIK3T142Q, but not wild-type SIK3, alleviated the sensitivity to YKL-05-099–mediated growth arrest in both RN2 and MOLM-13 cell contexts (Figure 2G; supplemental Figure 3E). This rescue experiment indicates that on-target SIK3 inhibition contributes to the growth arrest caused by YKL-05-099 in AML.
We next compared the relative sensitivity of normal human hematopoietic cells and AML cells to YKL-05-099 using methylcellulose-based colony formation assays. Whereas exposing umbilical cord-derived human CD34+ hematopoietic stem and progenitor cells to 1 µM YKL-05-099 led to minimal effects on colony formation, we found that colony-forming abilities of human AML cell lines and cells derived from 2 different PDX models of MLL-rearranged AML were significantly suppressed (Figure 2H-I). Importantly, we observed a significantly higher expression of MEF2C, HDAC4, and SIK3 in mouse and human AML cells when compared with hematopoietic stem and progenitor cells, which is likely to account for the hypersensitivity of leukemia cells to chemical SIK inhibition (supplemental Figure 3F). These findings are also consistent with the linking of SIK3 dependence with MLL fusion oncoprotein-mediated activation of MEF2C expression.15
We previously showed that the critical substrate of SIK3 in supporting AML growth is HDAC4,22 which is sequestered in the cytoplasm by SIK3-mediated phosphorylation27 (supplemental Figure 1A). Based on these prior observations, we examined whether the YKL-05-099 compound would also modulate HDAC4 function in AML. Western blot analysis revealed that YKL-05-099 treatment led to rapid dephosphorylation and nuclear accumulation of HDAC4 in AML cells (Figure 2J; supplemental Figure 3G). Importantly, HDAC4 dephosphorylation occurred via inhibition of SIK3, given that lentiviral expression of the SIK3T142Q cDNA rescued this effect (Figure 2K). We next used CRISPR-Cas9 to inactivate HDAC4 in RN2 and MOLM-13 cells (supplemental Figure 3H). Although the knockout of HDAC4 did not influence the growth rate of these lines, the lack of HDAC4 rendered both AML contexts resistant to YKL-05-099–mediated growth arrest (Figure 2L; supplemental Figure 3I). These experiments lend further support that YKL-05-099 causes growth arrest in MLL-rearranged leukemia cells by releasing HDAC4 from SIK3-mediated sequestration.
It has been shown that MEF2C can promote chemotherapy resistance in AML,21 and that finding led us to investigate the sensitivity of MOLM-13 cells to combinations of YKL-05-099 with daunorubicin or cytarabine (supplemental Figure 4). Consistent with prior work, Bliss-independence modeling41 of CellTiter-Glo proliferation measurements revealed a modest synergy of YKL-05-099 with cytarabine at low compound concentrations. In contrast, the growth-arrest phenotype incurred by combining YKL-05-099 with daunorubicin was simply additive.
YKL-05-099 interferes with MEF2C-dependent transcriptional activation
Our prior epigenomic analysis of MOLM-13 cells revealed that SIK3 knockout led to the selective loss of histone acetylation at enhancer elements occupied by MEF2C and a reduced mRNA level of MEF2C target genes.22 To complete our drug mechanism-of-action study, we investigated whether YKL-05-099 treatment would also lead to similar changes in acetylation and transcription. To this end, we performed ChIP of histone H3 lysine 27 acetylation (H3K27ac, a mark of active promoters and enhancers) and deep sequencing (ChIP-seq) after a 2-hour treatment of MOLM-13 cells with 250 nM YKL-05-099 or with vehicle control. By comparing these 2 acetylation landscapes, we found that H3K27ac was reduced at select genomic sites (Figure 3A-B). Importantly, YKL-05-099–induced losses of H3K27ac correlated with acetylation changes observed after SIK3 knockout (Figure 3B). These changes were also prevented by SIK3T142Q expression, suggesting they occurred via on-target SIK3 inhibition (Figure 3C). Of note, a genetic knockout of SIK3 tended to have a stronger effect on H3K27ac enrichment than YKL-05-099 treatment (Figure 3B). In addition, a sequence analysis of these genomic intervals revealed an enrichment of MEF2C motifs at these locations (Figure 3D). Moreover, MEF2C occupancy was found in 95% of the cis-elements with reduced H3K27ac after YKL-05-099 exposure22 (Figure 3A,E-F). Finally, a ChIP-qPCR analysis verified that YKL-05-099 treatment led to the association of HDAC4 with MEF2C-occupied enhancer elements (supplemental Figure 5A).
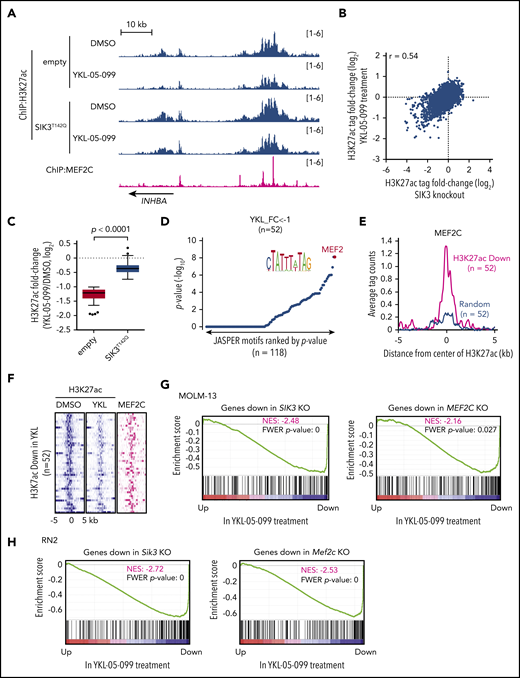
YKL-05-099 interferes with MEF2C-dependent transcriptional activation. (A) ChIP-seq profiles of H3K27ac and MEF2C at the indicated genomic loci, chosen because H3K27ac is decreased in MOLM-13 cells by YKL-05-099 treatment. For H3K27ac ChIP-seq, cells were harvested after 2-hour treatment with DMSO (0.1%) or 250 nM YKL-05-099. (B) Scatterplot of H3K27ac fold-change after SIK3 knockout or YKL-05-099 treatment at 16 437 genomic sites of H3K27ac enrichment. (C) Box plots of fold change of downregulated H3K27ac signals in MOLM-13 cells treated with DMSO or 250 nM YKL-05-099 for 2 hours. MOLM-13 cells express either an empty vector or SIK3T142Q cDNA. (D) TRAP motif enrichment analysis of DNA sequences with decreased H3K27ac after YKL-05-099 treatment. (E) A meta profile of MEF2C occupancy at the genomic regions exhibiting H3K27ac log2-fold change of <−1 after YKL-05-099 treatment vs a randomly chosen set of H3K27ac-enriched sites. (F) ChIP-seq density plot at regions with decreased H3K27ac after YKL-05-099 treatment. Enhancers are ranked by fold change of H3K27ac after treatment. (G) GSEA, which evaluates how treating MOLM-13 cells with YKL-05-099 (250 nM, 2 hours) influences previously defined gene signatures that were suppressed after SIK3 or MEF2C knockout in this cell type.22 Normalized enrichment score (NES) and family-wise error rate (FWER) P value are shown. (H) GSEA that evaluates how treating RN2 cells with YKL-05-099 (250 nM, 2 hours) influences gene signatures that are suppressed after Sik3 or Mef2c knockout in this cell type. NES and FWER P value are shown.
We also performed RNA-seq analysis of MOLM-013 cells after a 2-hour exposure to YKL-05-099 and compared the results with our prior RNA-seq analysis of SIK3 or MEF2C knockout in this same cellular context.22 Using GSEA,51 we found that YKL-05-099 treatment rapidly suppressed a similar transcriptional program, as observed after genetic targeting of SIK3 or MEF2C (Figure 3G). Reverse transcriptase-qPCR analysis confirmed that YKL-05-099 suppressed MEF2C target genes in both human AML cell lines and in cells derived from AML PDX models (supplemental Figure 5B-C). To further corroborate this finding, we performed a similar RNA-seq evaluation in the RN2 cell line after Sik3 knockout, Mef2c knockout, and YKL-05-099 exposure. These experiments revealed a significant overlap of transcriptional changes after all 3 perturbations (Figure 3H). Consistent with a role for MEF2C in regulating self-renewal pathways in AML, we found that a transcriptional signature of LSCs50 was suppressed by Sik3 knockout and by YKL-05-099 exposure (supplemental Figure 6A-B). However, genetic or pharmacological targeting of SIK3 did not lead to a pronounced differentiation phenotype in human AML cells (data not shown). In vitro treatment of RN2 cells with YKL-05-099 also did not suppress leukemia-initiating cell frequency, which suggests that this compound blocks cell growth and viability in a manner that is independent of the lineage hierarchy of this disease (supplemental Figure 6C-E). In fact, this experiment suggests that in vitro YKL-05-099 treatment selects for drug-tolerant cells with a survival advantage in vivo. Nevertheless, these epigenomic results lend strong support to the premise that on-target SIK3 inhibition occurs via YKL-05-099 treatment and validates the use of this compound as a pharmacological strategy to suppress the transcriptional output of MEF2C in AML.
YKL-05-099 treatment extends survival in 2 mouse models of MLL-AF9 AML at well-tolerated doses
Having demonstrated that YKL-05-099 interferes with the SIK3-HDAC4-MEF2C signaling axis in vitro, we next evaluated the therapeutic potential of this agent in animal models of MLL-rearranged AML. In a prior study, we showed that intraperitoneal administration of YKL-05-099 at doses between 5 and 50 mg/kg achieved effective SIK inhibition in splenic leukocytes,29 which provided a dosing range for our studies in AML mouse models. We first transplanted RN2 cells into sublethally irradiated C57BL/6 mice, followed by daily intraperitoneal administration of 6 mg/kg YKL-05-099, starting on day 1 after transplantation (Figure 4A; supplemental Figure 7A). Bioluminescence imaging of luciferase revealed a significant delay in AML progression, which was associated with a survival benefit in the YKL-05-099 treated cohort (P = .0027; Figure 4A-C). In an independent cohort of mice receiving RN2 transplants, initiation of YKL-05-099 treatment on day 5 after transplantation (6 mg/kg twice daily) was associated with a statistically significant, albeit modest, effect in attenuating AML progression (Figure 4D). Taken together, these findings provide evidence that YKL-05-099 treatment can attenuate AML progression and extend survival in vivo.
![YKL-05-099 treatment extends survival in 2 mouse models of MLL-AF9 AML. (A) Survival curves of C57BL/6 mice transplanted with RN2 cells, followed by intraperitoneal injection of 6 mg/kg YKL-05-099 treatment once daily from day 1 after transplantation. The P value was calculated by log-rank (Mantel-Cox) test (n = 4 or 5). (B) Representative bioluminescence imaging of mice on the indicated days after transplantation. (C) Quantification of the signal in panel B. Values represent photons per second (p/s) of bioluminescent signal detection (mean ± standard error of the mean [SEM]). The P value was calculated by unpaired Student t test (n = 4 or 5). (D) Bioluminescence imaging of wild-type C57BL/6 mice that received RN2 cell transplants. YKL-05-099 was administrated twice daily from days 5 to 9 after transplantation. Representative images and quantified signal values (p/s) are shown (mean ± SEM). The P value was calculated by unpaired Student t test (n = 5). (E) The leukemia burden in bone marrow was evaluated by human CD45 flow cytometry analysis after 2 weeks of treatment with YKL-05-099 in NSGS mice receiving transplants of AML PDX model (PDX-1) cells. The mean ± standard deviation is shown (n = 4 or 5). The P value was calculated by the unpaired Student t test. (F) Survival curves of NSGS mice receiving transplants of PDX-1 AML cells. YKL-05-099 treatment (18 mg/kg, intraperitoneal injection, once daily) was initiated from day 7 after transplantation for 3 weeks. The P value was calculated by log-rank (Mantel-Cox) test (n = 8). (G-H) Flow cytometry analysis of myeloid and B- and T-cell populations in peripheral blood (G) and bone marrow (H) from C57BL/6 mice after 4 weeks of treatment with 18 mg/kg YKL-05-099. (I) Absolute number of LSK cells per femur from the mice in panel G. (J) Mouse weight measurements were performed during daily treatment with 18 mg/kg YKL-05-099 (n = 6).](https://ash.silverchair-cdn.com/ash/content_public/journal/blood/135/1/10.1182_blood.2019001576/3/m_bloodbld2019001576f4.png?Expires=1764976588&Signature=XPk5kiZzSGhmG0kkEXHLL~SvfR3z7Wjq7cTJ6GRCFIz7TSBDNsBl7kit5S37maGUnmuf5EdNFol0BBXZBz13~Jrz1Nsb8mAOzt835X4NuwSbVjwd8E9W262eD7B7F~Sk5l57JwfB5N9zTKbczzRmaCHQBntCaORTcrMphmstlGtdeestJZMb5HSTNfoyp7H0jI1wxxKOrF84ifhYgPd-3eFZRAW59nCzEG051IYN2AZ0JGcw~KFdeDNDcy4tCA-6WBi2DImACnfx3~fXkEQOmIVAtK~FbdII77ZALFUaZqKuHjaRSx49y4B9troHz2cqDYkDiIg5tNrS4Hmdrjf8rA__&Key-Pair-Id=APKAIE5G5CRDK6RD3PGA)
YKL-05-099 treatment extends survival in 2 mouse models of MLL-AF9 AML. (A) Survival curves of C57BL/6 mice transplanted with RN2 cells, followed by intraperitoneal injection of 6 mg/kg YKL-05-099 treatment once daily from day 1 after transplantation. The P value was calculated by log-rank (Mantel-Cox) test (n = 4 or 5). (B) Representative bioluminescence imaging of mice on the indicated days after transplantation. (C) Quantification of the signal in panel B. Values represent photons per second (p/s) of bioluminescent signal detection (mean ± standard error of the mean [SEM]). The P value was calculated by unpaired Student t test (n = 4 or 5). (D) Bioluminescence imaging of wild-type C57BL/6 mice that received RN2 cell transplants. YKL-05-099 was administrated twice daily from days 5 to 9 after transplantation. Representative images and quantified signal values (p/s) are shown (mean ± SEM). The P value was calculated by unpaired Student t test (n = 5). (E) The leukemia burden in bone marrow was evaluated by human CD45 flow cytometry analysis after 2 weeks of treatment with YKL-05-099 in NSGS mice receiving transplants of AML PDX model (PDX-1) cells. The mean ± standard deviation is shown (n = 4 or 5). The P value was calculated by the unpaired Student t test. (F) Survival curves of NSGS mice receiving transplants of PDX-1 AML cells. YKL-05-099 treatment (18 mg/kg, intraperitoneal injection, once daily) was initiated from day 7 after transplantation for 3 weeks. The P value was calculated by log-rank (Mantel-Cox) test (n = 8). (G-H) Flow cytometry analysis of myeloid and B- and T-cell populations in peripheral blood (G) and bone marrow (H) from C57BL/6 mice after 4 weeks of treatment with 18 mg/kg YKL-05-099. (I) Absolute number of LSK cells per femur from the mice in panel G. (J) Mouse weight measurements were performed during daily treatment with 18 mg/kg YKL-05-099 (n = 6).
We further investigated the efficacy of YKL-05-099 in a PDX model of MLL-AF9 AML propagated in NSGS mice. Unlike observations in the RN2 model (data not shown), a flow cytometry analysis of bone marrow cells after 2 weeks of YKL-05-099 treatment in the PDX model revealed a dose-dependent decrease in human AML cells (Figure 4E). Importantly, all 3 doses of YKL-05-099 did not significantly reduce the weight of the mice during the treatment period (supplemental Figure 7B). In an independent cohort of mice with AML PDX transplants, a 3-week treatment with 18 mg/kg daily of YKL-05-099 led to a significant extension of animal survival (P < .0001; Figure 4F). Taken together, these results suggest that YKL-05-099 treatment can suppress AML progression and extend survival in a PDX model of this disease.
We previously demonstrated that mice treated with 20 mg/kg YKL-05-099 daily for 1 week did not exhibit weight loss or metabolic phenotypes.29 To expand upon this observation, we treated wild-type C57BL/6 mice with 18 mg/kg YKL-05-099 daily for 4 weeks, followed by a characterization of normal tissues, including normal hematopoietic cells. Complete blood counts of peripheral blood revealed normal neutrophil, lymphocyte, and platelet levels in the YKL-05-099–treated animals, and a slight elevation of erythrocytes and hemoglobin (supplemental Figure 7C). A flow cytometry analysis of peripheral blood and bone marrow revealed a modest decrease in B-lymphoid cells and an increase in myeloid cells, whereas LSK stem and progenitor cells and T-cell populations were unaffected (Figure 4G-I; supplemental Figure 7D). YKL-05-099 treatment did not lead to significant weight loss or changes in serum markers of liver and kidney function (Figure 4J; supplemental Figure 7E). Accordingly, no treatment-related toxicities in lung, liver, or kidney could be recognized via histological examination (supplemental Figure 7F). Taken together, these results suggest that YKL-05-099 treatment can suppress AML progression in mice at doses that are not toxic to normal tissues.
Discussion
The goal of our study was to evaluate the therapeutic potential of targeting the SIK3-HDAC4-MEF2C signaling axis in AML. Based on a collection of genetic and pharmacological evidence, we conclude that a therapeutic window exists when targeting SIK3 in the MLL-rearranged subtype of AML. In addition, our findings suggest that SIK3 will have relevance as a target in other hematopoietic malignancies that are addicted to MEF2C, such as multiple myeloma or other AML subtypes.20 The unique attribute of SIK3 as a target is the selectivity of its essentiality, which is now supported by CRISPR screening results from >500 cancer cell lines and by our new experiments in normal hematopoietic cells. Unlike other nononcogene kinase targets (eg, CDK1), we expect that selective inhibitors of SIK3 will have minimal on-target effects on the growth of nonmalignant tissues, which is supported by the limited toxicities observed in YKL-05-099–treated animals and by the viability of Sik3-deficient mice.53 It is likely that other kinases (eg, CaMK and AMPK) compensate for the loss of SIK3 in other tissues to maintain HDAC4 phosphorylation,23,57 which may account for the tolerance of mice to sustained SIK inhibition.
YKL-05-099 efficiently inhibits all 3 SIK family kinases [in vitro 50% inhibitory concentrations of SIK1, SIK2, and SIK3 are 10, 40, and 30 nM, respectively],29 but it retains off-target activity for other kinases, including SRC and ABL. It is likely that off-target effects on other kinases complicates the correlation between MEF2C addiction and sensitivity to YKL-05-099. Interestingly, a clinical stage kinase inhibitor crenolanib was found to have a potent off-target effect on SIKs (in vitro 50% inhibitory concentrations of 16 nM for SIK2 and 2 nM for SIK3), and this drug has been shown to be well tolerated in humans.58,59 This finding lends additional support that sustained SIK inhibition would be well-tolerated in humans, and potentially raises the possibility that off-target blockade of the SIK-HDAC4-MEF2C signaling axis contributes to the anti-AML activity of this agent.60 Recent studies have demonstrated a tumor suppressor function for SIK3 in the setting of lung cancer,61,62 which raises the possibility that prolonged pharmacological SIK inhibition may have protumorigenic effects in nonhematopoietic tissues. Although we did not observe any neoplastic lesions in the lungs of YKL-05-099–treated animals, potential tumorigenic effects of SIK inhibition will need to be examined in future preclinical and clinical studies.
One caveat of our animal studies is that YKL-05-099 treatment led to only a modest attenuation of AML progression. However, we noted throughout our study that genetic inactivation of SIK3 led to stronger effects on cell growth, histone acetylation, and gene expression than our highest on-target doses of YKL-05-099. This observation suggests that efficacy in our animal studies is limited by the pharmacological properties of YKL-05-099, rather than the limitation of SIK3 as a genetic dependency. Although our chemical optimization of YKL-05-099 has led to improved pharmacokinetic properties,29 the overall potency of this compound and its selectivity for SIKs will require further optimization to reach the profile of other successful kinase inhibitors used in the clinic. Our prior genetic evidence suggests that SIK2 can partially compensate for the loss of SIK3 in AML, whereas SIK1 seems to be expressed at lower levels and is dispensable for AML growth.22 Therefore, an ideal SIK inhibitor for AML therapy would have selectivity for SIK2 and SIK3, while sparing SIK1 and other kinases. We have recently identified an additional lead compound from scaffold morphing, and chimeric analogs are currently being developed by combining this compound’s structural features with YKL-05-099. In addition, small-molecule degraders, also referred to as proteolysis targeting chimeras or degronimids, could improve the kinome selectivity and enable abrogation of non–kinase-dependent functions of SIKs as a strategy to obtain maximal MEF2C suppression in AML.63-68 Our ongoing efforts are directed toward developing druglike compounds for definitive preclinical investigation of SIK inhibition as a therapeutic approach in AML, as well as in other hematopoietic cancers with MEF2C addiction.
Our studies of SIK inhibition have also provided us with insight into potential drug resistance mechanisms that may limit clinical efficacy. For example, we have shown that engineering a single point mutation of SIK3 (T142Q) or inactivation of HDAC4 are each sufficient to confer resistance to YKL-05-099, and such events have the potential to occur spontaneously in AML and to be selected for during sustained SIK inhibition in vivo. In addition, it is possible that mutations of the MADS box of MEF2C that abolish the HDAC4 interaction could bypass SIK3 dependence. Our study also suggests the possibility that nongenetic mechanisms endow AML cells with resistance to YKL-05-099. We have seen that in vitro culturing of RN2 cells in the presence of YKL-05-099 for 3 days selects for drug-tolerant cells with enhanced leukemia growth in vivo. Although MEF2C was originally proposed to promote self-renewal within LSCs,15 our findings raise the possibility that a stem cell–like state may instead be a route for bypassing SIK dependence, a possibility that warrants further investigation. Finally, our study reinforces prior work demonstrating that MEF2C can promote cytarabine resistance in AML.21 This suggests that combinations of SIK inhibitors with cytotoxic chemotherapy may have utility in suppressing the emergence of drug-resistant cell populations.
The key mechanistic advance in our study is in revealing a strategy for targeting a lineage-defining TF as cancer therapy. shRNA and CRISPR screening efforts by our laboratory and many others have consistently recovered lineage TFs as powerful and selective dependencies which are compelling opportunities for drug intervention in cancer. With the exception of the estrogen receptor and androgen receptor, however, this important class of targets has yet to achieve clinical significance, owing to the lack of druggable domain functionalities for TFs outside of the nuclear hormone receptor family. This has necessitated indirect approaches for modulating TF functions, such as through the use of molecular glues that promote interactions between TFs and other regulatory machineries. A paradigm of this approach is the phthalimide-based compounds, which promote degradation of Ikaros family TFs by promoting interactions with the cereblon E3 ubiquitin ligase.67 From this perspective, our work suggests an alternative molecular glue approach, in which drugs stimulate the formation of ineffectual TF/cofactor complexes that lack transcriptional activation capabilities, yet still reside on DNA. Interestingly, prior studies suggest that HDAC4 is a versatile cofactor that can block TF-mediated enhancer function through noncatalytic mechanisms.68,69 Although HDAC4 has a high affinity for MEF2C, it may be possible to develop small molecules that allosterically reprogram the specificity of this repressive cofactor for other lineage TFs with prominent roles in cancer maintenance.
The ChIP-seq and RNA-seq data prepared in this paper are available in the National Center for Biotechnology Information’s Gene Expression Omnibus Database through GEO Series accession number GSE129863.
The publication costs of this article were defrayed in part by page charge payment. Therefore, and solely to indicate this fact, this article is hereby marked “advertisement” in accordance with 18 USC section 1734.
Acknowledgments
The authors thank James C. Mulloy for genetically engineered human AML cell lines, and Mark Fleming for tissue histopathology review.
This work was supported by Cold Spring Harbor Laboratory, National Institutes of Health (NIH) National Cancer Institute Cancer Center Support grant 5P30CA045508. Additional funding was provided by the Forbeck Foundation; the Pershing Square Sohn Cancer Research Alliance; NIH, National Cancer Institute grants R35CA210030, R50CA211404, R01CA174793, and P01CA013106; and a Leukemia and Lymphoma Society Scholar Award. Y.T. was supported by the Lauri Strauss Leukemia Foundation. S.L. is a Fellow of the Leukemia and Lymphoma Society.
Authorship
Contribution: Y.T., S.L., J.W., J.P.M., Y.X., B.L., Z.Y., Y.W., and S.P. performed the experiments; Y.T. and S.L. analyzed the data; M.W., N.S.G., K.S., and C.R.V. supervised the experiments and analyses; and Y.T., S.L., K.S., and C.R.V. wrote the manuscript.
Conflict-of-interest disclosure: C.R.V. is an advisor to KSQ Therapeutics and has received research funding from Boehringer-Ingelheim. K.S. has consulted for Novartis and Rigel Pharmaceuticals and received grant funding from Novartis on topics unrelated to this manuscript. N.S.G. is a founder, science advisory board member, and equity holder in Gatekeeper, Syros, Petra, C4, B2S, and Soltego. The Gray Laboratory receives or has received research funding from Novartis, Takeda, Astellas, Taiho, Jansen, Kinogen, Her2llc, Deerfield, and Sanofi. The remaining authors declare no competing financial interests.
Correspondence: Christopher R. Vakoc, Cold Spring Harbor Laboratory, 1 Bungtown Rd, Cold Spring Harbor, NY 11724; e-mail: vakoc@cshl.edu; and Kimberly Stegmaier, Dana-Farber Cancer Institute, 450 Brookline Ave, Boston, MA 02215; e-mail: kimberly_stegmaier@dfci.harvard.edu.

This feature is available to Subscribers Only
Sign In or Create an Account Close Modal