

Key Points
Sensitivity to thalidomide analogs is determined by an interplay between the level of CRBN and multiple potential substrates.
Substrates compete for access to a limiting pool of the CRBN E3 ligase substrate adaptor in the presence of thalidomide analogs.

Abstract
Pharmacologic agents that modulate ubiquitin ligase activity to induce protein degradation are a major new class of therapeutic agents, active in a number of hematologic malignancies. However, we currently have a limited understanding of the determinants of activity of these agents and how resistance develops. We developed and used a novel quantitative, targeted mass spectrometry (MS) assay to determine the relative activities, kinetics, and cell-type specificity of thalidomide and 4 analogs, all but 1 of which are in clinical use or clinical trials for hematologic malignancies. Thalidomide analogs bind the CRL4CRBN ubiquitin ligase and induce degradation of particular proteins, but each of the molecules studied has distinct patterns of substrate specificity that likely underlie the clinical activity and toxicities of each drug. Our results demonstrate that the activity of molecules that induce protein degradation depends on the strength of ligase-substrate interaction in the presence of drug, the levels of the ubiquitin ligase, and the expression level of competing substrates. These findings highlight a novel mechanism of resistance to this class of drugs mediated by competition between substrates for access to a limiting pool of the ubiquitin ligase. We demonstrate that increased expression of a nonessential substrate can lead to decreased degradation of other substrates that are critical for antineoplastic activity of the drug, resulting in drug resistance. These studies provide general rules that govern drug-dependent substrate degradation and key differences between thalidomide analog activity in vitro and in vivo.
Introduction
Thalidomide and its analogs are highly active agents used in the treatment of a number of hematologic malignancies and are a cornerstone of treatment of multiple myeloma (MM) and myelodysplastic syndrome (MDS). These drugs function by increasing the affinity of the CUL4-RBX1-DDB1-CRBN (CRL4CRBN) E3 ubiquitin ligase for a small set of protein substrates, leading to rapid degradation of disease-relevant proteins by the proteasome.1 In MM, the key drug targets are the master lymphocyte transcription factors Ikaros family zinc finger protein 1 (IKZF1) and IKZF3, whereas in del(5q) MDS, the target of lenalidomide that is critical for drug activity is casein kinase 1α (CK1α), encoded by CSNK1A1.2-5 A number of other thalidomide analog substrates have also been described, but how these substrates interact with one another and whether they influence drug activity is unknown.
Expanding the library of agents that function by degrading oncoproteins, many of which were previously considered “undruggable,” is an active area of drug development.6 In addition to the US Food and Drug Administration (FDA)–approved agents, thalidomide, lenalidomide, and pomalidomide, 2 new CRBN modulators have recently been described. Avadomide (CC-122) is closely related to pomalidomide and is currently in clinical development for the treatment of non-Hodgkin lymphoma.7 CC-885 is a novel compound that induces degradation of the translation elongation factor G1 to S phase transition 1 (GSPT1) and has extraordinary activity against myeloid leukemia cell lines in vitro.7,8 Additional novel derivatives are in different phases of drug development and are entering early-phase clinical trials.9
Drugs in this class have distinct biological and clinical activities that are likely due to compound-specific patterns of substrate degradation and cell-specific expression of, and dependence on, target substrates. Different thalidomide derivatives bind CRBN and modulate the molecular interface between CRL4CRBN and protein substrates, thereby altering the substrates that are degraded by a particular molecule.10 The activity of each drug across the spectrum of known substrates has not been evaluated in a comprehensive, systematic, and quantitative fashion. Although most patients will eventually develop resistance to thalidomide analogs, the mechanisms by which this occurs are largely unknown. Decreased expression or mutation of the components of the CRL4CRBN complex have been proposed to mediate resistance, but this explains only a fraction of resistant cases, and other resistance mechanisms are likely to exist.11-13
Further study of these questions has been made difficult by the technical challenges associated with quantitative protein measurement of both CRBN and its substrates. We developed and used a quantitative mass spectrometry (MS)–based assay to measure CRBN, thalidomide analog, and protein substrates to characterize the activity of thalidomide analogs and identify novel modes of drug resistance.
Methods
Cell lines, compounds, antibodies, and vectors
See supplemental Tables 1-4 (available on the Blood Web site) for lists of cell lines, compounds, antibodies, and vectors used in this study.
KG-1 and all MM cell lines were grown in RPMI 1640 supplemented with 10% fetal bovine serum and 1% penicillin, streptomycin, and glutamine. HEK293T cells were grown in Dulbecco's modified Eagle medium supplemented with 10% fetal bovine serum and 1% penicillin, streptomycin, and glutamine.
Dose-response experiments were performed by plating 3 × 10⁶ MM1S cells per well of a 12-well plate and treating with dimethyl sulfoxide (DMSO) or serial dilutions of each drug. After incubating at 37°C for 6 hours, cells were collected and spun down, and the media discarded. Cell pellets were snap-frozen on dry ice. Time-course experiments were performed by plating 3 × 10⁶ MM1S cells per well of a 12-well plate and treating with DMSO, 10 µM thalidomide, 1 µM lenalidomide, 1 µM pomalidomide, 1 µM avadomide, or 0.1 µM CC-885 for the indicated time. Cells were collected as described for dose-response experiments.
Competitive growth with drug-resistance assays were performed by mixing cells on day 1 at a 10:90 ratio of experimental cells to untransduced control cells, respectively, and then grown in either DMSO or 1 µM lenalidomide for the indicated duration. Competitive growth sensitization assays were performed by infecting MM1S cells with retrovirus-expressing FLAG-CRBN–internal ribosomal entry site (IRES)–green fluorescent protein (GFP) or an empty vector (FLAG-IRES-GFP), and mixing cells on day 1 at a 90:10 ratio of experimental cells to untransduced control cells, respectively; they were then grown in either DMSO or the indicated dose of lenalidomide for the indicated duration. Cells were redosed and passaged every 3 to 4 days. With each passage, a small proportion of cells was taken for analysis by fluorescence-activated cell sorting to determine the percentage of fluor-positive (GFP+, tagRFP+, or RFP657+) cells.
Thalidomide analog sensitivity was determined by growing cells in the presence of DMSO or drug for the indicated duration. Cells were dosed and passaged every 2 to 4 days. With each passage, a small proportion of cells were taken and counted on a BD FACSCanto fluorescence-activated cell sorter.
Compounds were resuspended in DMSO at the following stock concentrations: thalidomide (100 mM), lenalidomide (100 mM), pomalidomide (10 mM), avadomide (10 mM), and CC-885 (10 mM); they were stored at −80°C until use.
Immuno-MS
Please see supplemental Methods for detailed procedures involving immuno-MS.
Patient samples
Frozen cell pellets containing CD138-selected plasma cells were obtained from bone marrow of MM patients. Samples were collected according to institutional review board–approved protocols at the Dana-Farber Cancer Institute. Informed consent was obtained from all subjects.
BRET analysis
Bioluminescence resonance energy transfer (BRET) experiments were done as per the manufacturer’s instructions using a NanoBRET PPI starter kit (Promega N1821). Briefly, the full-length CRBN open reading frame was cloned into pFN31K (NanoLuc) and full-length substrate open reading frames were cloned into pFC14K (HaloTag) using the Flexi-vector system (Promega). HEK293T cells were cotransfected with 2 µg of substrate pFC14K vector and 0.2 µg of CRBN-pFN31K vector using TransIT-LT1 reagent (MirusBio). The following day, cells were trypsinized, counted, and transferred to a 96-well plate where they were treated with HaloTag NanoBRET 618 ligand or DMSO and serial dilutions of drug or vehicle for 6 hours. Following addition of NanoBRET NanoGlo substrate, luminescence was measured at 625 nm and 465 nm on a FilterMax F5 plate reader (Molecular Devices).
Immunoblots
MM1S cells were treated with either DMSO or lenalidomide, after which protein lysates were made by adding an equal volume of IP lysis buffer (Pierce); they were then run on a 4% to 15% polyacrylamide gel (Bio-Rad), transferred to polyvinylidene difluoride membrane (EMD Millipore), and blotted for IKZF1, CRBN, hemagglutinin, FLAG, or β-actin. Goat–α-rabbit–horseradish peroxidase (Prometheus) and SuperSignal West Dura ECL reagent (Pierce) was used to visualize the blots.
Results
An immuno-MS assay to measure activity of thalidomide derivatives
Multiple-reaction monitoring (MRM) MS is a high-throughput, targeted method that enables quantitative multiplex detection of proteins with a sensitivity much greater than standard MS. When combined with an immunoprecipitation step at the peptide level (iMRM) the sensitivity of detection can be increased by ∼1000-fold (Figure 1A).14-17
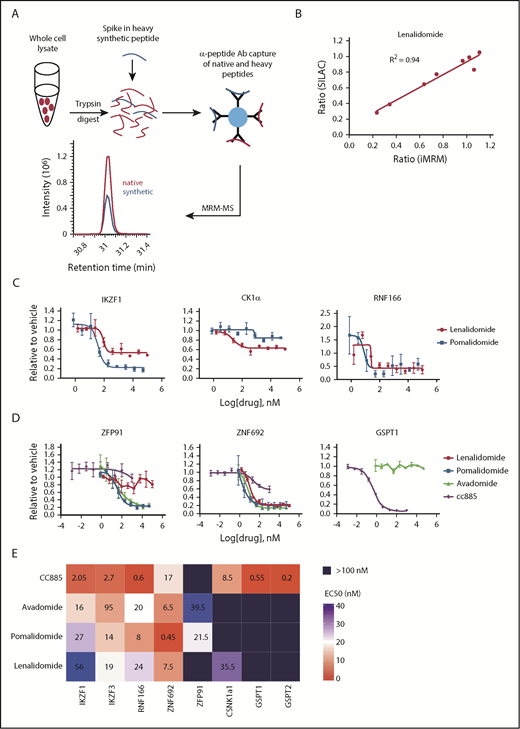
Substrate degradation differs between drugs. (A) Schematic representation of the sample processing and analysis for the iMRM assay. Native peptide present in the sample and synthetic heavy peptide spiked into the sample are indicated by red and blue color, respectively. Liquid chromatography (LC)–MRM-MS trace is shown for 1 of the peptides, however, all 22 peptides were monitored in a single LC-MRM-MS method. (B) Plot of the ratio of substrate level in 1 µM lenalidomide over vehicle as measured in the iMRM assay vs SILAC MS. Line represents the linear regression (R2 = 0.94). (C-D) MM1S cells were treated with serial dilutions of lenalidomide (red), pomalidomide (blue), avadomide (green), CC-885 (purple), or vehicle for 6 hours and then substrate degradation was measured using the iMRM assay. Protein levels were normalized to housekeeping proteins (2 β-actin peptides and 1 GAPDH peptide) and the level in the vehicle-treated sample was normalized to 1. For each protein, data for a single peptide are shown. Data are mean ± standard error of the mean (SEM) (n = 3 replicates). Curves represent the logistic regression. (E) Logistic regression was used to calculated the EC50 for each drug and protein pairing. The value represents the mean EC50 value for all evaluable peptides (n = 1-2) for each protein. Ab, antibody.
Substrate degradation differs between drugs. (A) Schematic representation of the sample processing and analysis for the iMRM assay. Native peptide present in the sample and synthetic heavy peptide spiked into the sample are indicated by red and blue color, respectively. Liquid chromatography (LC)–MRM-MS trace is shown for 1 of the peptides, however, all 22 peptides were monitored in a single LC-MRM-MS method. (B) Plot of the ratio of substrate level in 1 µM lenalidomide over vehicle as measured in the iMRM assay vs SILAC MS. Line represents the linear regression (R2 = 0.94). (C-D) MM1S cells were treated with serial dilutions of lenalidomide (red), pomalidomide (blue), avadomide (green), CC-885 (purple), or vehicle for 6 hours and then substrate degradation was measured using the iMRM assay. Protein levels were normalized to housekeeping proteins (2 β-actin peptides and 1 GAPDH peptide) and the level in the vehicle-treated sample was normalized to 1. For each protein, data for a single peptide are shown. Data are mean ± standard error of the mean (SEM) (n = 3 replicates). Curves represent the logistic regression. (E) Logistic regression was used to calculated the EC50 for each drug and protein pairing. The value represents the mean EC50 value for all evaluable peptides (n = 1-2) for each protein. Ab, antibody.
To develop an iMRM assay to measure thalidomide analog activity, we selected 11 protein targets of interest: CRBN, the substrate adaptor for the CRL4CRBN E3 ubiquitin ligase; 5 previously described substrates (IKZF1, IKZF3, CK1α, ZFP91, and GSPT1)2,3,5,8,18 ; 3 recently identified substrates (RNF166, ZNF692, and GSPT2)5,10,19 ; and 2 control proteins (β-actin and glyceraldehyde-3-phosphate dehydrogenase [GAPDH]) that were used for normalization. Using previously generated deep, unbiased proteomic analysis, we identified at least 2 tryptic peptides for each target protein that were reproducibly detected by standard MS from each of our target proteins in 4 cell lines (KG-1, K562, MM1S, and Jurkat E6-1) (supplemental Table 5).2,5 Peptides were prioritized based on their having high response by electrospray MS and sequences common to most splice isoforms. Peptide sequences containing known posttranslational modifications were avoided as these could interfere with immunoprecipitation and peptide measurement. Rabbits were immunized with synthetic versions of selected peptides to generate unique polyclonal antibodies to each of the 20 peptides as previously described.17 Stable, “heavy” isotope-labeled versions of the target peptides were also synthesized and used as internal standards for quantification in the assay.
We validated that the assay detected each peptide of interest, and that capture and detection was linear for each peptide/antibody combination (supplemental Figures 1 and 2). For each substrate protein, the peptide that demonstrated the best performance characteristics was used for analysis (data for the other peptides are included in supplemental Figures 1-13). Comparison of substrate degradation following 12 hours of treatment with lenalidomide or thalidomide revealed a high degree of concordance between the iMRM assay and stable isotope labeling with amino acids in cell culture (SILAC)-based global proteome analysis.2 We observed a strong correlation between the 2 approaches (R2 = 0.94 and 0.85 for lenalidomide and thalidomide, respectively; Figure 1B and supplemental Figure 3A). In limit-of-detection studies in 3 cell lines, we reliably detected proteins from as few as 50 000 cells (supplemental Table 6). We were also able to detect substrates from as few as 100 000 CD138-selected cells obtained from 2 patients with MM (supplemental Figure 3B). These results demonstrate that the iMRM assay is sensitive, quantitative, and precise for the detection of thalidomide analog-induced substrate degradation.
Detailed characterization of substrate specificity
The thalidomide analogs have distinct biological and clinical activity, but the degree to which these differences result from differential substrate specificity has not been comprehensively assessed. We first examined the differences between the FDA-approved agents lenalidomide and pomalidomide by measuring the relationship between drug dose and target degradation for each substrate in our panel. We treated the lenalidomide-sensitive MM MM1S cell line with 9 drug concentrations or a vehicle control and measured substrate levels after 6 hours of treatment using the iMRM assay (Figure 1C; supplemental Figure 4). We found pomalidomide to be a more potent degrader than lenalidomide for all targets, including the newly identified substrates RNF166 and ZNF692, but with the notable exception of CK1α, which is selectively degraded by lenalidomide.5 This increased potency and differential spectrum of substrate degradation may, at least in part, explain its clinical efficacy in MM patients refractory to lenalidomide.20
We next examined the dose response of target degradation by the newer thalidomide analogs avadomide and CC-885 (Figure 1D). We systematically assessed degradation of each substrate by all compounds tested using logistic regression to determine the drug concentration at which 50% of maximal degradation (the EC50) occurred for each drug/substrate pair (Figure 1E). Lower EC50 was associated with a greater degree of degradation at maximal response. The compounds had strikingly distinct patterns of substrate degradation. Avadomide had a substrate-specificity pattern similar to pomalidomide. However, it was a more potent degrader of IKZF1 and IKZF3 whereas being somewhat less effective than pomalidomide at degrading ZFP91 and ZNF692 (Figure 1D-E). In contrast, the compound CC-885 was uniquely capable of inducing degradation of GSPT1 and GSPT2, was less efficient at degrading ZNF692 than other drugs, and was unable to induce degradation of ZFP91 (Figure 1D-E; supplemental Figure 4). Lenalidomide and CC-885 were the only compounds that induced degradation of CK1α. Consistent with their enhanced ability to induce degradation of IKZF1 and IKZF3, pomalidomide and avadomide are more potent drugs at inhibiting proliferation in MM1S cells, and CC-885, which induces degradation of the essential substrate GSPT1, has the most potent activity. We observed this order of potency when looking at their antiproliferative effects after 10 days of treatment or when assessing mitochondrial apoptotic priming after only 20 hours of treatment using dynamic BH3 profiling (supplemental Figure 5A-B).21 These data establish quantitative differences in the activity of thalidomide analogs for 5 previously described and 3 recently identified substrates.
Substrate degradation is associated with binding to CRBN
We next considered whether the observed differences in substrate degradation are due to differential interaction with the CRBN-drug ternary complex within cells or to some later downstream step involving rates of deubiquitination or proteasomal degradation. We measured substrate binding as a function of drug concentration using BRET (Figure 2; supplemental Figure 6A).22 No BRET signal above background was detected in the absence of thalidomide analogs or with deletion of the CRBN-interacting zinc finger domains from substrates (supplemental Figure 6B). BRET data reflected those seen for degradation, with weaker degraders showing a higher EC50 for interaction or lower maximal BRET signal intensity. Consistent with its higher potency, CC-885 induces interaction between CRBN and most substrates at a lower drug concentration than other agents. It was also the only drug capable of inducing interaction with GSPT1 but was unable to do so with ZFP91 (Figure 2). These findings support a model in which the limiting factor for drug-induced degradation is the affinity of substrate binding to CRBN in the presence of drug, not subsequent proteasomal degradation.
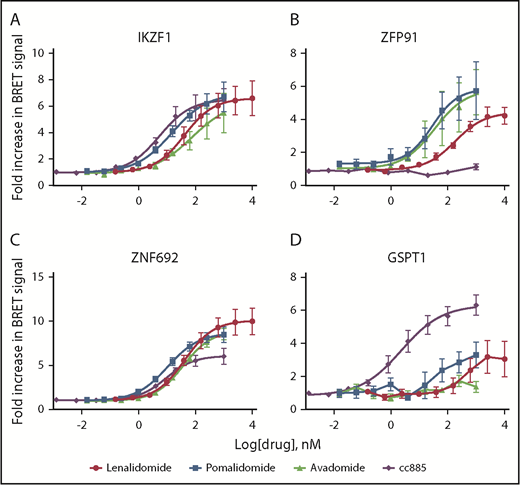
Substrate degradation is associated with binding to CRBN. (A-D) 293T cells were transiently cotransfected with vectors carrying CRBN fused to NanoLuciferase and indicated substrate proteins fused to HaloTag. They were then treated with serial dilutions of decreasing doses of drug or vehicle for 6 hours and then the BRET signal was measured and the level in the vehicle-treated sample was normalized to 1. Data are mean ± SEM (n ≥ 4 replicates). Curves represent the logistic regression.
Substrate degradation is associated with binding to CRBN. (A-D) 293T cells were transiently cotransfected with vectors carrying CRBN fused to NanoLuciferase and indicated substrate proteins fused to HaloTag. They were then treated with serial dilutions of decreasing doses of drug or vehicle for 6 hours and then the BRET signal was measured and the level in the vehicle-treated sample was normalized to 1. Data are mean ± SEM (n ≥ 4 replicates). Curves represent the logistic regression.
Kinetics of degradation differ between drugs
The kinetics of substrate degradation induced by thalidomide analogs are likely to underlie some of the differences between agents, but have never been systematically assessed in cells. Although global quantitative proteomic studies can be used to provide this information, they are too time-consuming and labor-intensive for dense time-course analyses of multiple drugs and/or cell lines as offline fractionation at the peptide level into as many as 24 fractions is required prior to MS to obtain sufficient depth of proteome coverage to detect proteins of interest. In contrast, the iMRM assay we constructed is rapid and fit for purpose for such measurements. We therefore examined substrate levels at multiple time points following treatment of cells with thalidomide or 4 derivative compounds (Figure 3A; supplemental Figure 7).
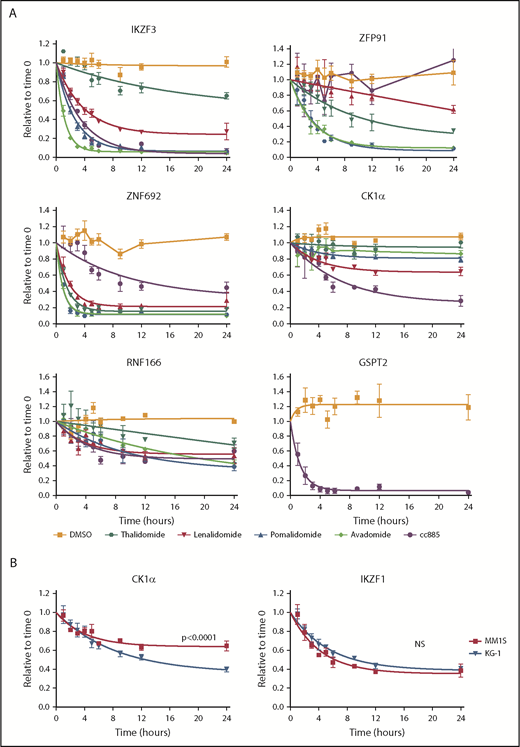
Kinetics of degradation differ between drugs. (A) Levels of IKZF3, ZFP91, ZNF692, CK1α, RNF166, and GSPT2 protein as measured by the iMRM assay following treatment of MM1S cells for the indicated period of time with vehicle (orange), 10 µM thalidomide (dark green), 1 µM lenalidomide (red), 1 µM pomalidomide (blue), 1 µM avadomide (light green), or 0.1 µM CC-885 (purple). Protein levels were normalized to housekeeping proteins (β-actin and GAPDH) and the level at the start of the experiment was normalized to 1. Data are mean ± SEM. Curves represent the nonlinear regression (n ≥ 3 replicates). (B) Levels of CK1α and IKZF1 protein as measured by the iMRM assay in MM1S (red) and KG-1 (blue) cells after treatment with 1 µM lenalidomide. Curves represent the nonlinear regression. n ≥ 3 replicates; P values are from a sum of squares F test. NS, nonsignificant (corrected for multiple hypothesis testing).
Kinetics of degradation differ between drugs. (A) Levels of IKZF3, ZFP91, ZNF692, CK1α, RNF166, and GSPT2 protein as measured by the iMRM assay following treatment of MM1S cells for the indicated period of time with vehicle (orange), 10 µM thalidomide (dark green), 1 µM lenalidomide (red), 1 µM pomalidomide (blue), 1 µM avadomide (light green), or 0.1 µM CC-885 (purple). Protein levels were normalized to housekeeping proteins (β-actin and GAPDH) and the level at the start of the experiment was normalized to 1. Data are mean ± SEM. Curves represent the nonlinear regression (n ≥ 3 replicates). (B) Levels of CK1α and IKZF1 protein as measured by the iMRM assay in MM1S (red) and KG-1 (blue) cells after treatment with 1 µM lenalidomide. Curves represent the nonlinear regression. n ≥ 3 replicates; P values are from a sum of squares F test. NS, nonsignificant (corrected for multiple hypothesis testing).
Each drug had a unique pattern of substrate degradation kinetics with the exception of pomalidomide and avadomide, which are highly similar to one another. Overall, a lower EC50 for substrate degradation was associated with both an increased rate and larger degree of substrate degradation. Across all 5 drugs, IKZF3 and ZNF692 were the most rapidly degraded substrates. Strikingly, ZNF692 was maximally degraded by pomalidomide within 2 hours. ZFP91 had the greatest variance in degradation kinetics between drugs. Although thalidomide was markedly inferior at degrading most substrates when compared with the more clinically active lenalidomide, it degraded ZFP91 more rapidly and to a greater degree (Figure 3A). As expected, only CC-885 degraded GSPT1 and GSPT2 and did so with highly similar kinetics (supplemental Figure 7). These data suggest a hierarchy of substrate interaction for each drug, in which the degree of drug-induced substrate binding drives both the rate and degree of substrate degradation.
To examine substrate degradation in a different cellular context, we measured degradation kinetics in the myeloid cell line, KG-1. The rate of substrate degradation was the same for all targets except for CK1α, which is degraded more rapidly and to a greater extent in KG-1 cells than in MM1S cells (Figure 3B; supplemental Figure 8A). The basal expression of most substrates are comparable between KG-1 and MM1S cells, with the exception of IKZF1 and CRBN which are expressed at higher levels in KG-1 cells (supplemental Figure 8B).
Substrate degradation is dependent on a limiting pool of CRBN
CRBN is essential for thalidomide analog activity, and changes in CRBN level have been proposed as 1 mechanism of lenalidomide resistance.2,3,23-28 However, examination of the relationship between CRBN levels and drug activity has been challenging without a quantitative assay for CRBN protein expression. Detection of CRBN in our iMRM assay enabled us to study the effect of changes in CRBN levels on the activity of thalidomide analogs.
To manipulate CRBN levels experimentally, we used clustered regularly interspaced short palindromic repeats (CRISPR)/CRISPR-associated protein-9 (CAS9) to decrease CRBN expression and complementary DNA expression to increase expression. After transducing MM1S cells with single guide RNAs targeting CRBN or a nontargeting sequence, we confirmed a decrease in CRBN protein level by western blot and iMRM assay (supplemental Figure 9A-C). Decreased CRBN levels led to lenalidomide resistance and diminished degradation of all substrates, with the magnitude of effect correlating with CRBN expression (Figure 4A).5 In contrast, a viral vector overexpressing CRBN in MM1S cells, leading to an ∼10-fold increase in CRBN protein, caused a markedly greater sensitivity to lenalidomide (Figure 4B; supplemental Figure 10A). CRBN overexpression also increased the rate and degree of degradation for all substrates (Figure 4C-D; supplemental Figure 10B-C). These findings demonstrate that in MM1S cells, CRBN expression is limiting for substrate degradation and cellular toxicity of lenalidomide.
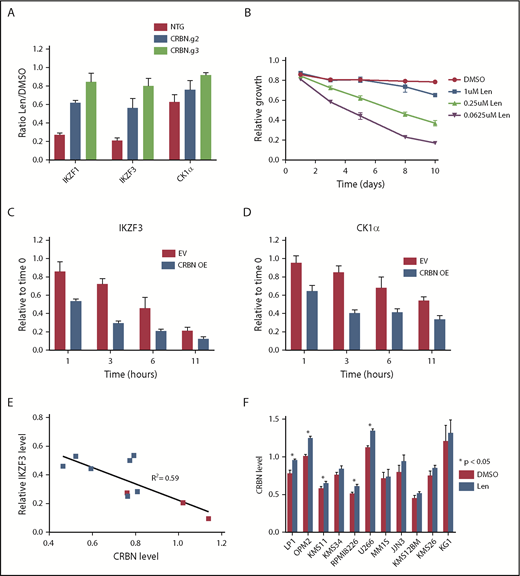
Substrate degradation is dependent on a limiting pool of CRBN. (A) MM1S cells that constitutively express CAS9 were transduced with lentivirus-expressing single guide RNAs and a fluorophore (tagRFP or RFP657). Data are mean ± SEM (n = 3 replicates). (B) MM1S cells were transduced with retrovirus-expressing GFP and CRBN. Relative growth was assessed by means of flow cytometry after treatment with decreasing doses of lenalidomide (Len) or vehicle. Data are representative of 2 independent experiments. (C-D) Levels of IKZF3 and CK1α protein as measured by the iMRM assay following treatment with 1 µM lenalidomide in MM1S cells overexpressing CRBN (CRBN OE; n = 3 replicates). Protein levels were normalized to a housekeeping factor and the level at the start of the experiment was normalized to 1. (E-F) Levels of IKZF3 and CRBN protein as measured by the iMRM assay in each of the 10 MM cell lines after treatment with 1 µM lenalidomide or vehicle for 24 hours. Protein levels were normalized to the housekeeping factor (n ≥ 3 replicates). (E) The ratio of IKZF3 in the lenalidomide-treated as compared with vehicle-treated samples is plotted against the absolute CRBN level in vehicle-treated samples. Points marked in red represent lenalidomide-sensitive cell lines. (F) Protein level of CRBN in each of the cell lines after treatment with 24 hours of 1 µM lenalidomide or vehicle. P values from a 2-sided Student t test. Data are mean ± SEM (n ≥ 3 replicates). NTG, nontargeting guide.
Substrate degradation is dependent on a limiting pool of CRBN. (A) MM1S cells that constitutively express CAS9 were transduced with lentivirus-expressing single guide RNAs and a fluorophore (tagRFP or RFP657). Data are mean ± SEM (n = 3 replicates). (B) MM1S cells were transduced with retrovirus-expressing GFP and CRBN. Relative growth was assessed by means of flow cytometry after treatment with decreasing doses of lenalidomide (Len) or vehicle. Data are representative of 2 independent experiments. (C-D) Levels of IKZF3 and CK1α protein as measured by the iMRM assay following treatment with 1 µM lenalidomide in MM1S cells overexpressing CRBN (CRBN OE; n = 3 replicates). Protein levels were normalized to a housekeeping factor and the level at the start of the experiment was normalized to 1. (E-F) Levels of IKZF3 and CRBN protein as measured by the iMRM assay in each of the 10 MM cell lines after treatment with 1 µM lenalidomide or vehicle for 24 hours. Protein levels were normalized to the housekeeping factor (n ≥ 3 replicates). (E) The ratio of IKZF3 in the lenalidomide-treated as compared with vehicle-treated samples is plotted against the absolute CRBN level in vehicle-treated samples. Points marked in red represent lenalidomide-sensitive cell lines. (F) Protein level of CRBN in each of the cell lines after treatment with 24 hours of 1 µM lenalidomide or vehicle. P values from a 2-sided Student t test. Data are mean ± SEM (n ≥ 3 replicates). NTG, nontargeting guide.
Different MM cell lines vary in their sensitivity to lenalidomide.3,26 To determine whether the relationship between CRBN level and substrate degradation was a more general phenomenon, we examined whether CRBN levels are associated with substrate degradation and sensitivity to lenalidomide in a range of MM cell lines. We measured CRBN and substrate levels quantitatively using the iMRM assay after 24 hours of treatment with lenalidomide or vehicle in 9 additional MM cell lines. Although the degree of degradation varied across cell lines, the greatest degree of degradation of IKZF1 and IKZF3 was observed in the lenalidomide-sensitive lines (Figure 4E; supplemental Figure 11A-B).3,26 Degradation of the new substrates ZFP91, ZNF692, and RNF166 was similarly correlated with CRBN level (supplemental Figure 11C-D). Degradation of IKZF3 correlated with higher CRBN levels (R2 = 0.59) and lenalidomide sensitivity was associated with a higher average CRBN level and increased degradation of IKZF1 and IKZF3 irrespective of their baseline expression level (Figure 4E; supplemental Figure 11E-J). These findings indicate that lenalidomide sensitivity in MM correlates with CRBN expression levels.
Across all cell lines, CRBN protein levels increased ∼5% to 10% following lenalidomide treatment (Figure 4F). This finding demonstrates the sensitivity of our assay for quantifying subtle changes in protein levels. This stabilization of CRBN is consistent with previous reports of in vitro CRBN autoubiquitination, an activity that is likely inhibited when CRBN is engaged by lenalidomide and a substrate.29
Substrates compete for access to CRBN
The hierarchy of degradation observed between substrates and the differential degradation of targets seen in myeloid and lymphoid cell lines suggests that substrates themselves might compete for binding to CRL4CRBN in cells. Therefore, we overexpressed a substrate, ZNF692, that is not important for the viability of MM1S cells but is rapidly degraded in the presence of drug, consistent with it being preferentially degraded over other substrates (Figure 3A).30,31 Overexpression of full-length ZNF692 has no effect on the sensitivity of MM1S cells to lenalidomide likely due to the rapid and complete degradation of this protein even when overexpressed (supplemental Figure 12A).
To examine the effect of a substrate that binds tightly to CRBN but is not degraded, we generated a mutant ZNF692 in which all lysines were changed to arginine (K0 ZNF692 isoform). This mutant protein is expressed, and is capable of interacting with CRBN as measured by coimmunoprecipitation and BRET, but has no acceptor lysines for ubiquitin and therefore is not degraded in the presence of lenalidomide (supplemental Figure 12A-C). In contrast to wild-type ZNF692, expression of the K0 ZNF692 isoform leads to lenalidomide resistance in MM1S cells (Figure 5A). The resistance is not due to direct effect on the viability or growth of the cells as there is no difference seen in the vehicle-treated samples, but rather is caused by decreased degradation of all other substrates as measured by iMRM (Figure 5B-D; supplemental Figure 12D). Moreover, expression of a ZNF692 isoform lacking the CRBN-interaction domain (ZNF692ΔZF) has no effect on lenalidomide sensitivity (Figure 5A). Expression of a second nonessential substrate, RNF166, had a similar, albeit smaller, effect consistent with its less rapid degradation in the presence of lenalidomide (supplemental Figure 12E-F). Finally, to determine whether decreased levels of nonessential substrates can sensitize cells to lenalidomide, we used CRISPR/CAS9 to decrease expression of RNF166, ZNF692, and ZFP91. Compared with a nontargeting guide, knockdown of either RNF166 or ZNF692 led to a subtle but reproducible sensitization of MM1S cells to lenalidomide (supplemental Figure 13A-B). In contrast, knockdown of ZFP91 had no effect, consistent with it being a poor substrate for lenalidomide-induced degradation (supplemental Figure 13C). Together, these findings demonstrate that substrates compete for access to CRBN in the presence of thalidomide analogs and that expression levels of 1 substrate can impact the degradation of others.
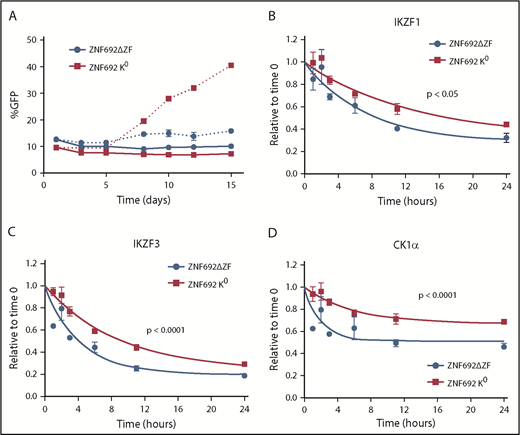
Substrates compete for access to CRBN. MM1S cells were transduced with lentivirus-expressing GFP and either a degron-deleted or K0 version of ZNF692. (A) Relative growth was assessed by means of flow cytometry after treatment with vehicle (solid lines) or 1 µM lenalidomide (dashed lines). Data are mean± SEM and are representative of 3 independent experiments. (B-D) Relative protein level as measured using the iMRM assay. Protein levels were normalized to a housekeeping factor and the level at the start of the experiment was normalized to 1. Curves represent the nonlinear regression. P values are from a sum of squares F test. Data are mean ± SEM (n = 3 replicates). ZNF692ΔZF, full-length ZNF692 protein with the CRBN-interacting zinc finger (amino acids 417-439) deleted; ZNF692 K0, full-length ZNF692 with every lysine changed to arginine.
Substrates compete for access to CRBN. MM1S cells were transduced with lentivirus-expressing GFP and either a degron-deleted or K0 version of ZNF692. (A) Relative growth was assessed by means of flow cytometry after treatment with vehicle (solid lines) or 1 µM lenalidomide (dashed lines). Data are mean± SEM and are representative of 3 independent experiments. (B-D) Relative protein level as measured using the iMRM assay. Protein levels were normalized to a housekeeping factor and the level at the start of the experiment was normalized to 1. Curves represent the nonlinear regression. P values are from a sum of squares F test. Data are mean ± SEM (n = 3 replicates). ZNF692ΔZF, full-length ZNF692 protein with the CRBN-interacting zinc finger (amino acids 417-439) deleted; ZNF692 K0, full-length ZNF692 with every lysine changed to arginine.
Discussion
Despite their clinical importance, our understanding of the determinants of activity and resistance of thalidomide analogs has remained limited. Using immunoaffinity enrichment and targeted MS with heavy isotopically labeled peptide standards, we measured the levels of CRBN and thalidomide analog substrates quantitatively. We integrated results of experiments determining the degradation of multiple substrates by multiple compounds, degradation kinetics, and drug-induced substrate binding to identify the rules that define activity of this class of drugs. Substrate specificity is dependent upon the ability of individual drugs to induce strong binding of a given substrate to the CRBN adaptor protein. Whether this binding occurs, and the subsequent rate of substrate degradation, further depends on the level of CRBN. Finally, multiple substrates compete for access to this limiting pool of CRBN, leading to an ordered degradation of substrates.
We quantified the degradation characteristics of multiple previously identified substrates as well as 3 new substrates. Pomalidomide and avadomide induce more rapid and complete degradation of most substrates than lenalidomide or thalidomide, which may explain their increased clinical efficacy in certain contexts.32 Lenalidomide is superior for degrading CK1α, which likely mediates greater efficacy of lenalidomide in MDS.5,33,34 Thus, for this therapeutic class of agents, clinical activity depends both on specific drug-substrate combinations and the efficiency of substrate degradation. RNF166 and ZNF692 are 2 zinc-finger proteins degraded by all 5 drugs with unique patterns of specificity. ZNF692 is the most rapidly degraded substrate we characterized, with protein levels dropping by >50% in the first 1 to 2 hours following treatment with pomalidomide. Although these substrates are degraded across a panel of MM cell lines and are detectable in patient samples, their role in mediating drug activity has yet to be determined. The other new substrate, GSPT2, which is a homolog of GSPT1, is only degraded by CC-885. This observation may have been missed in prior studies due to GSPT2’s lower expression levels and high sequence identity with GSPT1, making differentiation between these 2 proteins challenging with standard protein detection techniques.8,35
CRBN is absolutely required for thalidomide analog-mediated degradation of substrates and both the degradation of substrates and sensitivity of cells to thalidomide analogs can be abolished by decreasing CRBN levels.2,3,5,23,27,28 Here, we show that CRBN is a limiting factor for thalidomide analog-induced substrate degradation and that increased expression of CRBN leads to more rapid substrate degradation and increased cellular sensitivity. The basal level of CRBN expression also correlates with the variation observed in cell line sensitivity to lenalidomide. Our results contrast with previous reports where the association between CRBN level and drug sensitivity were not observed.24,26 These differences are likely due to the highly reproducible and sensitive nature of our iMRM assay. Thus, alterations in the levels of CRBN within neoplastic cells may also play a role in determining clinical sensitivity to this class of drugs.11-13,36,37
Our studies also demonstrate that substrates interact and compete with one another such that alterations in the expression of 1 substrate, up or down, can affect the degradation of others. Therefore, in any given cell type, the efficacy of a thalidomide analog may be influenced by both the level of CRBN expression and the levels of alternative substrates.38-40 Substrate competition is a novel mediator of resistance to this class of drugs, whereby increased expression of a secondary protein drug target unrelated to canonical drug activity can lead to resistance. Cellular sensitivity to thalidomide analogs is, therefore, likely determined by a complex interplay that involves not only the expression level of the CRL4CRBN ubiquitin ligase, but also the number and level of all potential substrates. In addition, there may be other mediators of thalidomide analog resistance including posttranslational modification of substrates and alterations in downstream targets of IKZF1, IKZF3, and CSNK1A1.
With the recent development of drugs that induce protein degradation such as next-generation thalidomide analogs, sulfonamides such as indisulam, and proteolysis-targeting chimeras, new approaches are needed to accurately and quantitatively measure and monitor their activity.6,41,42 The translation of our iMRM assay to a clinical setting will enable the measurement of target proteins, development of predictors of drug sensitivity, and characterization of mechanisms of thalidomide analog resistance.
The original mass spectra are available upon request.
The online version of this article contains a data supplement.
The publication costs of this article were defrayed in part by page charge payment. Therefore, and solely to indicate this fact, this article is hereby marked “advertisement” in accordance with 18 USC section 1734.
Acknowledgments
The authors thank Donna Neuberg for statistical assistance, and Nilay Sethi and members of the Ebert laboratory for critical review of this manuscript and helpful discussions throughout the course of this project.
A.S.S. was supported by a Ruth L. Kirschstein National Research Service Award and a Conquer Cancer Foundation Young Investigator Award. M.S. has received funding from the European Union’s Horizon 2020 Research and Innovation Program under the Marie Skłodowska-Curie grant agreement no. 702642. R.S.S. was supported by the Kay Kendall Leukemia Fund. B.J.L. was supported by the National Health and Medical Research Council (Early Career Fellowships grant APP1124979). This work was supported by the National Institutes of Health (National Heart, Lung, and Blood Institute grant R01HL082945 and National Cancer Institute grant P01CA108631), the Howard Hughes Medical Institute, the Edward P. Evans Foundation, the Adelson Medical Research Foundation, and the Leukemia & Lymphoma Society (B.L.E.).
Authorship
Contribution: A.S.S., S.A.C., and B.L.E. initiated the project, designed the research, and wrote the paper with input from other authors; A.S.S., M.B., H.K., J.A.G., S.B., M.S., R.S., E.A.O., and D.N.A. performed the research; A.S.S., M.B., and H.K. analyzed data; and M.J., R.S.S., E.C.F., P.G.M., B.J.L., Q.L.S., M.F., N.D.U., E.K., A.L., and N.C.M. contributed vital new reagents or analytical tools.
Conflict-of-interest disclosure: B.L.E. has received research funding from Celgene and Deerfield and consulting fees from GRAIL. S.A.C. has received research funding from Celgene. The remaining authors declare no competing financial interests.
Correspondence: Benjamin L. Ebert, Dana-Farber Cancer Institute, 450 Brookline Ave, D1610A, Boston, MA 02215; e-mail: benjamin_ebert@dfci.harvard.edu; or Steven A. Carr, Broad Institute of MIT and Harvard, 450 Main St, Cambridge, MA 02142; e-mail: scarr@broad.mit.edu.

This feature is available to Subscribers Only
Sign In or Create an Account Close Modal