

Key Points
Unbiased CRISPR screens revealed a novel transcription hub containing IRF4 and BATF3, which directly control PD-L1 expression in ALK+ ALCL.
IRF4 and BATF3 are tightly regulated by a signaling network downstream of the nucleophosmin-ALK, through STAT3 and the GRB2/SOS1 signalosome.

Abstract
The success of programmed cell death protein 1 (PD-1)/PD-L1-based immunotherapy highlights the critical role played by PD-L1 in cancer progression and reveals an urgent need to develop new approaches to attenuate PD-L1 function by gaining insight into how its expression is controlled. Anaplastic lymphoma kinase (ALK)-positive anaplastic large-cell lymphoma (ALK+ ALCL) expresses a high level of PD-L1 as a result of the constitutive activation of multiple oncogenic signaling pathways downstream of ALK activity, making it an excellent model in which to define the signaling processes responsible for PD-L1 upregulation in tumor cells. Here, using clustered regularly interspaced short palindromic repeats (CRISPR)/Cas9 library screening, we sought a comprehensive understanding of the molecular effectors required for PD-L1 regulation in ALK+ ALCL. Indeed, we determined that PD-L1 induction is dependent on the nucleophosmin-ALK oncoprotein activation of STAT3, as well as a signalosome containing GRB2/SOS1, which activates the MEK-ERK and PI3K-AKT signaling pathways. These signaling networks, through STAT3 and the GRB2/SOS1, ultimately induce PD-L1 expression through the action of transcription factors IRF4 and BATF3 on the enhancer region of the PD-L1 gene. IRF4 and BATF3 are essential for PD-L1 upregulation, and IRF4 expression is correlated with PD-L1 levels in primary ALK+ ALCL tissues. Targeting this oncogenic signaling pathway in ALK+ ALCL largely inhibited the ability of PD-L1-mediated tumor immune escape when cocultured with PD-1-positive T cells and natural killer cells. Thus, our identification of this previously unrecognized regulatory hub not only accelerates our understanding of the molecular circuitry that drives tumor immune escape but also provides novel opportunities to improve immunotherapeutic intervention strategies.
Introduction
Immune checkpoint regulation mediated by programmed cell death protein 1 (PD-1) and its ligand (PD-L1) has been extensively studied in the age of immunotherapy,1 and targeting PD-1/PD-L1 has demonstrated durable clinical benefit in wide variety of human cancers.2,3 However, many patients with cancer fail to respond to such treatment, and the underlying resistance mechanisms are not fully understood.1,4,5 It has been suggested that the PD-L1 expression levels in tumor cells could correlate with the response to PD-1/PD-L1 blockade.6,7 Therefore, it is important to thoroughly investigate the mechanisms controlling PD-L1 induction in tumor cells to improve the clinical response rate and efficacy of PD-1/PD-L1 blockade in patients with cancer.
In various tumors, PD-L1 can be induced in response to inflammatory signals (ie, interferon-γ) that are produced by active anti-tumor immune response or by the tumor microenvironment. But in many others, PD-L1 is constitutively expressed by the tumor cells even without obvious external stimulation. One of the common mechanisms responsible for constitutive expression of PD-L1 is through oncogenic signaling pathways that are intrinsically activated; for example, in anaplastic lymphoma kinase-positive anaplastic large cell lymphoma (ALK+ ALCL). In ALK+ ALCL, the presentation of a chimeric protein, generated by chromosomal translocations affecting the ALK gene and several different partners, most frequently the nucleophosmin (NPM) gene, is the defining oncogenic event.8,9 The NPM/ALK chimeric protein in ALCL is constitutively activated through autophosphorylation,9,10 and mediates the activation of multiple oncogenic signaling pathways.11 These oncogenic pathways not only are essential for promoting tumor cell proliferation but also could maintain the expression of genes that modulate immune escape (ie, PD-L1). Consistent with this possibility, PD-L1 expression in consistently elevated in most ALK+ ALCL cell lines and primary cases.12
Unlike classical Hodgkin lymphoma and primary mediastinal large cell lymphoma, in which copy gains of the 9p24.1 locus and PD-L1/PD-L2 gene amplification were recurrently detected,13,14 the amplification of such a locus has not been found in ALK+ ALCL cells,15 suggesting that signaling events are likely to be responsible for constitutive elevation of PD-L1 expression in ALK+ ALCL. In support, the kinase activity of the NPM-ALK chimeric protein is essential for elevated PD-L1 expression in these cells, and it requires STAT3 signaling.12 However, the MEK/ERK signaling pathway, which is also downstream of NPM/ALK, could contribute to PD-L1 upregulation in ALK+ ALCL.16 Thus, a comprehensive understanding of the signaling cascades is required.
The newly established RNA-guided clustered regularly interspaced short palindromic repeats (CRISPR)-associated nuclease Cas9 provides a next-generation approach for genome-scale functional screening.17,18 Hence, we decided to use the CRISPR library screening technologies to investigate the complete mechanism of PD-L1 induction in ALK+ ALCL.
Methods
See supplemental Experimental procedures, available on the Blood Web site, for details.
Experimental design
All experiments have been repeated and results reproduced. Where possible, error bars or P values are shown to indicate statistical significance. P < .05 was considered statistically significant.
Cell culture and constructs
Methods for cell culture, plasmid transfection, retroviral transduction, lentiviral production and transduction, and plasmid constructs were described previously.19-21
Patient samples
All human samples were anonymously coded as stipulated by the Declaration of Helsinki. Written informed consent was obtained from the patients. All samples were studied according to a protocol approved by the Institutional Review Board of Sun Yat-sen University Cancer Center.
PD-L1 CRISPR library screen
See supplemental Experimental procedures for details. The PD-L1low cells (10 million for each sort) were enriched by 3 rounds of fluorescence-activated cell sorting at day 4, day 7, and day 10 after sgRNA library induction. Genomic DNA was extracted and sgRNA sequences were amplified by 2 rounds of polymerase chain reaction (PCR). The resulting libraries were sequenced with single end read with dual-index 75 bp.
Results
CRISPR screen for genes required for PD-L1 expression in ALK+ ALCL
To gain a comprehensive understanding of the mechanisms of PD-L1 regulation in ALK+ ALCL, we generated a unique signaling-focused sgRNA library. This library contains 10 single-guide RNAs (sgRNAs) per target that are directed at 5′ constitutive exons of ∼600 genes in the human genome (supplemental Table 1), including immune cell signaling components in previously known oncogenic pathways required for lymphoma pathogenesis.20
Cas9-inducible ALCL cell lines, DEL and Karpas299, which displayed strong endogenous PDL1 expression (Figure 1A; supplemental Figure 1A), were transduced with the CRISPR library, after which the PD-L1low cells were enriched by 3 rounds of fluorescence-activated cell sorting. The sgRNA abundance in both the PD-L1low and unsorted populations was determined by sequencing, and the enrichment of sgRNAs in the PD-L1low population was calculated and plotted (Figure 1B). STAT3, a transcription factor known to regulate PD-L1 expression in ALCL,12 was identified as a strong positive hit (Figure 1B), demonstrating the validity of the screen setup. In addition to STAT3 sgRNAs, we identified multiple sgRNAs that were highly enriched in the DEL PD-L1low population, including sgRNAs targeting IRF4, SOS1, and GRB2 (Figure 1B; supplemental Figure 1B). Indeed, for the top 10 sgRNAs enriched in the PD-L1low population in average of 2 repeats, 7 targeted IRF4, 2 targeted SOS1, and 1 targeted STAT3 (Figure 1C), suggesting that they play critical roles in supporting PD-L1 expression in ALK+ ALCL.
![Figure 1. PD-L1 CRISPR library screen in ALK+ ALCL. (A) Outline of the workflow of the PD-L1 CRISPR library screen in ALK+ ALCL. (B) Overview of the PD-L1 CRISPR library screen results in ALK+ ALCL (2 repeats). Shown are results of all sgRNA enrichment in PD-L1low population [measured by log2(PD-L1low/unsorted)] in DEL line. (C) Shown are the enrichment score [measured by log2(PD-L1low/unsorted)] of the top 10 sgRNAs identified in the PD-L1 CRISPR library screen of DEL line, in an average of 2 repeats. The sgCTRL score represents the average of 100 negative control sgRNAs. (D) Shown are the ranking of all the genes (average of 10 sgRNAs of each gene) enriched in the PD-L1low population of both DEL and Karpas299 lines. Y-axis indicates the distribution of standardized enrichment scores (Z-scores) of each gene enrichment. The dashed lines indicate P = .01. (E) List of top 10 genes enriched in the PD-L1low population of both DEL and Karpas299 lines. Y-axis indicates the distribution of standardized enrichment scores (Z-scores) of each gene enrichment. Green, genes common in both DEL and Karpas299 lines; red, genes in RAS-MEK-ERK pathway; blue, genes in the PI3K-AKT-mTOR pathway.](https://ash.silverchair-cdn.com/ash/content_public/journal/blood/134/2/10.1182_blood.2019001043/3/m_bloodbld2019001043f1.png?Expires=1769103891&Signature=BGw96J9gcOxOA1nFYY7CMSYWkrKADw0vNtGiogEnaqjC6nfVaBK8RsxQCnv6dY4sH-JLrM2aru8STc3XogOZbOK7sWjoUcRSt848QB0nHJAGd9BOlMH3-9EXcBc-HVWKSxC6rMptMKBS7RZS68Yp~Ng~7iP7ibIadhOatr6BXJO7Oa89oTdkfkJrd0BUI~loC0CvDlnlyP0OqAqalKsBR0ZD-OWb~wb1fHnWVlZ8kSzKCx8UpU2TwFl32fJaNMSY2uIap9akC~5qPf-HzmJFEddPE41d-lzE07-~2WnJVrPr8NJq0WjW-RsaatIIhmRwTaIQgoDanqw0EVkvvICQJw__&Key-Pair-Id=APKAIE5G5CRDK6RD3PGA)
PD-L1 CRISPR library screen in ALK+ ALCL. (A) Outline of the workflow of the PD-L1 CRISPR library screen in ALK+ ALCL. (B) Overview of the PD-L1 CRISPR library screen results in ALK+ ALCL (2 repeats). Shown are results of all sgRNA enrichment in PD-L1low population [measured by log2(PD-L1low/unsorted)] in DEL line. (C) Shown are the enrichment score [measured by log2(PD-L1low/unsorted)] of the top 10 sgRNAs identified in the PD-L1 CRISPR library screen of DEL line, in an average of 2 repeats. The sgCTRL score represents the average of 100 negative control sgRNAs. (D) Shown are the ranking of all the genes (average of 10 sgRNAs of each gene) enriched in the PD-L1low population of both DEL and Karpas299 lines. Y-axis indicates the distribution of standardized enrichment scores (Z-scores) of each gene enrichment. The dashed lines indicate P = .01. (E) List of top 10 genes enriched in the PD-L1low population of both DEL and Karpas299 lines. Y-axis indicates the distribution of standardized enrichment scores (Z-scores) of each gene enrichment. Green, genes common in both DEL and Karpas299 lines; red, genes in RAS-MEK-ERK pathway; blue, genes in the PI3K-AKT-mTOR pathway.
PD-L1 CRISPR library screen in ALK+ ALCL. (A) Outline of the workflow of the PD-L1 CRISPR library screen in ALK+ ALCL. (B) Overview of the PD-L1 CRISPR library screen results in ALK+ ALCL (2 repeats). Shown are results of all sgRNA enrichment in PD-L1low population [measured by log2(PD-L1low/unsorted)] in DEL line. (C) Shown are the enrichment score [measured by log2(PD-L1low/unsorted)] of the top 10 sgRNAs identified in the PD-L1 CRISPR library screen of DEL line, in an average of 2 repeats. The sgCTRL score represents the average of 100 negative control sgRNAs. (D) Shown are the ranking of all the genes (average of 10 sgRNAs of each gene) enriched in the PD-L1low population of both DEL and Karpas299 lines. Y-axis indicates the distribution of standardized enrichment scores (Z-scores) of each gene enrichment. The dashed lines indicate P = .01. (E) List of top 10 genes enriched in the PD-L1low population of both DEL and Karpas299 lines. Y-axis indicates the distribution of standardized enrichment scores (Z-scores) of each gene enrichment. Green, genes common in both DEL and Karpas299 lines; red, genes in RAS-MEK-ERK pathway; blue, genes in the PI3K-AKT-mTOR pathway.
We then plotted the screen results for all the genes in the library, ranked by enrichment in the PD-L1low populations (average of 10 sgRNAs), and analyzed all the positive hits responsible for PD-L1 upregulation in both the DEL and Karpas299 lines (Figure 1D-E; supplemental Figure 1C). Notably, 4 genes (IRF4, STAT3, SOS1, and GRB2) were common positive hits in both DEL and Karpas299 lines, highlighting their essential roles in upregulating PD-L1 in ALK+ ALCL cells (Figure 1E). In addition to these 4 genes, components of the RAS-MEK-ERK pathway (KRAS, RAF1, SHP2, ERK, and MEK) were positive hits in DEL or Karpas299, whereas components of the PI3K-AKT-MTOR pathway (PIK3CA, MTOR, and RICTOR) were positive hits in Karpas299 (Figure 1E), implicating the MEK-ERK and PI3K-AKT pathways as major oncogenic signaling pathways required for PD-L1 expression in ALK+ ALCL. These findings are consistent with previous results implicating the NPM/ALK chimeric protein as the driving factor for PD-L1 induction, as the JAK-STAT, RAS-MEK, and PI3K-AKT pathways are all downstream of NPM/ALK in these cells11 ; however, our screen also identified the transcription factor IRF4 as a novel gene responsible for PD-L1 regulation.
IRF4 is essential for PD-L1 expression in ALK+ ALCL
Our unbiased PD-L1 CRISPR library screen (Figure 1) revealed the transcription factor IRF4 as a novel regulator of PD-L1 expression in ALK+ ALCL. IRF4 was reported to have elevated expression in the vast majority of primary ALCL cases,22-24 and was found to be essential for ALCL survival.25-27 Consistent with previous reports, depletion of IRF4 expression by 2 individual sgRNAs was highly toxic to all the ALCL lines we tested (supplemental Figure 2A), indicating the efficacy of these sgRNAs.
In a panel of ALK+ ALCL lines, 2 IRF4 sgRNAs significantly impaired surface PD-L1 expression (Figure 2A), verifying the CRISPR library results. Similar results were obtained using a small hairpin RNA (shRNA) targeting IRF4 in DEL and Karpas299 ALCL lines (Figure 2B). Importantly, reexpression of an shRNA-resistant IRF4 cDNA blocked the effect of an IRF4 shRNA on PD-L1 expression, confirming the specificity of this shRNA and indicating that PD-L1 inhibition resulted from on-target suppression of IRF4 (Figure 2B; supplemental Figure 2B). In a time-course analysis, IRF4 sgRNAs suppressed PD-L1 expression at as early as day 2, when no cell growth inhibition was detected, suggesting that IRF4 directly and specifically inhibits PD-L1 expression in these cells (supplemental Figure 2C). Finally, the ability of IRF4 sgRNAs to inhibit PD-L1 expression was confirmed by immunoblot (Figure 2C) and real-time PCR (Figure 2D).
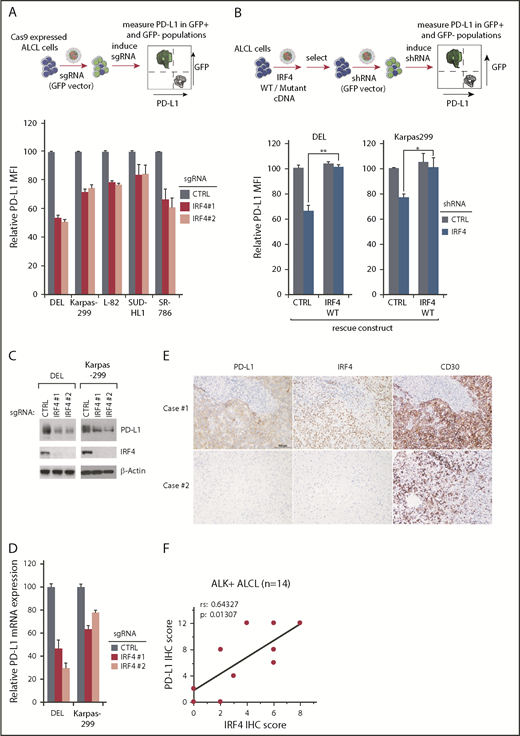
IRF4 regulates PD-L1 expression in ALK+ ALCL. (A) ALCL lines were transduced with IRF4 or Ctrl sgRNAs along with the green fluorescent protein (GFP). Surface PD-L1 expression in transduced (GFP+) cells and sgRNA un-transduced (GFP−) cells were measured by flow cytometry. The relative PD-L1 MFI was normalized to the un-transduced (GFP−) cells. Number of repeats: DEL, n = 10; Karpas299, n = 10; SR786, n = 5; L-82, n = 4; and SUDHL1, n = 4). Error bars denote standard error of the mean (SEM). P < .05 for all the data. (B) DEL and Karpas 299 cells transduced with WT IRF4 or with a control vector, were induced to express control or IRF4 shRNAs along with GFP. Surface PD-L1 expression in uninfected (GFP−) cells and shRNA-infected (GFP+) cells were measured by flow cytometry. The relative PD-L1 MFI was normalized to the uninfected (GFP−) cells. Error bars denote SEM of 4 repeats. **P < .01; *P < .05. (C) ALCL lines were infected with IRF4 or Ctrl sgRNAs, selected and expression induced. Lysates were analyzed by immunoblotting for the indicated proteins. (D) ALCL lines were infected with IRF4 or Ctrl sgRNAs, selected and expression induced, PD-L1 gene expression was measured by real-time PCR. Error bars denote SEM of triplicates. (E) Expression of PD-L1, IRF4, and CD30 in ALK+ ALCL primary cases by IHC. Immunohistochemical PD-L1, IRF4, and CD30 staining are shown in 2 cases. Section of lymph nodes were examined microscopically, using a 200× magnification. The depicted images are representative for the 14 ALK+ ALCL cases examined. (F) Correlation between PD-L1 IHC scores with IRF4 IHC scores, calculated by Spearman's rank correlation methods, in 14 ALK+ ALCL cases.
IRF4 regulates PD-L1 expression in ALK+ ALCL. (A) ALCL lines were transduced with IRF4 or Ctrl sgRNAs along with the green fluorescent protein (GFP). Surface PD-L1 expression in transduced (GFP+) cells and sgRNA un-transduced (GFP−) cells were measured by flow cytometry. The relative PD-L1 MFI was normalized to the un-transduced (GFP−) cells. Number of repeats: DEL, n = 10; Karpas299, n = 10; SR786, n = 5; L-82, n = 4; and SUDHL1, n = 4). Error bars denote standard error of the mean (SEM). P < .05 for all the data. (B) DEL and Karpas 299 cells transduced with WT IRF4 or with a control vector, were induced to express control or IRF4 shRNAs along with GFP. Surface PD-L1 expression in uninfected (GFP−) cells and shRNA-infected (GFP+) cells were measured by flow cytometry. The relative PD-L1 MFI was normalized to the uninfected (GFP−) cells. Error bars denote SEM of 4 repeats. **P < .01; *P < .05. (C) ALCL lines were infected with IRF4 or Ctrl sgRNAs, selected and expression induced. Lysates were analyzed by immunoblotting for the indicated proteins. (D) ALCL lines were infected with IRF4 or Ctrl sgRNAs, selected and expression induced, PD-L1 gene expression was measured by real-time PCR. Error bars denote SEM of triplicates. (E) Expression of PD-L1, IRF4, and CD30 in ALK+ ALCL primary cases by IHC. Immunohistochemical PD-L1, IRF4, and CD30 staining are shown in 2 cases. Section of lymph nodes were examined microscopically, using a 200× magnification. The depicted images are representative for the 14 ALK+ ALCL cases examined. (F) Correlation between PD-L1 IHC scores with IRF4 IHC scores, calculated by Spearman's rank correlation methods, in 14 ALK+ ALCL cases.
We then assessed IRF4 and PD-L1 protein expression, as well as CD30 controls, by immunohistochemistry (IHC) in 14 primary cases diagnosed with ALK+ ALCL (Table 1). Notably, PD-L1 and IRF4 expression were detected in the majority of cases in this cohort, and high PD-L1 expression was significantly more common in IRF4-high cases (Figure 2E). PD-L1 IHC scores correlated well with IRF4 IHC scores (rs = 0.64327; P = .01307; Figure 2F), calculated by Spearman’s rank correlation methods. We conclude that IRF4 is likely to regulate PD-L1 expression in primary ALK+ ALCL tumors.
IHC score (H score) of PD-L1, IRF4 and CD30 in primary ALK+ ALCL cases
| ALCL | Sex | Age, yr | PD-L1 | IRF4 | CD30 | |||||||||
|---|---|---|---|---|---|---|---|---|---|---|---|---|---|---|
| Intensity | Percentage | Percentage stage | H score: intensity × percentage stage | Intensity | Percentage | Percentage stage | H score: intensity × percentage stage | Intensity | Percentage | Percentage stage | H score: intensity × percentage stage | |||
| ALK+ | Male | 38 | 3 | 80% | 4 | 12 | 2 | 85% | 4 | 8 | 2 | 60% | 3 | 6 |
| ALK+ | Male | 17 | 3 | 90% | 4 | 12 | 2 | 70% | 3 | 6 | 3 | 80% | 4 | 12 |
| ALK+ | Female | 7 | 3 | 85% | 4 | 12 | 2 | 30% | 2 | 4 | 3 | 100% | 4 | 12 |
| ALK+ | Male | 23 | 3 | 95% | 4 | 12 | 2 | 35% | 2 | 4 | 3 | 90% | 4 | 12 |
| ALK+ | Male | 33 | 2 | 95% | 4 | 8 | 2 | 50% | 3 | 6 | 3 | 100% | 4 | 12 |
| ALK+ | Female | 21 | 2 | 90% | 4 | 8 | 2 | 5% | 1 | 2 | 2 | 40% | 2 | 4 |
| ALK+ | Male | 20 | 2 | 85% | 4 | 8 | 1 | 25% | 2 | 2 | 3 | 90% | 4 | 12 |
| ALK+ | Female | 10 | 2 | 60% | 3 | 6 | 2 | 50% | 3 | 6 | 3 | 80% | 4 | 12 |
| ALK+ | Female | 30 | 2 | 75% | 3 | 6 | 2 | 50% | 3 | 6 | 3 | 80% | 4 | 12 |
| ALK+ | Male | 58 | 2 | 50% | 2 | 4 | 1 | 60% | 3 | 3 | 3 | 100% | 4 | 12 |
| ALK+ | Female | 14 | 2 | 15% | 1 | 2 | 0 | 0 | 0 | 0 | 2 | 40% | 2 | 4 |
| ALK+ | Male | 27 | 0 | 0 | 0 | 0 | 0 | 0 | 0 | 0 | 2 | 20% | 2 | 4 |
| ALK+ | Female | 39 | 0 | 0 | 0 | 0 | 2 | 5% | 1 | 2 | 2 | 10% | 1 | 2 |
| ALK+ | Female | 39 | 0 | 0 | 0 | 0 | 2 | 10% | 1 | 2 | 3 | 80% | 4 | 12 |
Intensity of staining was evaluated according to the following scale: 0, no staining; 1, weak staining; 2, moderate staining; and 3, strong staining. The percentage score was determined according to the proportion of tumor cells found to express PD-L1. IRF4, or CD30 (percentage stage: 0%, 0; <20%, 1; >20% to <50%, 2; >50% to <75%, 3; >75%, 4) and then multiplied by the staining intensity score to obtain a final semiquantitative H score.
IRF4, together with its cotranscriptional factor BATF3, bind to the enhancer region of the PD-L1 gene
Because IRF4 ablation in ALK+ ALCL lines appears to diminish PD-L1 expression at the mRNA level (Figure 2D), IRF4 is likely to regulate PD-L1 transcription. To test, we generated an IRF4 DNA-binding mutant cDNA19 to test whether its DNA binding is essential. As expected, ectopic expression of the wild-type IRF4 coding region rescued PD-L1 expression from the inhibition of a 3′UTR-directed IRF4 shRNA, whereas the IRF4 DNA-binding mutant cDNA was incapable of doing so (Figure 3A; supplemental Figure 3A), demonstrating that the DNA binding ability of IRF4 is essential in this context.

IRF4 and BATF3 directly regulate PD-L1 transcription in ALK+ ALCL. (A) DEL cells transduced with WT or DNA binding mutant IRF4, or with a control vector, were induced to express control or IRF4 shRNAs along with GFP. Surface PD-L1 expression in uninfected (GFP−) cells and shRNA-infected (GFP+) cells were measured by flow cytometry. IRF4 expression (right) was measured by intracellular flow cytometry. Error bars denote SEM of triplicates. **P < .01. (B) Diagrammatic representation of the AICE motif in PD-L1 predicted enhancer region (up). Chromatin immunoprecipitation from indicated antibodies was subjected to real-time PCR analysis for the PD-L1 enhancer region in DEL and Karpas299 lines (low). Error bars denote SEM of triplicates. (C) ALCL lines were infected with BATF3 or Ctrl sgRNAs, along with GFP. Surface PD-L1 expression in uninfected (GFP−) cells and sgRNA infected (GFP+) cells was measured by flow cytometry. The relative PD-L1 MFI was normalized to the uninfected (GFP−) cells. Error bars denote SEM of 4 repeats. P < .05 for all the data. (D) ALCL lines were infected with BATF3 or Ctrl sgRNAs, selected and induced to expression. Lysates were analyzed by immunoblotting for the indicated proteins. (E) ALCL lines were infected with BATF3 or Ctrl sgRNAs, selected and induced to expression; PD-L1 gene expression was measured by real-time PCR. Error bars denote SEM of triplicates. (F) ALCL lines were infected with BATF3 or Ctrl shRNAs along with GFP. Surface PD-L1 expression in uninfected (GFP−) cells and shRNA-infected (GFP+) cells was measured by flow cytometry. The relative PD-L1 MFI was normalized to the uninfected (GFP−) cells. Error bars denote SEM of triplicates. P < .05 for all the data. One of the represented histogram is shown (right). (G) ALCL lines were infected with BATF3 or Ctrl shRNAs, selected and induced to expression. Lysates were analyzed by immunoblotting for the indicated proteins.
IRF4 and BATF3 directly regulate PD-L1 transcription in ALK+ ALCL. (A) DEL cells transduced with WT or DNA binding mutant IRF4, or with a control vector, were induced to express control or IRF4 shRNAs along with GFP. Surface PD-L1 expression in uninfected (GFP−) cells and shRNA-infected (GFP+) cells were measured by flow cytometry. IRF4 expression (right) was measured by intracellular flow cytometry. Error bars denote SEM of triplicates. **P < .01. (B) Diagrammatic representation of the AICE motif in PD-L1 predicted enhancer region (up). Chromatin immunoprecipitation from indicated antibodies was subjected to real-time PCR analysis for the PD-L1 enhancer region in DEL and Karpas299 lines (low). Error bars denote SEM of triplicates. (C) ALCL lines were infected with BATF3 or Ctrl sgRNAs, along with GFP. Surface PD-L1 expression in uninfected (GFP−) cells and sgRNA infected (GFP+) cells was measured by flow cytometry. The relative PD-L1 MFI was normalized to the uninfected (GFP−) cells. Error bars denote SEM of 4 repeats. P < .05 for all the data. (D) ALCL lines were infected with BATF3 or Ctrl sgRNAs, selected and induced to expression. Lysates were analyzed by immunoblotting for the indicated proteins. (E) ALCL lines were infected with BATF3 or Ctrl sgRNAs, selected and induced to expression; PD-L1 gene expression was measured by real-time PCR. Error bars denote SEM of triplicates. (F) ALCL lines were infected with BATF3 or Ctrl shRNAs along with GFP. Surface PD-L1 expression in uninfected (GFP−) cells and shRNA-infected (GFP+) cells was measured by flow cytometry. The relative PD-L1 MFI was normalized to the uninfected (GFP−) cells. Error bars denote SEM of triplicates. P < .05 for all the data. One of the represented histogram is shown (right). (G) ALCL lines were infected with BATF3 or Ctrl shRNAs, selected and induced to expression. Lysates were analyzed by immunoblotting for the indicated proteins.
IRF4 binds only weakly to DNA unless it associates with other transcriptional factors, such as the basic leucine zipper transcription factor (ATF-like).28-30 A recent study in adult T-cell leukemia/lymphoma demonstrated a key transcription factor complex involving IRF4 and BATF3, which binds to AP1-IRF composite (AICE) DNA motifs.31 Analyses of the PD-L1 gene revealed a highly conserved AICE DNA motif in intron 2, ∼9 kb downstream from the transcription start site (Figure 3B). Of note, this sequence contained a highly conserved IRF4 binding motif (GAAA) and a weak AP-1 binding site (TGTTTCA). Previous chromatin immunoprecipitation-Seq analysis in adult T-cell leukemia/lymphoma cells suggested that IRF4 and BATF3 bind to this predicted PD-L1 AICE motif (supplemental Figure 3B). Consistent with this observation, our chromatin immunoprecipitation-coupled real-time PCR experiments demonstrated that both IRF4 and BATF3 bound avidly to DNA fragments (∼300 bp) containing the candidate PD-L1 enhancer region in DEL and Karpas299 lines (Figure 3B), supporting the hypothesis that IRF4/BATF3 complex bound to the AICE motif in the PD-L1 enhancer.
To investigate the role of BATF3 in regulating PD-L1 expression, we designed 2 sgRNAs against BATF3 and examined their ability to inhibit PD-L1 expression in ALK+ ALCL. Similar to IRF4, ablation of BATF3 using 2 distinct sgRNAs significantly attenuated PD-L1 surface expression (Figure 3C), total protein expression (Figure 3D), and mRNA transcription (Figure 3E). Similar results were obtained using a shRNA targeting BATF3 in ALK+ ALCL lines (Figure 3F-G). Thus, a transcription factor complex involving IRF4 and BATF3 is a central regulatory hub controlling PD-L1 expression in ALK+ ALCL.
GRB2/SOS1 signalosome contributes to PD-L1 induction downstream of ALK-NPM in ALK+ ALCL
In addition to IRF4, 4 other genes were identified as common positive hits from our PD-L1 CRISPR screen: GRB2, SOS1, STAT3, and KRAS/RAF. Although the involvement of STAT3 in PD-L1 regulation is known,12 our screens implicated the GRB2-SOS1-RAF-RAS pathway as a novel mechanism of PD-L1 regulation in ALK+ ALCL. To verify this, we designed sgRNAs targeting GRB2, SOS1, and KRAS and tested their ability to inhibit PD-L1 expression in DEL and Karpas299 cells. In addition to STAT3, depletion of GRB2/SOS1/KRAS expression efficiently reduced PD-L1 surface expression in both DEL and Karpas299 lines (Figure 4A), confirming our screening results. The role of GRB2 and SOS1 sgRNAs in regulating PD-L1 expression was further confirmed by immunoblot (Figure 4B) and by real-time PCR (Figure 4C). All these sgRNAs effectively diminish the expression of their gene target (Figure 4B; supplemental Figure 3C).

GRB2/SOS1 are essential for PD-L1 induction downstream of ALK-NPM. (A) ALCL lines were induced to express indicated sgRNAs along with GFP. Surface PD-L1 expression in uninfected (GFP−) cells and sgRNA-infected (GFP+) cells were measured by flow cytometry. The relative PD-L1 MFI was normalized to the uninfected (GFP−) cells. Number of repeats for sgRNAs: GRB2, n = 8; SOS1, n = 8; KRAS, n = 3; and STAT3, n = 3. Error bars denote SEM. P < .05 for all the data. (B) ALCL lines were infected with GRB2, SOS1, or Ctrl sgRNAs, selected and expression induced. Lysates were analyzed by immunoblotting for the indicated proteins. (C) ALCL lines were infected with GRB2, SOS1, or Ctrl sgRNAs, selected and expression induced. PD-L1 gene expression was measured by real-time PCR. Error bars denote SEM of triplicates. (D) ALK IPs or total lysates from DEL, Karpas299, and FePD cells were immunoblotted for the indicated proteins. (E) ALK IPs or total lysates from DEL and Karpas299 cells treated with ALK inhibitor crizotinib (300 nM) or dimethyl sulfoxide (DMSO) for 24 hours were immunoblotted for the indicated proteins. (F) ALCL cell lines were treated with ALK inhibitor crizotinib for 24 hours at indicated concentrations; surface PD-L1 expression was measured by flow cytometry and normalized to DMSO controls. Error bars denote SEM of triplicates.
GRB2/SOS1 are essential for PD-L1 induction downstream of ALK-NPM. (A) ALCL lines were induced to express indicated sgRNAs along with GFP. Surface PD-L1 expression in uninfected (GFP−) cells and sgRNA-infected (GFP+) cells were measured by flow cytometry. The relative PD-L1 MFI was normalized to the uninfected (GFP−) cells. Number of repeats for sgRNAs: GRB2, n = 8; SOS1, n = 8; KRAS, n = 3; and STAT3, n = 3. Error bars denote SEM. P < .05 for all the data. (B) ALCL lines were infected with GRB2, SOS1, or Ctrl sgRNAs, selected and expression induced. Lysates were analyzed by immunoblotting for the indicated proteins. (C) ALCL lines were infected with GRB2, SOS1, or Ctrl sgRNAs, selected and expression induced. PD-L1 gene expression was measured by real-time PCR. Error bars denote SEM of triplicates. (D) ALK IPs or total lysates from DEL, Karpas299, and FePD cells were immunoblotted for the indicated proteins. (E) ALK IPs or total lysates from DEL and Karpas299 cells treated with ALK inhibitor crizotinib (300 nM) or dimethyl sulfoxide (DMSO) for 24 hours were immunoblotted for the indicated proteins. (F) ALCL cell lines were treated with ALK inhibitor crizotinib for 24 hours at indicated concentrations; surface PD-L1 expression was measured by flow cytometry and normalized to DMSO controls. Error bars denote SEM of triplicates.
Using sgRNAs, depletion of both GRB2 and SOS1 was highly toxic to all ALK+ ALCL lines tested, but had little effect in ALK-negative ALCL lines (supplemental Figure 4A), suggesting the GRB2/SOS1complex plays an important role in transmitting signals emanating from the NPM-ALK fusion. In support, GRB2 and SOS1 ablation had no effect on the PD-L1 expression in ALK-negative ALCL lines, indicating that their role in regulating PD-L1 expression is ALK-dependent (supplemental Figure 4B-C). In fact, in ALK+ lines, GRB2 and SOS1 bound constitutively to NPM-ALK (Figure 4D), in line with previous studies.32,33 Furthermore, this association was highly dependent on ALK kinase activity, as the ALK kinase small molecular inhibitor crizotinib markedly diminished the interaction between ALK and GRB2 and SOS1 (Figure 4E). ALK kinase inhibition using crizotinib also strongly inhibited PD-L1 surface expression and mRNA transcription in ALK+ ALCL lines (Figure 4F; supplemental Figure 5A). In addition, ectopic expression of ALK WT cDNA in lymphoma cell line L428 strongly induced PD-L1 expression, whereas the kinase dead mutant cDNA (K210R) was incapable of doing so (supplemental Figure 5B, left), consistent with the crizotinib results. Similar to Figure 4E, the kinase dead ALK mutant also lost the ability of binding to SOS1 (supplemental Figure 5B, right), suggesting that the interaction of ALK to SOS1/GRB2 signalosome is critical. Together, these data suggest that the signalosome complex containing GRB2 and SOS1 is an essential mediator regulating PD-L1 expression ALK+ ALCL, downstream of NPM-ALK.
GRB2, SOS1, and STAT3 contribute to IRF4/BATF3 expression in ALK+ ALCL
Given that IRF4, BATF3, GRB2, SOS1, and STAT3 are all required to maintain the elevated PD-L1 expression in ALK+ ALCL, we sought to understand the epistatic relationships between these key factors. Previous work suggested that NPM-ALK signaling promotes IRF4 expression.25,34 In our studies, treatment of a panel of ALK+ ALCL lines with crizotinib significantly downregulated IRF4 expression measured by intracellular flow cytometry and immunoblot (Figure 5A; supplemental Figure 5C). Similarly, crizotinib treatment also considerably downregulated BATF3 expression in all the ALK+ ALCL lines tested (Figure 5B). Consistently, 2 specific ALK shRNAs also significantly inhibited PD-L1 surface expression, as well as IRF4 and BATF3 expression in ALK+ ALCL lines (supplemental Figure 5D-E). Notably, ectopic expression of both IRF4 and BATF3 coding region significantly rescued PD-L1 expression in crizotinib treated cells (supplemental Figure 6A). Furthermore, the binding of both IRF4 and BATF3 to the PD-L1 enhancer region was markedly reduced by crizotinib treatment of Karpas299 cells (Figure 5C). Together, these data suggest that crizotinib downregulates PD-L1 expression at least partially as a result of suppression of IRF4 and BATF3 in ALK+ ALCL.

Regulatory network for IRF4/BATF3 expression in ALK+ ALCL. (A) Indicated ALCL cell lines were treated with ALK inhibitor crizotinib for 24 hours at indicated concentrations and IRF4 expression was measured by intracellular flow cytometry and normalized to DMSO controls. (B) Indicated ALCL cell lines were treated with ALK inhibitor crizotinib for 24 hours at indicated concentrations. Lysates were analyzed by immunoblotting for the indicated proteins. (C) Karpas299 cells treated with ALK inhibitor crizotinib (300 nM) for 24 hours or untreated. Chromatin immunoprecipitation from indicated antibodies was subjected to real-time PCR analysis for PD-L1 locus. (D) ALCL lines were induced to express indicated sgRNAs along with GFP. Intracellular IRF4 expression in uninfected (GFP−) cells and sgRNA-infected (GFP+) cells were measured by flow cytometry. The relative IRF4 MFI was normalized to the uninfected (GFP−) cells. (E) DEL and Karpas299 lines were infected with GRB2, SOSO1, or Ctrl sgRNAs, selected and induced to expression. Lysates were analyzed by immunoblotting for the indicated proteins. (F) DEL and Karpas299 cells transduced with WT IRF4 or with a control vector were induced to express control or indicated sgRNAs along with GFP. Surface PD-L1 expression in sgRNA uninfected (GFP−) cells and sgRNA-infected (GFP+) cells were measured by flow cytometry. The relative PD-L1 MFI of sgRNA-infected (GFP+) cells was normalized to sgRNA uninfected (GFP−) cells. Error bars denote SEM of triplicates. *P < .05; **P < .01; n.s indicates no statistically significant difference. (G) DEL and Karpas299 lines were infected with STAT3 or Ctrl sgRNAs, selected and induced to expression. Lysates were analyzed by immunoblotting for the indicated proteins. All error bars denote SEM of triplicates.
Regulatory network for IRF4/BATF3 expression in ALK+ ALCL. (A) Indicated ALCL cell lines were treated with ALK inhibitor crizotinib for 24 hours at indicated concentrations and IRF4 expression was measured by intracellular flow cytometry and normalized to DMSO controls. (B) Indicated ALCL cell lines were treated with ALK inhibitor crizotinib for 24 hours at indicated concentrations. Lysates were analyzed by immunoblotting for the indicated proteins. (C) Karpas299 cells treated with ALK inhibitor crizotinib (300 nM) for 24 hours or untreated. Chromatin immunoprecipitation from indicated antibodies was subjected to real-time PCR analysis for PD-L1 locus. (D) ALCL lines were induced to express indicated sgRNAs along with GFP. Intracellular IRF4 expression in uninfected (GFP−) cells and sgRNA-infected (GFP+) cells were measured by flow cytometry. The relative IRF4 MFI was normalized to the uninfected (GFP−) cells. (E) DEL and Karpas299 lines were infected with GRB2, SOSO1, or Ctrl sgRNAs, selected and induced to expression. Lysates were analyzed by immunoblotting for the indicated proteins. (F) DEL and Karpas299 cells transduced with WT IRF4 or with a control vector were induced to express control or indicated sgRNAs along with GFP. Surface PD-L1 expression in sgRNA uninfected (GFP−) cells and sgRNA-infected (GFP+) cells were measured by flow cytometry. The relative PD-L1 MFI of sgRNA-infected (GFP+) cells was normalized to sgRNA uninfected (GFP−) cells. Error bars denote SEM of triplicates. *P < .05; **P < .01; n.s indicates no statistically significant difference. (G) DEL and Karpas299 lines were infected with STAT3 or Ctrl sgRNAs, selected and induced to expression. Lysates were analyzed by immunoblotting for the indicated proteins. All error bars denote SEM of triplicates.
We next investigated the mechanism by which the NPM-ALK oncoprotein regulates IRF4 and BATF3 expression in ALK+ ALCL. STAT3 has been shown to upregulate IRF4 protein expression in ALCL.27,34 However, in addition to STAT3, the GRB2/SOS1 signalosome complex is also downstream of NPM-ALK, and could contribute to IRF4 expression. To address these possibilities, we assessed the effect on IRF4 expression by intracellular flow cytometry in GRB2, SOS1, or STAT3 sgRNAs transduced ALK+ ALCL lines (Figure 5D). STAT3 depletion downregulated IRF4 expression in 2 of the lines (SUDHL1 and SR-786), but not in the other 3 (DEL, Karpas299, and L-82). In contrast, depletion of GRB2 or SOS1 significantly impaired IRF4 expression in DEL, Karpas299, L-82, and SUDHL1, but not in SR786 cells (Figure 5D). The ability of GRB2 and SOS1 sgRNAs to inhibit IRF4 expression was further confirmed by immunoblot and real-time PCR analysis in DEL and Karpas299 lines (Figure 5E; supplemental Figure 6B). Therefore, although STAT3 regulates IRF4 expression in some lines, the NPM-ALK-dependent GRB2/SOS1 signalosome contributes to IRF4 expression in a majority of ALK+ ALCL lines.
To further investigate whether GRB2/SOS1 regulates PD-L1 expression by upregulating IRF4, we examined the ability of ectopic expression of the IRF4 coding region to rescue PD-L1 expression in GRB2, SOS1, or STAT3 depleted cells (Figure 5F; supplemental Figure 6C). In both DEL and Karpas299 cells, ectopic expression of IRF4 partially rescued PD-L1 expression in GRB2 and SOS1 knockout cells, but not in STAT3 knockout cells (Figure 5F). Therefore, IRF4 is functional downstream, and is at least partially responsible for GRB2/SOS1-mediated PD-L1 upregulation in these lines.
GRB2/SOS1 mediates ERK and AKT activation, which leads to IRF4 expression in ALK+ ALCL
Among the signaling pathways enriched in our PD-L1 CRISPR library screening, the RAS-MEK-ERK and PI3K-AKT-MTOR pathways were the most significant (Figure 1E). Indeed, in RTK pathways, SOS1/GRB2 signalosome is able to activate RAS-ERK and AKT pathways.35 In ALK+ ALCL lines, ablation of GRB2 or SOS1 strongly inhibited both ERK and AKT activation (Figure 6A), raising the possibility that both of these pathways were contributing to PD-L1 and IRF4 expression. Indeed, a highly specific MEK inhibitor, PD0325901, inhibited PD-L1 expression in all ALK+ ALCL lines tested (Figure 6B, left). In a similar manner, the PI3K/mTOR dual-inhibitor BEZ235 inhibited PD-L1 expression in most of the ALK+ ALCL lines, but had only a limited effect of PD-L1 expression in DEL (Figure 6B, right), consistent with the results of our CSRIPR library screen (Figure 1E). Similar results were achieved by assessing PD-L1 mRNA expression (supplemental Figure 7A). Therefore, both ERK and AKT activity contribute to PD-L1 expression in ALK+ ALCL, and are engaged by the GRB2/SOS1 signalosome downstream of NPM-ALK.
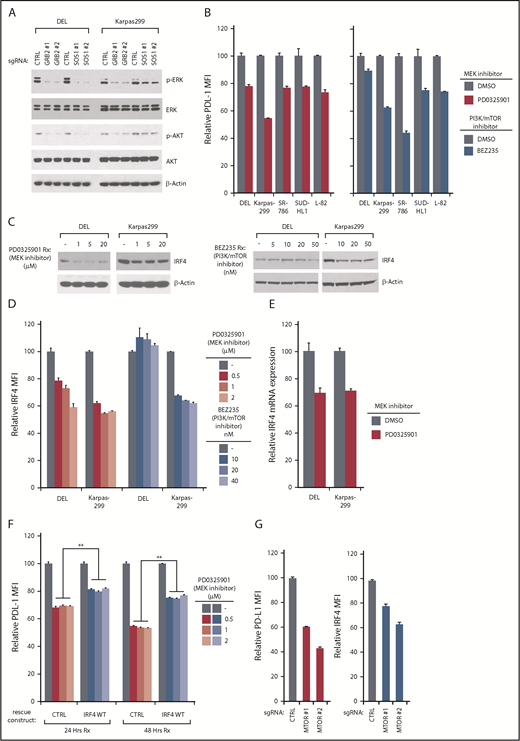
PD-L1/ IRF4 expression are dependent on ERK and AKT signaling. (A) DEL and Karpas299 lines were infected with GRB2, SOSO1, or Ctrl sgRNAs, selected and induced to expression. Lysates were analyzed by immunoblotting for the indicated proteins. (B) Indicated ALCL cell lines were treated with MEK inhibitor PD0325901 (10 μM), and PI3K/mTOR dual inhibitor BEZ235 (10 nM) for 24 hours, surface PD-L1 expression was measured by flow cytometry. Error bars denote SEM of triplicates. (C) DEL and Karpas299 cells were treated with MEK inhibitor PD0325901 and PI3K/mTOR dual inhibitor BEZ235 at indicated concentrations for 48 hours. Lysates were analyzed by immunoblotting for the indicated proteins. (D) DEL and Karpas299 cells were treated with MEK inhibitor PD0325901 and PI3K/mTOR dual inhibitor BEZ235 at indicated concentrations for 48 hours. IRF4 expression was measured by intracellular flow cytometry and normalized to DMSO controls. Error bars denote SEM of triplicates. (E) DEL and Karpas299 cells were treated with MEK inhibitor PD0325901 (1 μM) for 4 hours. IRF4 gene expression was measured by real-time PCR. Error bars denote SEM of triplicates. (F) DEL and Karpas299 cells transduced with WT IRF4 or with a control vector were treated with MEK inhibitor PD0325901 at indicated concentrations for 24 and 48 hours. Surface PD-L1 expression in treated and untreated (DMSO) cells were measured by flow cytometry. The relative PD-L1 MFI was normalized to untreated (DMSO) cells. Error bars denote SEM of triplicates. **P < .01. (G) Karpas299 cells were induced to express MTOR or Ctrl sgRNAs along with GFP. Intracellular IRF4 and surface PD-L1 expression in uninfected (GFP−) cells and sgRNA infected (GFP+) cells were measured by flow cytometry. The relative PD-L1 and IRF4 MFI was normalized to the uninfected (GFP−) cells. Error bars denote SEM of 4 repeats. P < .05 for all the data.
PD-L1/ IRF4 expression are dependent on ERK and AKT signaling. (A) DEL and Karpas299 lines were infected with GRB2, SOSO1, or Ctrl sgRNAs, selected and induced to expression. Lysates were analyzed by immunoblotting for the indicated proteins. (B) Indicated ALCL cell lines were treated with MEK inhibitor PD0325901 (10 μM), and PI3K/mTOR dual inhibitor BEZ235 (10 nM) for 24 hours, surface PD-L1 expression was measured by flow cytometry. Error bars denote SEM of triplicates. (C) DEL and Karpas299 cells were treated with MEK inhibitor PD0325901 and PI3K/mTOR dual inhibitor BEZ235 at indicated concentrations for 48 hours. Lysates were analyzed by immunoblotting for the indicated proteins. (D) DEL and Karpas299 cells were treated with MEK inhibitor PD0325901 and PI3K/mTOR dual inhibitor BEZ235 at indicated concentrations for 48 hours. IRF4 expression was measured by intracellular flow cytometry and normalized to DMSO controls. Error bars denote SEM of triplicates. (E) DEL and Karpas299 cells were treated with MEK inhibitor PD0325901 (1 μM) for 4 hours. IRF4 gene expression was measured by real-time PCR. Error bars denote SEM of triplicates. (F) DEL and Karpas299 cells transduced with WT IRF4 or with a control vector were treated with MEK inhibitor PD0325901 at indicated concentrations for 24 and 48 hours. Surface PD-L1 expression in treated and untreated (DMSO) cells were measured by flow cytometry. The relative PD-L1 MFI was normalized to untreated (DMSO) cells. Error bars denote SEM of triplicates. **P < .01. (G) Karpas299 cells were induced to express MTOR or Ctrl sgRNAs along with GFP. Intracellular IRF4 and surface PD-L1 expression in uninfected (GFP−) cells and sgRNA infected (GFP+) cells were measured by flow cytometry. The relative PD-L1 and IRF4 MFI was normalized to the uninfected (GFP−) cells. Error bars denote SEM of 4 repeats. P < .05 for all the data.
We next investigated whether ERK or AKT activity are required for IRF4 expression in ALK+ ALCL. Of note, the MEK inhibitor PD0325901 significantly suppressed IRF4 expression in both DEL and Karpas299 cells, measured by IRF4 immunoblot and intracellular flow cytometry staining (Figure 6C-D, left). These results were confirmed by real-time PCR analysis (Figure 6E). Notably, ectopic expression of IRF4 coding region significantly rescued PD-L1 expression in PD0325901-treated cells (Figure 6F). Thus, MEK-ERK pathway regulates PD-L1 expression by upregulating IRF4.
Meanwhile, the PI3K/mTOR dual-inhibitor BEZ235 inhibited IRF4 expression as well, but only in the Karpas299 line (Figure 6C-D, right), which is also consistent with our CRISPR screen results in which PD-L1 expression is uniquely dependent on PI3K-AKT signaling in the Karpas299 line (Figures 1E and 6B). To further confirm, we designed 2 mTOR sgRNAs to probe the pathway function genetically (supplemental Figure 7B). Knocking out mTOR inhibited PD-L1 expression in Karpas299 cells (Figure 6G), and importantly, IRF4 expression was also decreased in mTOR-depleted cells (Figure 6G), in line with our drug studies.
IRF4, GRB2, and SOS1 regulate immunosuppression and immune escape in ALK+ ALCL
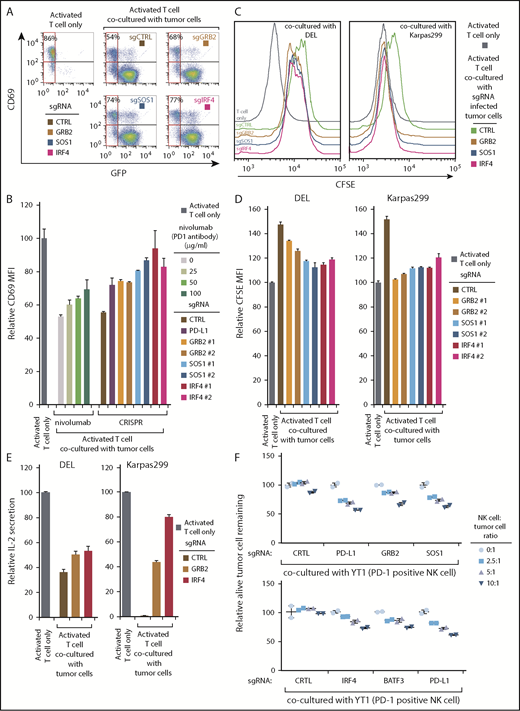
The success of anti PD-1 or PD-L1 checkpoint therapies relies on their ability to promote anti-tumor T-cell immunity.36 Therefore, we established a Jurkat T-cell line constitutively expressing the PD-L1 receptor PD-1 in the surface (supplemental Figure 7C) and used coculture experiments with ALK+ ALCL cells to evaluate the effects of IRF4, GRB2, and SOS1 depletion on T-cell activation and proliferation. Coculture of PD-1-expressing Jurkat T cells with DEL cells inhibited induction of the T-cell activation marker CD69 (Figure 7A), as expected. When we deleted PD-L1 expression using sgRNAs in the tumor cells, or treated the culture with the clinically employed anti-PD1 antibody nivolumab, T-cell activation was restored (Figure 7B). Importantly, the tumor cells depleted of IRF4, GRB2, or SOS1 failed to inhibit T-cell activation to a similar degree as with PD-L1 depletion or the presence of nivolumab (Fig. 7A and B). Similar effects were also observed in Karpas299 cells (supplemental Figure 7D).
GRB2, SOS1, and IRF4 are required for ALK+ ALCL immunosuppression. (A) ALCL line DEL was infected with GRB2, SOSO1, IRF4, or Ctrl sgRNAs along with GFP, selected and induced to expression, after coculture with PD-1 expressing Jurkat T cells (GFP−; tumor: T cell ratio = 3:1) for 24 hours. T-cell activation was measured by CD69 expression. Shown are the percentage of CD69-positive T cells (GFP−) in each coculture condition. (B) PD-1-expressed Jurkat T cells were cocultured with ALCL cells (DEL) in the presence of indicated concentration of PD1 antibody nivolumab or with DEL infected with PD-L1, GRB2, SOSO1, IRF4, or Ctrl sgRNAs for 24 hours. Relative CD69 expression was measured by flow cytometry and normalized to the activated T-cell-only controls. Tumor: T-cell ratio = 3:1. (C-D) ALCL lines DEL and Karppas299 were infected with indicated sgRNAs, selected and induced to expression, after coculture with PD-1-expressed Jurkat T cells for 4 days. T-cell proliferation was measured by CFSE level. Shown are the CFSE staining histogram (C) and the relative CFSE MFI normalized to the activated T-cell-only controls (D). Tumor: T-cell ratio = 3:1. (E) ALCL lines DEL and Karppas299 were infected with indicated sgRNAs, selected and induced to expression, after being cocultured with PD-1 expressed Jurkat T cells. The IL-2 section was measured by ELISA and normalized to activated T-cell-only controls. Tumor: T-cell ratio = 3:1. (F) DEL line was infected with indicated sgRNAs, selected and induced to expression, after coculture with PD-1-positive NK cell line YT1 at the indicated ratio. The relative viable tumor cells remaining was shown. All error bars denote SEM of triplicates in panels B, D, and E, and SEM of duplicates in panel F.
GRB2, SOS1, and IRF4 are required for ALK+ ALCL immunosuppression. (A) ALCL line DEL was infected with GRB2, SOSO1, IRF4, or Ctrl sgRNAs along with GFP, selected and induced to expression, after coculture with PD-1 expressing Jurkat T cells (GFP−; tumor: T cell ratio = 3:1) for 24 hours. T-cell activation was measured by CD69 expression. Shown are the percentage of CD69-positive T cells (GFP−) in each coculture condition. (B) PD-1-expressed Jurkat T cells were cocultured with ALCL cells (DEL) in the presence of indicated concentration of PD1 antibody nivolumab or with DEL infected with PD-L1, GRB2, SOSO1, IRF4, or Ctrl sgRNAs for 24 hours. Relative CD69 expression was measured by flow cytometry and normalized to the activated T-cell-only controls. Tumor: T-cell ratio = 3:1. (C-D) ALCL lines DEL and Karppas299 were infected with indicated sgRNAs, selected and induced to expression, after coculture with PD-1-expressed Jurkat T cells for 4 days. T-cell proliferation was measured by CFSE level. Shown are the CFSE staining histogram (C) and the relative CFSE MFI normalized to the activated T-cell-only controls (D). Tumor: T-cell ratio = 3:1. (E) ALCL lines DEL and Karppas299 were infected with indicated sgRNAs, selected and induced to expression, after being cocultured with PD-1 expressed Jurkat T cells. The IL-2 section was measured by ELISA and normalized to activated T-cell-only controls. Tumor: T-cell ratio = 3:1. (F) DEL line was infected with indicated sgRNAs, selected and induced to expression, after coculture with PD-1-positive NK cell line YT1 at the indicated ratio. The relative viable tumor cells remaining was shown. All error bars denote SEM of triplicates in panels B, D, and E, and SEM of duplicates in panel F.
The PD-1/PD-L1 pathway inhibits T-cell proliferation by reducing interleukin-2 production and restricting T-cell cycle progression.37 We therefore used the carboxyfluorescein diacetate succinimidyl ester (CFSE)-based T-cell proliferation assay to examine the effect of IRF4, GRB2, and SOS1 depletion on T-cell proliferation. When cocultured with PD1-expressing Jurkat T cells, both DEL and Karpas299 cells reduced T-cell proliferation, but depletion of IRF4, GRB2, or SOS1 in the ALCL cells significantly prevented this inhibition (Figure 7C-D). Consistent with these results, DEL or Karpas299 depleted of IRF4, GRB2, or SOS1 failed to inhibit interleukin-2 secretion by PD1-expressing Jurkat cells (Figure 7E; supplemental Figure 7E).
Finally, we investigated the effect of natural killer (NK) cell-mediated killing in the coculture system. The PD1-positive NK cell line YT1 was cocultured with DEL cells, and the YT1 cell cytotoxicity was determine by counting the remaining live ALCL cells. As expected, depletion of PD-L1 in DEL cells restored NK cell cytotoxicity (Figure 7F). Importantly, depletion of GRB2, SOS1, IRF4, or BATF3 permitted NK cell cytotoxicity to a degree similar to that of PD-L1 knockout cells (Figure 7F).
Discussion
We used an unbiased high-throughput CRISPR library screening technology to uncover the novel mechanisms of PD-L1 regulation in ALK+ ALCL. This effort provided a comprehensive understanding of the major oncogenic signaling processes supporting PD-L1 expression in these tumor cells and revealed a novel role for the transcription factor IRF4 in PD-L1 upregulation of ALK+ ALCL, acting together with its transcriptional co-factor BATF3. Interestingly, this transcription hub is tightly regulated by a signaling network downstream of the NPM-ALK oncoprotein, including STAT3 and the GRB2/SOS1 signalosome, which engages the MEK-ERK and PI3K-AKT pathways (supplemental Figure 8). Targeting this oncogenic signaling cascade significantly attenuated the capacity of ALK+ ALCL cells to suppress the function of PD-1-positive T cells and NK cells through PD-L1. Together, our findings provide for the first time a broad understanding of the oncogenic signaling cascade responsible for upregulation of PD-L1 in ALK+ ALCL and suggest new strategies to improve immunotherapy efficacy.
Several transcription factors that directly regulate PD-L1 transcription have been identified, including MYC,38 HIF-1α/HIF-2α,39,40 STAT3,12,15,41 the NF-κB subunit RELA,42-44 and the AP-1 family members cJUN and JUNB.45 Here we report a critical role for a novel transcription factor complex comprising IRF4 and BATF3 that can directly regulate PD-L1 transcription in T lymphoma. Although other TFs bind to the PD-L1 promotor region, IRF4 and BATF3 bind the AICE motif, which is located in the second intron (+9082 to +9092) of the PD-L1 gene, suggesting that region harbors a PD-L1 transcriptional enhancer. Moreover, in a recent study in melanoma, manipulation of IRF4 levels followed by interferon γ stimulation regulates PD-L1 expression.46 Thus, it is conceivable that this IRF4/BATF3 complex may cooperate with transcription factors such as STAT3 that are bound to the PD-L1 promoter, to achieve optimal and full expression of PD-L1.
Despite the essential oncogenic role, the molecular mechanisms leading to IRF4 upregulation in lymphoma remain incompletely understood. STAT3 certainly played a crucial role in supporting IRF4 expression in ALCL,27,34 as suggested by previous studies27,34 and our results. In addition, our analysis also revealed a novel mechanism of IRF4 regulation in ALK+ ALCL mediated by the ALK/GRB2/SOS1 signalosome, which engages downstream the MEK-ERK and PI3K-AKT signaling pathways. Nevertheless, STAT3 was identified as playing a key role in regulating PD-L1 expression in both cell lines employed in our CRISPR screen. This may result from its capacity to sustain the cofactor of IRF4, BATF3 (Figure 5). Therefore, STAT3 regulation of PD-L1 expression in ALK+ ALCL could be mediated by distinctive mechanisms: either through direct transcriptional regulation or indirectly through the IRF4-BATF3 complex. Similarly, a recent study also suggested that IRF4 is downstream of NF-κB in some ALCL lines.24 Nevertheless, the NF-κB subunits were not hits in our PD-L1 CRISPR library screens (Figure 1), although this could also be a result of redundancy of the NF-κB factors. This presumably also occurs because ALK-mediated signaling is sufficient to induce IRF4 even in the absence of contributions from NF-κB. Future work should explicate the intricate mechanisms that regulate the key transcription factor IRF4 and assess the relative importance of this collection of potential signaling pathways in maintaining IRF4 expression.
PD-1/PD-L1blockade are currently being examined in multiple non-Hodgkin lymphoma subtypes, including T-cell lymphoma. A recent phase 1 study using the anti-PD-1 monoclonal antibody nivolumab provided encouraging evidence.47 From this perspective, targeting the signaling pathways identified in this study that control IRF4 and BATF3 would be an attractive strategy to improve immunotherapy efficacy. Of note, ALK gene rearrangements also occur in approximately 5% of patients with nonsmall cell lung cancer, commonly in an EML4-ALK fusion. Interestingly, EML4-ALK oncoprotein promotes PD-L1 induction in a MEK-ERK- and PI3K-AKT-dependent manner, similar to NPM-ALK. Therefore, it is reasonable to predict that IRF4 might play an essential role in this context as well. In this regard, although direct IRF4 inhibitors are not currently clinically available, drugs targeting ALK or ERK activity could effectively cooperate with clinically used PD-1/PD-L1blockade in a IRF4-dependent manner for patients suffering from ALK+ diseases.
The online version of this article contains a data supplement.
The publication costs of this article were defrayed in part by page charge payment. Therefore, and solely to indicate this fact, this article is hereby marked “advertisement” in accordance with 18 USC section 1734.
Data will be made available from the time of publication. Primary data will be made available to other researchers upon reasonable request (email to the corresponding author) within a reasonable timescale.
Acknowledgments
The authors thank the patients for their participation. They thank J. D. Phelan (National Institutes of Health [NIH],National Cancer Institute) and Y. Xin (NIH National Cancer Institute) for help with the CRISPR library design, D. L. Wiest (Fox Chase Cancer Center) and J. Font-Burgada (Fox Chase Cancer Center) for discussions and comments. The authors also thank Alan L. Epstein (Keck School of Medicine of the University of Southern California) for the TLBR1 and TLBR2 cell lines, Annarosa Del Mistro (The Veneto Institute of Oncology) for the FE-PD cell line, and Megan S. Lim (University of Pennsylvania) for the NPM-ALK WT and K210R cDNA.
This research was supported by NIH National Cancer Institute grant K22 CA197014 (Y.Y), American Cancer Society grant IRG-92-027-21 (Y.Y), Grant-in-Aid for Scientific Research C (18K08313 [M.N.]), and the Medical Research grant from the W. W. SMITH Charitable Trust (Y.Y). This research was also funded through the NIH National Cancer Institute Cancer Center Support grant P30 CA006927.
Authorship
Contribution: J.-P.Z., Z.S., H.-B.W., L.L., Y.-Z.Y., and W.W. performed experiments and collected data; J.-P.Z., M.N., and Y.Y. analyzed and interpreted the data; W.X. analyzed library sequencing data; D.E.W., S.K.B., M.E.K., and L.M.S., provided technical support and critical materials; M.E.K. and L.M.S. revised the manuscript; M.N. and Y.Y. designed and oversaw the project; and Y.Y., wrote the manuscript.
Conflict-of-interest disclosure: The authors declare no competing financial interests.
Correspondence: Yibin Yang, Fox Chase Cancer Center, 333 Cottman Ave, Philadelphia, PA 19111; e-mail: yibin.yang@fccc.edu; and Masao Nakagawa, Hokkaido University Faculty of Medicine, Sapporo, Japan; e-mail: nakagawam@med.hokudai.ac.jp.

This feature is available to Subscribers Only
Sign In or Create an Account Close Modal