

Key Points
Reprogramming identifies clonal history and recapitulates disease progression in individual patients with MDS.
Mitochondrial function and chromosome stability are key pathways affected by acquisition of mutations in MDS.

Abstract
Myeloid neoplasms, including myelodysplastic syndromes (MDS), are genetically heterogeneous disorders driven by clonal acquisition of somatic mutations in hematopoietic stem and progenitor cells (HPCs). The order of premalignant mutations and their impact on HPC self-renewal and differentiation remain poorly understood. We show that episomal reprogramming of MDS patient samples generates induced pluripotent stem cells from single premalignant cells with a partial complement of mutations, directly informing the temporal order of mutations in the individual patient. Reprogramming preferentially captured early subclones with fewer mutations, which were rare among single patient cells. To evaluate the functional impact of clonal evolution in individual patients, we differentiated isogenic MDS induced pluripotent stem cells harboring up to 4 successive clonal abnormalities recapitulating a progressive decrease in hematopoietic differentiation potential. SF3B1, in concert with epigenetic mutations, perturbed mitochondrial function leading to accumulation of damaged mitochondria during disease progression, resulting in apoptosis and ineffective erythropoiesis. Reprogramming also informed the order of premalignant mutations in patients with complex karyotype and identified 5q deletion as an early cytogenetic anomaly. The loss of chromosome 5q cooperated with TP53 mutations to perturb genome stability, promoting acquisition of structural and karyotypic abnormalities. Reprogramming thus enables molecular and functional interrogation of preleukemic clonal evolution, identifying mitochondrial function and chromosome stability as key pathways affected by acquisition of somatic mutations in MDS.
Introduction
Cancer can be viewed as a Darwinian evolutionary process driven by acquisition of somatic mutations and subclonal selection.1 Hematologic malignancy is often preceded by a period of clonal evolution, or clonal hematopoiesis (CH), during which hematopoietic stem and progenitors accumulate oncogenic mutations.2,3 These early preleukemic events confer increased self-renewal and acquire cooperating mutations. Myelodysplastic syndrome (MDS), often the first clinical diagnosis, is characterized by clonal stem cell expansion and impaired differentiation into one or more myeloid cell lineage. The identity and prognostic significance of recurrent oncogenic changes in MDS are relatively well established.4 These include point mutations in epigenetic regulators (eg, TET2, DNMT3A), the spliceosome (eg, SF3B1, SRSF2), transcription factors, signaling pathways, and DNA damage response genes (eg, TP53). Cytogenetic changes, including loss of chromosome 5q [del(5q)], 7q, monosomy 7, and trisomy 8, among others, are found in >50% of cases of MDS.5 At diagnosis, patients often harbor several of these abnormalities, making it difficult to reconstruct trajectories of somatic evolution. As a result, the order in which genetic changes are acquired and their functional consequences on hematopoietic stem and progenitor cell (HPC) self-renewal and differentiation remain incompletely understood.
The order of acquisition of pathogenic mutations has a profound clinical impact.6 Several strategies have been used to identify and order clonal events. Whole-genome or whole-exome sequencing (WGS/WES) has been extensively used to track and quantify disease alleles.7,8 Although WGS does not inform clonal history of mutations, it can be inferred by correlating mutant allele frequencies. WGS is not informative, however, if mutations are rare or fully clonal, typified by early disease mutations shared by all malignant cells. Tracking mutant alleles over multiple longitudinal samples from the same patient can help resolve patterns of clonal progression,9 although in most clinical cases, only a single patient sample is available. Mutations found in CH, most commonly DNMT3A, TET2, and ASXL1, are predicted to be disease-initiating.10 However, these mutations are not found in some patients, whereas multiple CH-associated mutations can occur in others. Single-cell methods enable more direct assessment of clonal composition.11 However, because early subclones are outcompeted by more malignant descendants, they may be rare and difficult to detect directly. More fundamentally, current approaches do not enable both molecular identification and a functional assessment of individual cells, making it difficult to study how acquisition of mutations affects HPC self-renewal, differentiation, and response to treatment.
Yamanaka factors Oct4, Sox2, Klf4, and Myc (OSKM) reprogram a somatic cell into an induced pluripotent stem cell (iPSC), which retains the somatic cell genome, including any somatic mutations.12 iPSC colonies thus capture somatic genomes of single cells, providing a sampling of cellular heterogeneity. iPSCs can be clonally expanded and differentiated into HPCs, enabling direct functional assessment of individual subclones.13 Individual mutations can be gene corrected, enabling interrogation of their causative role. Thus, reprogramming enables molecular and functional interrogation of single patient cells.
Cancer cells can be reprogrammed to pluripotency and retain tumorigenic potential upon differentiation.14,15 More recently, MDS and acute myeloid leukemia (AML) patient samples have been reprogrammed, although in most cases a single subclone was captured from each patient.16,17 In one notable case, KRAS wild-type and mutant subclones were reprogrammed from a patient with AML exhibiting outgrowth of the wild-type allele during relapse.17 Samples from patients with more advanced MDS showed decreased efficiency of differentiation to HPCs corresponding to a progressive block in differentiation.16 However, it has been challenging to generate isogenic iPSC lines harboring different oncogenic mutations to provide insights into mechanisms of disease evolution.
Here we show that episomal reprogramming of MDS patient samples generates iPSCs from rare preleukemic cells with a partial complement of mutations, informing somatic mutation order in individual patients. Reprogramming identified the earliest clonal intermediates, which were rarely detected among single patient cells. We used this strategy to establish the order of mutations and gain insight into how sequential acquisition of mutations contributes to disease. We show that mutations in SF3B1 found in ∼20% of MDS18 could occur as a second hit that perturbed mitochondrial function and erythroid differentiation. In a patient with MDS with complex karyotype, we identified del(5q) as an early cytogenetic lesion that perturbed genome stability and differentiation. The current study illustrates the broad utility of reprogramming in understanding leukemic progression.
Methods
Patient samples and reprogramming
Bone marrow and peripheral blood mononuclear cells were obtained from patients according to the institutional guidelines approved by the University of Washington and Fred Hutchinson Cancer Center Institutional Review Board. A complete list of samples is listed in supplemental Table 1 (available on the Blood Web site). For Sendai, cells were reprogrammed by using the Cytotune iPS Sendai Reprogramming Kit (Thermo Fisher Scientific) following the manufacturer’s instructions. The episomal reprogramming protocol was developed based on the methods of Okita et al19 and is detailed in the supplemental Methods.
iPSC culture
iPSCs were maintained on Matrigel (BD) in mTeSR1 (StemCell Technologies) medium. Medium was changed daily, and cells were passaged in a 1:10 ratio every 5 to 7 days by using standard passaging techniques with Dispase (StemCell Technologies). Before differentiation, colonies were passaged for one passage onto CF-1 mouse embryonic fibroblasts in human embryonic stem cell medium: Dulbecco’s modified Eagle medium (DMEM)/F12 + 20% KnockOut-Serum Replacement (Invitrogen), 1 mM L-glutamine, 1 mM nonessential amino acid, 0.1 mM β-mercaptoethanol, and 10 ng/mL basic fibroblast growth factor (PeproTech). CF-1 mouse embryonic fibroblasts were prepared by inactivation with 0.5 mg/mL mitomycin C for 2 hours before cryopreservation.
Embryoid body differentiation
iPSCs were scraped into nonadherent rotating 10 cm plates with KnockOut-DMEM + 20% fetal bovine serum (FBS), 1 mM L-glutamine, 1 mM nonessential amino acid, P/S, 0.1 mM β-mercaptoethanol, 200 μg/mL h-transferrin, and 50 μg/mL ascorbic acid. After 24 hours, medium was changed by allowing embryoid bodies (EBs) to settle by gravity and replaced with EB medium plus growth factors: 50 ng/mL BMP4 (R&D Systems), 100 ng/mL stem cell factor (SCF), 100 ng/mL FLT3, 10 ng/mL granulocyte colony-stimulating factor, 20 ng/mL interleukin-6 (IL-6), and 10 ng/mL IL-3 (PeproTech). Medium was changed on days 5 and 10. EBs were dissociated on day 14 with collagenase B (Roche), followed by enzyme-free dissociation buffer (Gibco), and filtered through an 80 μm filter. EBs were frozen in 10% dimethyl sulfoxide, 40% FBS freezing solution.
EB progenitor sorting
Dissociated EB cells were thawed by using the Lonza Poietics protocol and resuspended at 1 × 10⁶/100 μL staining buffer (phosphate-buffered saline + 2% FBS). Cells were stained with a 1:50 dilution of CD45 APC (HI30), CD34 PE (8G12), CD43 PerCP-Cy5.5 (1G10) (all BD Biosciences), and 4′,6-diamidino-2-phenylindole for 20 minutes at room temperature. All sorting was performed on a BD FACS Aria II cell sorter using a 70 μm nozzle.
5F gene transfer and CD34-5F culture
Sorted CD34+CD45+ EB progenitors were seeded on RetroNectin-coated (10 μg/cm2) 96 well plates at a density of 2 to 5 × 10⁴ cells per well. The infection medium was StemSpan SFEM (StemCell Technologies) with 50 ng/mL SCF, 50 ng/mL FLT3, 50 ng/mL thrombopoietin (TPO), 50 ng/mL IL-6, and 10 ng/mL IL-3. Lentiviral infections were performed in a total volume of 150 μL. The multiplicity of infection (MOI) for the factors was MOI = 5 for ERG and HOXA9, and MOI = 3 for RORA, SOX4, and MYB. Virus was concentrated onto cells by centrifuging the plate at 2500 rpm for 30 minutes at room temperature. Infections were performed for 24 hours. After gene transfer, CD34-5F cells were cultured in SFEM with 50 ng/mL SCF, 50 ng/mL FLT3, 50 ng/mL TPO, 50 ng/mL IL-6, and 10 ng/mL IL-3 (PeproTech). Doxycycline (Dox) was added at 2 μg/mL (MilliporeSigma). Cultures were maintained at <1 × 10⁶ cells/mL and medium changed every 3 to 4 days. CD34-5F lines were routinely cultured between 21 and 100 days and maintained normal karyotype and differentiation potential.
Erythroid differentiation
Differentiation was performed as previously described.20 The complete protocol is given in the supplemental Methods. Perls’ Prussian blue staining was performed by using the Iron Stain kit (MilliporeSigma).
Flow cytometry
Erythroid differentiation was analyzed by using CD71 APC-H7 (M-A712; BD) and CD235a/Glycophorin A PE-Cy7 (11E4B-7-6; Beckman Coulter). Staining was performed with <5 × 10⁵ cells per 100 μL staining buffer (phosphate-buffered saline + 2% FBS) with 1:50 dilution of each antibody, 20 minutes at room temperature in dark. For Mitotracker staining, cells were stained with 200 nM Mitotracker Green (MTG) and 100 nM TMRE (Molecular Probes) together with CD71 and CD235a in 200 μL Iscove modified Dulbecco medium for 20 minutes at 37°C. For annexin V, cells were washed in staining buffer and resuspended in 1:50 of annexin V-APC in the annexin staining buffer (BD Biosciences) for 20 minutes at room temperature. Fluorescence minus one was used to set flow cytometer settings. Acquisition was performed on BD LSRII.
Colony assays
MDS patient bone marrow mononuclear cells (BMMCs) were enriched for HPCs by using CD34+ beads (Miltenyi) and plated at 1000, 2500, or 5000 cells/mL in 3 mL MethoCult (H3434; StemCell Technologies), plus 10 ng/mL FLT3, 10 ng/mL IL-6, and 50 ng/mL TPO. CD34-5F cells were plated at 1 × 10⁴ or 5 × 10⁴ cells/mL. Mixture was distributed into two 60 mm dishes and maintained in a humidified chamber for 14 days.
Statistical analysis
Statistical analysis was performed with GraphPad Prism software. Data are shown as the mean with standard deviation from the mean unless noted. Pairwise comparisons between groups were performed by using a 2-sided unpaired unequal variance t test unless otherwise noted. For all analyses, P < .05 was considered statistically significant. Investigators were not blinded to the different groups.
Results
Reprogramming identifies stages of clonal evolution in MDS
Patients with MDS often harbor multiple mutations and cytogenetic lesions, making it difficult to establish patterns of clonal evolution. Because preleukemic cells may persist long after disease onset,2 we reasoned that reprogramming can generate iPSC lines from clonal intermediates (Figure 1A). To test this theory, we reprogrammed a patient with MDS with isolated del(5q) and refractory anemia (MDS-RA1) (supplemental Table 1). Karyotyping identified a reciprocal translocation between chromosomes 4 and 12 [t(4;12)] in 38 of 40 cells and a del(5q) in 86.5% of cells by fluorescence in situ hybridization (FISH) (Figure 1B-C). Targeted sequencing of commonly mutated MDS and AML genes identified heterozygous missense mutations in SF3B1 (p.G742D, variant allele fraction [VAF] 36%) and EZH2 (p.R685H, VAF 43%). SF3B1 is recurrently mutated in MDS with ring sideroblasts (MDS-RS).21,22 All 4 clonal abnormalities in this patient were present in the majority of MDS cells, making it impossible to assign mutational order given a single bone marrow aspirate.
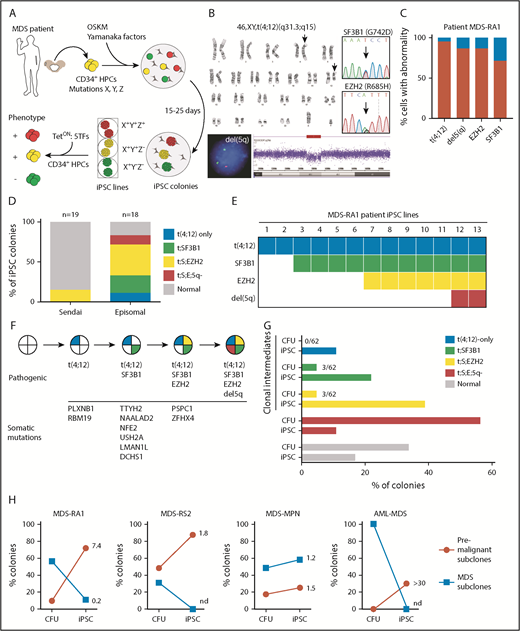
Reprogramming identifies stages of clonal evolution in MDS. (A) Experimental scheme. BMMCs are extracted from the iliac crest of patients with MDS and cryopreserved. CD34+ HPCs are isolated and reprogrammed by episomal transfection of OSKM transcription factors. Single reprogrammed cells give rise to iPSC colonies, and individual colonies are genotyped for disease alleles and expanded into clonal iPSC lines. Individual lines are differentiated into CD34+ HPCs and multipotential progenitor lines established by 5F transfection. (B) Molecular abnormalities present in the MDS-RA1 patient. Standard karyotype showing the reciprocal t(4;12)(q31.3;q15) translocation (arrows). EGR1(red)/D5S23 FISH and SNP arrays showing a del(5)(q31.2) deletion; and Sanger sequencing showing heterozygous EZH2 (p.R685H, NM_001203247.1: c.2054G>A) and SF3B1 (p.G742D, NM_012433.2: c.2225G>A) mutations. (C) Percentage of patient BMMCs positive for t(4;12) by karyotyping, del(5q) by FISH, and point mutations (VAF × 2 for heterozygous mutations). (D) Genotyping of iPSC lines generated by nonintegrating Sendai or episomal reprogramming. iPSC lines were genotyped for t(4;12) by karyotyping, del(5q) by FISH, and Sanger sequencing for point mutations. Percent iPSCs of each genotype is indicated by color (total isolated = n), with gray indicating colonies negative for MDS mutations. Genotypes are abbreviated as follows: t(4;12)-only, t(4;12);SF3B1 (t;SF3B1), t(4;12);SF3B1;EZH2 (t;S;EZH2), t(4;12);SF3B1;EZH2;del(5q) (t;S;E;5q). (E) Genotypes of the individual iPSC lines (across) showing successive acquisition of patient-specific abnormalities (down). Only MDS-derived iPSCs are shown. (F) The inferred order of somatic mutations during clonal evolution. Somatic variants were identified by WES in the patient and one or more subclonal MDS-iPSCs but not in normal isogenic iPSCs. Variants are ordered according to iPSC genotype. Complete data are shown in supplemental Table 3. (G) Comparison of clonal representation (percentage of total colonies) by genotyping CFUs (n = 62) and iPSCs derived from patient CD34+ cells. Single colonies were genotyped for each mutation by allele-specific quantitative polymerase chain reaction. (H) Proportion of premalignant (red; partial complement of mutations) and malignant (blue; all mutations) subclones in CFU versus iPSC colonies of 4 patients with MDS. Number indicates fold enrichment in iPSCs compared with CFUs.
Reprogramming identifies stages of clonal evolution in MDS. (A) Experimental scheme. BMMCs are extracted from the iliac crest of patients with MDS and cryopreserved. CD34+ HPCs are isolated and reprogrammed by episomal transfection of OSKM transcription factors. Single reprogrammed cells give rise to iPSC colonies, and individual colonies are genotyped for disease alleles and expanded into clonal iPSC lines. Individual lines are differentiated into CD34+ HPCs and multipotential progenitor lines established by 5F transfection. (B) Molecular abnormalities present in the MDS-RA1 patient. Standard karyotype showing the reciprocal t(4;12)(q31.3;q15) translocation (arrows). EGR1(red)/D5S23 FISH and SNP arrays showing a del(5)(q31.2) deletion; and Sanger sequencing showing heterozygous EZH2 (p.R685H, NM_001203247.1: c.2054G>A) and SF3B1 (p.G742D, NM_012433.2: c.2225G>A) mutations. (C) Percentage of patient BMMCs positive for t(4;12) by karyotyping, del(5q) by FISH, and point mutations (VAF × 2 for heterozygous mutations). (D) Genotyping of iPSC lines generated by nonintegrating Sendai or episomal reprogramming. iPSC lines were genotyped for t(4;12) by karyotyping, del(5q) by FISH, and Sanger sequencing for point mutations. Percent iPSCs of each genotype is indicated by color (total isolated = n), with gray indicating colonies negative for MDS mutations. Genotypes are abbreviated as follows: t(4;12)-only, t(4;12);SF3B1 (t;SF3B1), t(4;12);SF3B1;EZH2 (t;S;EZH2), t(4;12);SF3B1;EZH2;del(5q) (t;S;E;5q). (E) Genotypes of the individual iPSC lines (across) showing successive acquisition of patient-specific abnormalities (down). Only MDS-derived iPSCs are shown. (F) The inferred order of somatic mutations during clonal evolution. Somatic variants were identified by WES in the patient and one or more subclonal MDS-iPSCs but not in normal isogenic iPSCs. Variants are ordered according to iPSC genotype. Complete data are shown in supplemental Table 3. (G) Comparison of clonal representation (percentage of total colonies) by genotyping CFUs (n = 62) and iPSCs derived from patient CD34+ cells. Single colonies were genotyped for each mutation by allele-specific quantitative polymerase chain reaction. (H) Proportion of premalignant (red; partial complement of mutations) and malignant (blue; all mutations) subclones in CFU versus iPSC colonies of 4 patients with MDS. Number indicates fold enrichment in iPSCs compared with CFUs.
To determine if discrete stages of preleukemic clonal evolution marked by these 4 clonal abnormalities could be identified, we reprogrammed CD34+ progenitors isolated from BMMCs to pluripotency using Sendai virus, a high-efficiency and nonintegrating method. iPSC colonies positive for pluripotency markers Tra-160 and SSEA-4 were isolated and genotyped by allele-specific polymerase chain reaction and Sanger sequencing, or cytogenetic abnormalities by karyotype, FISH, and single nucleotide polymorphism (SNP) genome arrays. Three (16%) of 19 iPSC colonies were positive for the SF3B1 and EZH2 mutations and the patient-specific cytogenetic change, t(4;12) but not del(5q), indicating that the 3 colonies derived from the same MDS subclone (Sendai) (Figure 1D). The remaining 16 colonies lacked clonal abnormalities and were thus likely derived from normal CD34+ progenitors.
As a second approach, given the low efficiency of reprogramming MDS cells, we performed episomal transfection of CD34+ progenitors, which has a lower efficiency of reprogramming normal cells compared with Sendai.19 By contrast, MDS cells were more efficiently reprogrammed by episomes, with 13 (72%) of 18 Tra-160 and SSEA-4–positive iPSC colonies harboring patient-specific abnormalities, consistent with the frequency of mutant cells in the patient sample (episomal) (Figure 1D). Episomal reprogramming had a higher efficiency of reprogramming MDS cells compared with Sendai in 2 other patients with MDS (supplemental Figure 1A). MDS-iPSCs grouped into 4 genetically distinct sets corresponding to subclones in the patient (Figure 1E). All 13 MDS-derived iPSCs harbored t(4;12)(q31.3;q15), suggesting it was the initial abnormality. Of these 13 lines, 11 had t(4;12) and the SF3B1 mutation but not the EZH2 or del(5q), suggesting that SF3B1 occurred second. Seven iPSC lines had t(4;12), SF3B1, and EZH2 mutations but not del(5q). Two of 13 lines had the full complement of patient-specific abnormalities, including del(5q). Based on this pattern, the most parsimonious explanation is that t(4;12) was the initiating event, followed by mutations in SF3B1, EZH2, and del(5q), in that order (Figure 1E-F).
To exclude the possibility of gene conversion to wild-type alleles, we monitored heterozygosity at nearby SNPs. The closest EZH2 intronic SNP rs740949 C/T (378 bp) remained heterozygous in all iPSCs (supplemental Figure 1B). None of the lines harbored karyotypic abnormalities other than t(4;12)(q31.3;q15), indicating that no abnormalities were acquired during reprogramming (supplemental Figure 1C). SNP arrays confirmed copy number loss at 5q31.2 (supplemental Figure 1D) but showed no other regions of copy number variations or loss of heterozygosity (LOH) due to uniparental disomy in any of the iPSC lines (supplemental Figure 1E). Targeted sequencing did not identify de novo oncogenic mutations in patient iPSCs (supplemental Table 2). These data indicate that reprogramming faithfully captured the patient’s MDS genomes.
Exome sequencing identified 12 somatic variants in the patient acquired during disease evolution (supplemental Table 3). Of these, 2 (PLXNB1 and RBM19) were present in t(4;12)-only iPSCs, 9 in t(4;12);SF3B1 iPSCs (SF3B1, NAALAD2, TTYH2, NFE2, USH2A, DCHS1, and LMAN1L), and 12 in t(4;12);SF3B1;EZH2 iPSCs (EZH2, PSPC1, and ZFHX4) (Figure 1F). In addition, we reproducibly generated iPSCs from clonal intermediates in other MDS subtypes and conducted WES to map somatic evolution (supplemental Figure 2; supplemental Table 4). Thus, reprogramming is a broadly applicable strategy to order somatic variants during preleukemic clonal evolution.
To compare subclonal representation in iPSCs to single cells, we isolated colonies (colony-forming units [CFUs]) derived from single patient CD34+ cells previously shown to inform mutational order6 and genotyped for t(4;12), SF3B1, EZH2, and del(5q). Most colonies were derived from either normal cells (34%) or MDS cells with all 4 abnormalities (56%) (Figure 1G). Only 3 (5%) of 62 colonies were clonal intermediates negative for del(5q), and 3 (5%) of 62 were negative for del(5q) and EZH2. None of the colonies (of 62) had a single mutation, making it impossible to discriminate between t(4;12) and SF3B1 as the initiating mutation. Premalignant intermediates are thus rare among single cells but preferentially captured in reprogramming, whereas cells with multiple oncogenic events are reprogrammed less efficiently. Preferential reprogramming of preleukemic subclones was observed across multiple MDS patient samples, especially with cytogenetic anomalies (Figure 1H). Altogether, reprogramming uniquely resolves the order of disease-initiating mutations by capturing preleukemic cells within a single MDS patient sample.
Disease progression impairs hematopoietic differentiation
Subclonal MDS-iPSC lines can be used to investigate how sequential acquisition of mutations contributes to disease progression. To study the functional impact of somatic evolution in an individual patient, we differentiated normal, t(4;12), t(4;12);SF3B1, t(4;12);SF3B1;EZH2, and t(4;12);SF3B1;EZH2;del(5q) iPSCs from an MDS-RA1 patient to HPCs by using a 14-day EB protocol. Isogenic wild-type iPSCs gave rise to 83.4 ± 5.24% CD45+ hematopoietic cells, of which about one-half were CD34+CD45+ HPCs (Figure 2A). Leukemic progression is associated with reduced efficiency of hematopoietic differentiation.16 Hematopoietic differentiation was only modestly reduced by the initiating t(4;12) translocation (76.8 ± 3.51%), suggesting that it may have promoted clonal expansion but did not perturb differentiation in this assay (Figure 2A-B). By contrast, SF3B1-mutant iPSCs representing the second pathogenic hit showed markedly decreased differentiation efficiency (28.0 ± 4.80% CD45+; P < .001), which was further reduced upon disease progression to the t(4;12);SF3B1;EZH2 subclone (11.4 ± 1.57% CD45+; P < .001). Clonal evolution in this patient is thus mirrored by a progressive decline in efficiency of hematopoietic differentiation.
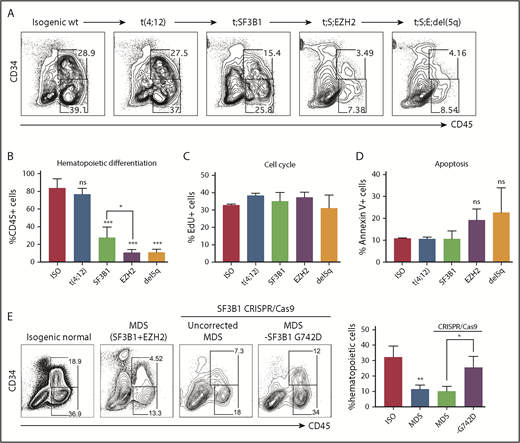
Disease progression impairs hematopoietic differentiation. Hematopoietic differentiation (day 14) of isogenic MDS-RA1 patient iPSCs showing representative flow plots (A) and percentage of CD45+ hematopoietic cells for each genotype (B): normal (ISO), t(4;12), t(4;12);SF3B1 (t;SF3B1), t(4;12);SF3B1;EZH2 (t;S;EZH2), and t(4;12);SF3B1;EZH2;del(5q) (t;S;E;del5q). (B) Mean ± standard deviation (SD) of 2 to 3 iPSCs per genotype, 4 independent experiments. (C) Percentage of EdU-positive actively cycling CD34+CD45+ isogenic HPCs after 3 hours of EdU labeling. (D) Percentage of annexin V+ apoptotic CD34+CD45+ HPCs. (C-D) Mean ± SD of 1 iPSC line per genotype, 3 independent experiments. (E) Hematopoietic differentiation efficiency (%CD45+ cells) of normal (ISO) and t(4;12);SF3B1;EZH2 (MDS) iPSCs generated by using Sendai reprogramming. SF3B1 p.G742D-ablated (p.G740fs, NM_012433.2: c.2219delG) labeled “-G742D,” and noncorrected SF3B1-mutant iPSCs, were generated by using CRISPR/Cas9. Quantitation is shown as mean ± SD of 2 independent iPSCs, 2 to 3 independent experiments. For all panels, ***P < .001, **P < .005, *P < .05; unpaired t test vs normal isogenic iPSCs unless indicated. ns, not significant.
Disease progression impairs hematopoietic differentiation. Hematopoietic differentiation (day 14) of isogenic MDS-RA1 patient iPSCs showing representative flow plots (A) and percentage of CD45+ hematopoietic cells for each genotype (B): normal (ISO), t(4;12), t(4;12);SF3B1 (t;SF3B1), t(4;12);SF3B1;EZH2 (t;S;EZH2), and t(4;12);SF3B1;EZH2;del(5q) (t;S;E;del5q). (B) Mean ± standard deviation (SD) of 2 to 3 iPSCs per genotype, 4 independent experiments. (C) Percentage of EdU-positive actively cycling CD34+CD45+ isogenic HPCs after 3 hours of EdU labeling. (D) Percentage of annexin V+ apoptotic CD34+CD45+ HPCs. (C-D) Mean ± SD of 1 iPSC line per genotype, 3 independent experiments. (E) Hematopoietic differentiation efficiency (%CD45+ cells) of normal (ISO) and t(4;12);SF3B1;EZH2 (MDS) iPSCs generated by using Sendai reprogramming. SF3B1 p.G742D-ablated (p.G740fs, NM_012433.2: c.2219delG) labeled “-G742D,” and noncorrected SF3B1-mutant iPSCs, were generated by using CRISPR/Cas9. Quantitation is shown as mean ± SD of 2 independent iPSCs, 2 to 3 independent experiments. For all panels, ***P < .001, **P < .005, *P < .05; unpaired t test vs normal isogenic iPSCs unless indicated. ns, not significant.
We next sought to determine whether the decreased hematopoietic differentiation of MDS iPSCs is due to altered proliferation or apoptosis of HPCs, or inefficient development of HPCs. Cell cycle progression marked by 5-ethynyl-2′-deoxyuridine (EdU) incorporation was unchanged in HPCs derived from all 5 isogenic iPSC lines (Figure 2C). Apoptosis was not affected by the SF3B1 mutation and modestly but not significantly increased in EZH2-mutant HPCs (Figure 2D). We next examined the earlier wave of hematopoiesis marked by CD43, which develops independently from hemogenic endothelium.23 Clonal evolution was mirrored by a progressive decline in CD43+ hematopoiesis (supplemental Figure 3A-B). These data suggest that somatic mutations do not affect proliferation or apoptosis of iPSC-derived HPCs but likely impair hematopoietic development from earlier precursors.
Acquisition of the SF3B1 mutation marked a pronounced effect on differentiation. To determine the role of SF3B1, we abolished the mutant p.G742D allele in t(4;12);SF3B1;EZH2 Sendai iPSCs by introducing an upstream 1 bp deletion (p.G740fs, NM_012433.2: c.2219delG), resulting in a stop codon at position 747, by CRISPR/Cas9. p.G742D-ablated iPSCs (-G742D) showed a partial rescue of hematopoietic differentiation (25.4% CD45+ cells) compared with Cas9-transfected but uncorrected SF3B1-mutant cells (10.1% CD45+ cells; P = .02) (Figure 2E). The acquisition of the SF3B1 mutation was thus a key pathogenic event in early disease evolution that perturbed HPC differentiation.
SF3B1 causes mitochondrial dysfunction
SF3B1 mutations in MDS are associated with mitochondrial iron sequestration and ineffective erythropoiesis.24 EZH2 and SF3B1 comutations are associated with more severe anemia and transfusion dependence in MDS-RS.22 To define the basis by which these mutations perturb erythropoiesis, we differentiated CD34+CD43+ HPCs from subclonal iPSCs to CD71+CD235a+ erythroid cells. Acquisition of mutations progressively impaired erythroid differentiation (supplemental Figure 3A,C), accompanied by increased apoptosis, a hallmark of ineffective erythropoiesis (supplemental Figure 3A,D). However, low numbers of MDS HPCs derived by direct differentiation precluded more detailed characterization.
To overcome this limitation, we expanded CD34+CD45+ day 14 HPCs by Dox-dependent expression of 5 transcription factors (CD34-5F). Erythroid differentiation is initiated by removing Dox and follows the same stages as primary CD34+ cells.25 CD34-5F cells derived from t(4;12);SF3B1, and t(4;12);SF3B1;EZH2 patient iPSCs gave rise to slightly more CD71+CD235a+ erythroblasts compared with isogenic control cells but had decreased efficiency of CD71loCD235a+ terminal maturation (Figure 3A). Prussian blue iron staining of MDS-derived erythroid precursors visualized some sideroblasts meeting morphologic criteria for ring sideroblasts (minimum of 5 granules encircling at least one-third of the circumference of the nucleus26 ), which were absent in erythroid culture of normal isogenic cells (Figure 3B). At day 11 of differentiation, 42.3% of t(4;12);SF3B1;EZH2 erythroblasts stained positive for annexin V, a marker of apoptosis, compared with 11.6% of t(4;12);SF3B1 and 7.6% of isogenic control cells (Figure 3C). CRISPR/Cas9-mediated ablation of the SF3B1 p.G742D allele or enforced expression of EZH2 partially decreased the frequency of apoptotic cells (supplemental Figure 3E), suggesting that SF3B1 and EZH2 mutations cooperate to induce apoptosis. SF3B1-mutant iPSCs thus display ineffective erythropoiesis marked by iron sequestration and apoptosis, consistent with previous reports with MDS-RS patient cells.27
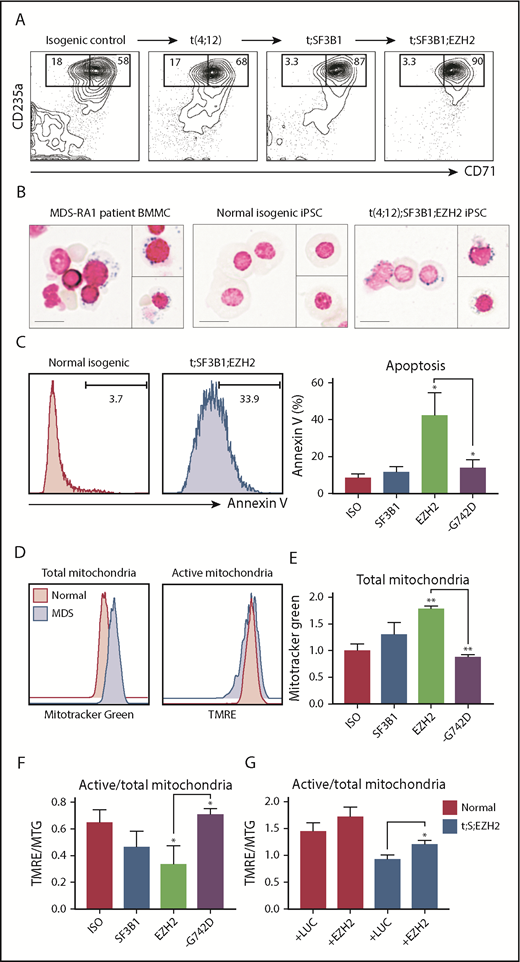
SF3B1 mutations perturb mitochondrial function. For all panels, isogenic iPSCs are abbreviated: normal (ISO), t(4;12);SF3B1 (t;SF3B1 or SF3B1), t(4;12);SF3B1;EZH2 (t;SF3B1;EZH2 or EZH2), and SF3B1 G742D-ablated (-G742D). (A) Erythroid differentiation of CD34-5F cells derived from MDS-RA1 patient iPSCs. Percentage of early (CD71+CD235a+) and mature (CD71loCD235a+) erythroblasts, day 11 of differentiation. (B) Prussian blue iron staining of primary BMMCs from patient MDS-RA1 and erythroblasts from normal isogenic or t;SF3B1;EZH2 MDS-iPSCs. Ring sideroblasts were evaluated based on the criteria of >5 iron granules encircling at least one-third of the circumference of the nucleus. Scale bars 15 μm. (C) Frequency of annexin V+ apoptotic CD235a+ erythroid cells derived from isogenic iPSCs. (D) Total and active mitochondrial content in CD235a+ erythroid cells derived from isogenic iPSCs. (E) Total mitochondrial content measured as mean fluorescence intensity (MFI) of MTG in CD235a+ erythroid cells derived from isogenic iPSCs. (F) Ratio of active (measured as MFI of TMRE) to total (measured as MFI of MTG) mitochondria in CD235a+ cells derived from isogenic iPSCs. (G) Ratio of active to total mitochondria in normal (ISO) and t;SF3B1;EZH2 CD235a+ cells transduced with a control luciferase (+LUC) or EZH2 overexpression lentivirus (+EZH2). (C-G) Mean ± standard deviation of 3 experiments, 1 to 2 iPSCs per genotype. **P < .01, *P < .05, t test vs ISO unless indicated.
SF3B1 mutations perturb mitochondrial function. For all panels, isogenic iPSCs are abbreviated: normal (ISO), t(4;12);SF3B1 (t;SF3B1 or SF3B1), t(4;12);SF3B1;EZH2 (t;SF3B1;EZH2 or EZH2), and SF3B1 G742D-ablated (-G742D). (A) Erythroid differentiation of CD34-5F cells derived from MDS-RA1 patient iPSCs. Percentage of early (CD71+CD235a+) and mature (CD71loCD235a+) erythroblasts, day 11 of differentiation. (B) Prussian blue iron staining of primary BMMCs from patient MDS-RA1 and erythroblasts from normal isogenic or t;SF3B1;EZH2 MDS-iPSCs. Ring sideroblasts were evaluated based on the criteria of >5 iron granules encircling at least one-third of the circumference of the nucleus. Scale bars 15 μm. (C) Frequency of annexin V+ apoptotic CD235a+ erythroid cells derived from isogenic iPSCs. (D) Total and active mitochondrial content in CD235a+ erythroid cells derived from isogenic iPSCs. (E) Total mitochondrial content measured as mean fluorescence intensity (MFI) of MTG in CD235a+ erythroid cells derived from isogenic iPSCs. (F) Ratio of active (measured as MFI of TMRE) to total (measured as MFI of MTG) mitochondria in CD235a+ cells derived from isogenic iPSCs. (G) Ratio of active to total mitochondria in normal (ISO) and t;SF3B1;EZH2 CD235a+ cells transduced with a control luciferase (+LUC) or EZH2 overexpression lentivirus (+EZH2). (C-G) Mean ± standard deviation of 3 experiments, 1 to 2 iPSCs per genotype. **P < .01, *P < .05, t test vs ISO unless indicated.
We next investigated if ineffective erythropoiesis is due to mitochondrial dysfunction by co-staining with tetramethylrhodamine (TMRE), which marks metabolically active mitochondria, and Mitotracker Green (MTG), which marks mitochondria irrespective of activity. SF3B1-mutant erythroblasts had similar levels of TMRE-positive mitochondria but increased MTG-positive mitochondria compared with isogenic control (Figure 3D). A decreased TMRE:MTG ratio is indicative of metabolically inactive or damaged mitochondria. The levels of MTG-positive mitochondria increased during disease progression in the patient from normal isogenic to t(4;12);SF3B1 (1.31-fold; P = .08), to t(4;12);SF3B1;EZH2 (1.78-fold; P = .0001) cells, and were reduced by genetically ablating the SF3B1 p.G742D allele (Figure 3E). Consistent with this action, the TMRE:MTG ratio decreased during disease progression from normal isogenic (0.65) to t(4;12);SF3B1 (0.47; P = .1), to t(4;12);SF3B1;EZH2 (0.34; P = .01) cells, and was rescued by ablation of the SF3B1 p.G742D allele (0.71; P = .04) (Figure 3F). These data suggest that mutant SF3B1 causes mitochondrial dysfunction in the context of cooperating mutations. Because EZH2 R685H is a predicted loss-of-function mutation, we performed EZH2 overexpression. EZH2 increased the TMRE:MTG ratio in t(4;12);SF3B1;EZH2 erythroid cells (Figure 3G), suggesting that it cooperates with mutant SF3B1. Damaged mitochondria are a source of reactive oxygen species (ROS), which can trigger apoptosis, and we detected a modest increase in ROS levels with the DCFDA dye (supplemental Figure 3F). These findings identify mitochondrial quality as a target of cooperating mutations in MDS-RS promoting generation of ROS and apoptosis, resulting in ineffective erythropoiesis.
SF3B1 mutations can occur as a second hit
SF3B1 mutations are found in CH and are generally believed to be disease-initiating.22,27,28 However, in our MDS-RA1 patient, SF3B1 was the second pathogenic event (Figure 1F). To better define the order of SF3B1 mutations, we performed reprogramming of 4 additional SF3B1-mutant MDS samples with known pathogenic comutations and normal cytogenetics (supplemental Table 1). Three patients had MDS-RS with comutations in DNMT3A (p.R882H and p.R635W) or ASXL1 (p.R417*), and 1 patient had MDS with excess blasts with RUNX1 (p.P332fs) mutation. Reprogramming identified single-mutant iPSCs in 3 of 4 patients with initiating mutations in DNMT3A (MDS-RS1), ASXL1 (MDS-RS2), and RUNX1 (MDS with excess blasts) (supplemental Figure 4A). No single-mutant iPSCs were isolated in MDS-RS3 precluding determination of the order. All iPSCs maintained heterozygosity at SF3B1 intronic SNPs ruling out gene conversion (supplemental Figure 4B). These findings show that in all 4 patients in whom the order of mutations could be experimentally defined, SF3B1 was the second pathogenic mutation (supplemental Figure 4C), indicating that in some cases, SF3B1 is a cooperating rather than initiating hit.
Clonal evolution in MDS with complex karyotype
Because cells with multiple oncogenic mutations are generally reprogrammed less efficiently, we next investigated if reprogramming could identify preleukemic evolution in samples with more significant aneuploidy. Complex karyotype (≥3 chromosomal anomalies) is found in 15% to 20% of MDS and associated with TP53 mutations and poor prognosis.29,30 We first reprogrammed an AML with MDS-related changes, complex karyotype, with TP53 and TET2 mutations. SNP arrays showed multiple copy number losses and gains also seen in the karyotype, including del 1p, −3, del 5(q13-q31), add 8, add 9, add 12, −16, −18, add 19, and +22, and LOH of the TP53 locus on chromosome 17p13 (Figure 4A; supplemental Figure 5A). After reprogramming, 3 of 10 iPSCs were heterozygous for TP53 Y220C mutation (Figure 4A-B) but surprisingly had normal karyotype (supplemental Figure 5B) and no structural copy number variations by SNP arrays, indicating that they were derived from preleukemic cells before LOH. By contrast, all (40 of 40) CFUs derived from single CD34+ cells were TP53−/− homozygous mutant (Figure 4C), suggesting that TP53+/− preleukemic cells are rare but selected during reprogramming. These data suggest that complex karyotype is a barrier to reprogramming, enabling identification of rare preleukemic cells.

Clonal evolution in patients with complex karyotype. (A) SNP genome arrays of AML-MDS patient blasts with complex karyotype and TP53 (p.Y220C; NM_001126112: c.659A>G) mutation (top). Log signal ratio is plotted. Arrows indicate structural abnormalities. Two representative iPSC lines derived from this patient are shown below, wild-type or heterozygous for the TP53 Y220C mutation and normal karyotype in the absence of structural abnormalities. (B) Genotypes of individual iPSCs (across) generated from leukemic blasts of the AML patient in panel A. All iPSC lines derived from these patients have a normal 46,XX karyotype. Karyotypes are shown in supplemental Figure 5B. (C) Comparison of clonal composition (as percentage of total colonies) among CD34+ cell CFUs (40 colonies) and iPSCs (10 colonies). (D) SNP genome arrays of 2 representative iPSCs reprogrammed from an MDS patient with complex karyotype and an inherited Li-Fraumeni TP53 (p.R209fs; NM_000546.5: c.626_627del) mutation. Arrow indicates chromosome 5q deletion in one of the iPSC lines. (E) Genotypes of individual iPSCs (across) generated from Li-Fraumeni MDS patient in panel D. All iPSCs derived from these patients have a normal 46,XX karyotype, and 2 lines had an isolated del(5q), one of which is shown in genome view in (D, bottom). Full karyotypes are shown in supplemental Figure 5C.
Clonal evolution in patients with complex karyotype. (A) SNP genome arrays of AML-MDS patient blasts with complex karyotype and TP53 (p.Y220C; NM_001126112: c.659A>G) mutation (top). Log signal ratio is plotted. Arrows indicate structural abnormalities. Two representative iPSC lines derived from this patient are shown below, wild-type or heterozygous for the TP53 Y220C mutation and normal karyotype in the absence of structural abnormalities. (B) Genotypes of individual iPSCs (across) generated from leukemic blasts of the AML patient in panel A. All iPSC lines derived from these patients have a normal 46,XX karyotype. Karyotypes are shown in supplemental Figure 5B. (C) Comparison of clonal composition (as percentage of total colonies) among CD34+ cell CFUs (40 colonies) and iPSCs (10 colonies). (D) SNP genome arrays of 2 representative iPSCs reprogrammed from an MDS patient with complex karyotype and an inherited Li-Fraumeni TP53 (p.R209fs; NM_000546.5: c.626_627del) mutation. Arrow indicates chromosome 5q deletion in one of the iPSC lines. (E) Genotypes of individual iPSCs (across) generated from Li-Fraumeni MDS patient in panel D. All iPSCs derived from these patients have a normal 46,XX karyotype, and 2 lines had an isolated del(5q), one of which is shown in genome view in (D, bottom). Full karyotypes are shown in supplemental Figure 5C.
The second patient had Li-Fraumeni syndrome with germline TP53 p.R209fs mutation and developed MDS with complex karyotype (supplemental Table 1). All iPSC lines (n = 12) harbored TP53 R209fs but similarly had normal 46,XX karyotype that was maintained during passaging (Figure 4D; supplemental Figure5C). Notably, 2 of 12 iPSCs harbored an isolated del(5)(q22-31.1) that was present in the patient but not as an isolated abnormality (Figure 4D-E). SNP arrays confirmed that del(5q) was the only structural abnormality in these iPSCs, and no structural abnormalities were found in the other iPSCs from this patient (supplemental Figure 5D). Thus, del(5q) is an early cytogenetic anomaly associated with TP53-mutant MDS.
Del(5q) perturbs hematopoietic differentiation
As an isolated cytogenetic abnormality in MDS, del(5q) is associated with the 5q– syndrome characterized by macrocytic anemia and good prognosis.31 The 5q22-31.1 deletion in our patient represents a common deleted region in poor-prognosis MDS or AML associated with complex karyotype, in which it specifies poor outcome.32,33 The significance of del(5q) in poor-prognosis MDS has not been investigated. To identify the role of del(5q), we differentiated TP53+/− Li-Fraumeni and TP53+/−;del(5q) iPSCs to HPCs. Hematopoietic differentiation was reduced in del(5q) iPSCs (P = .003) (Figure 5A), whereas CFU potential was comparable to TP53+/− alone (supplemental Figure 6A). We next established CD34-5F progenitor lines and tracked their colony-forming potential. CFU potential of TP53+/− progenitors remained stable over a month of culture (11.3 ± 2.34 CFUs/1000 CD34+ cells), whereas TP53+/−;del(5q) progenitors gradually lost multilineage differentiation over this period (1.64 ± 1.27; P = .001) (Figure 5B; supplemental Figure 6A-B). Both groups formed similar numbers of colonies with Dox (P = .86), indicating that proliferation of undifferentiated cells was not affected). These findings suggest that 5q loss in TP53-mutant cells gradually compromises multilineage hematopoietic differentiation.
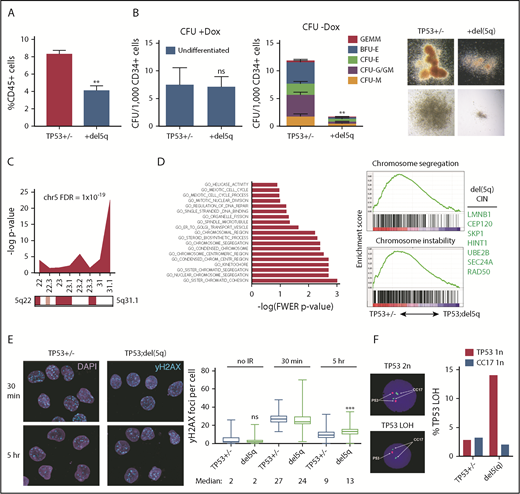
Del(5q) promotes genome instability. (A) Hematopoietic differentiation (%CD45+) of isogenic TP53 R209fs (TP53+/−) and TP53 R209fs;del(5q) iPSCs; mean ± standard error of the mean. Two iPSCs per genotype, 2 experiments. **P = .003, t test. (B) Colony-forming potential of TP53 R209fs (TP53+/−) and TP53 R209fs;del(5q) CD34+5F HPCs. Full dataset is shown in supplemental Figure 6A. Left: undifferentiated CFU (+Dox). Middle: differentiated CFU (–Dox). Right: representative erythroid (BFU-E) and myeloid (CFU-GM) colonies. Two iPSCs per genotype, 2 experiments. **P = .001, t test. (C) Chromosomal location of downregulated genes (P < .1; 1.5-fold) in del(5q) HPCs. RNA sequencing was performed on TP53 R209fs (TP53+/−) and TP53 R209fs;del(5q) CD34+5F cells; t test, 2 iPSCs, 2 experiments. (D) Top downregulated GO categories in TP53;del(5q) CD34-5F cells. Left: GO categories ranked by -log of FWER P value. Right: gene set enrichment of GO Chromosome segregation and Chromosome instability gene sets35 in TP53+/− vs TP53;del(5q). Top del(5q) CIN/DDR genes listed. (E) DNA double-strand breaks measured by γ-H2AX foci in CD34+5F cells 30 minutes and 5 hours after 4 Gy irradiation. Median ± 95% CI, >100 cells, 2 experiments. ***P < .0001, Mann-Whitney U test. (F) Loss of TP53 heterozygosity detected by 17q FISH in CD34-5F cells cultured for 1 month after 4 Gy of γ-irradiation. CC17, control probe.
Del(5q) promotes genome instability. (A) Hematopoietic differentiation (%CD45+) of isogenic TP53 R209fs (TP53+/−) and TP53 R209fs;del(5q) iPSCs; mean ± standard error of the mean. Two iPSCs per genotype, 2 experiments. **P = .003, t test. (B) Colony-forming potential of TP53 R209fs (TP53+/−) and TP53 R209fs;del(5q) CD34+5F HPCs. Full dataset is shown in supplemental Figure 6A. Left: undifferentiated CFU (+Dox). Middle: differentiated CFU (–Dox). Right: representative erythroid (BFU-E) and myeloid (CFU-GM) colonies. Two iPSCs per genotype, 2 experiments. **P = .001, t test. (C) Chromosomal location of downregulated genes (P < .1; 1.5-fold) in del(5q) HPCs. RNA sequencing was performed on TP53 R209fs (TP53+/−) and TP53 R209fs;del(5q) CD34+5F cells; t test, 2 iPSCs, 2 experiments. (D) Top downregulated GO categories in TP53;del(5q) CD34-5F cells. Left: GO categories ranked by -log of FWER P value. Right: gene set enrichment of GO Chromosome segregation and Chromosome instability gene sets35 in TP53+/− vs TP53;del(5q). Top del(5q) CIN/DDR genes listed. (E) DNA double-strand breaks measured by γ-H2AX foci in CD34+5F cells 30 minutes and 5 hours after 4 Gy irradiation. Median ± 95% CI, >100 cells, 2 experiments. ***P < .0001, Mann-Whitney U test. (F) Loss of TP53 heterozygosity detected by 17q FISH in CD34-5F cells cultured for 1 month after 4 Gy of γ-irradiation. CC17, control probe.
Del(5q) promotes genome instability
To study the mechanisms by which differentiation was gradually impaired by loss of 5q, we performed RNA sequencing of CD34+ 5F cells. As expected, gene ontology (GO) annotation exhibited significant downregulation of gene expression within the 5q22-31.1 deleted interval, with genes in the 5q31.1 region most significantly downregulated (Figure 5C; supplemental Table 5). GO annotation by molecular function showed that most significant downregulated categories included genes involved in chromosome and sister chromatid cohesion and segregation (Figure 5D). Some of these downregulated genes localize to the 5q-deleted region, including RAD50, CEP120, UBE2B, SKP1, and LMNB1. Progression to complex karyotype is associated with chromosome instability (CIN).34 Genes associated with CIN35 were also significantly downregulated in TP53+/;del(5q) cells. These data suggest that 5q loss decreases expression of genes involved in DNA damage repair and chromosome stability.
We hypothesized that sporadic loss of 5q in TP53-mutant cells promotes accumulation of DNA damage and genome instability over time, leading to a block in differentiation and MDS. To examine this theory, we measured γ-H2AX and 53BP1 foci, which mark the sites of double-strand breaks after γ-irradiation, a p53-dependent genotoxic stress. TP53+/−;del(5q) and TP53+/− HPCs had comparable induction of nuclear γ-H2AX and 53BP1 staining 30 minutes after irradiation (Figure 5E; supplemental Figure 6C). However, the repair of double-strand breaks was markedly delayed in del(5q) cells, evidenced by persistent γ-H2AX and 53BP1 staining 5 hours after irradiation. Del(5q) progenitors also had more annexin V+ apoptotic cells at baseline but failed to induce apoptosis in response to irradiation (supplemental Figure 6D). These data suggest that loss of 5q results in persistent DNA damage in TP53-mutant HPCs.
Increased double-strand breaks can result in structural abnormalities, such as LOH at the TP53 locus. To examine if del(5q) predisposed to structural abnormalities, we cultured irradiated CD34-5F cells and measured the frequency of TP53 LOH by using 17p13.1 FISH. Nonirradiated cells maintained a normal karyotype even after extended culture (supplemental Figure 6E). Irradiated TP53+/− cells showed only background frequency of LOH (2.8%), whereas 14% of TP53+/−;del(5q) progenitors harbored TP53 LOH (Figure 5F). These findings suggest that acquisition of del(5q) promotes genome instability, accelerating loss of the second TP53 allele and progression to complex karyotype.
Discussion
Myeloid neoplasms are preceded by a period of premalignant clonal evolution.3,4 By the time of diagnosis, malignant cells harbor multiple genetic lesions and continue to evolve in response to treatment, leading to relapse.36 The nature of disease-initiating events, the order in which they are acquired, and their functional consequences on stem and progenitor cell self-renewal and differentiation remain incompletely understood. We showed that reprogramming of MDS patient samples by using nonintegrating episomal methods generates a panel of iPSC lines that capture the genomes of premalignant clonal intermediates that persist after disease onset.2,37 Ancestral subclones containing fewer mutations were more likely to be reprogrammed and could be identified even when they were rare among single-patient HPCs. Reprogramming also enables functional analysis of clonal progression by differentiation of iPSCs to HPCs. Previous studies have compared iPSCs from patients at different stages of MDS,16 complicating direct comparison. By contrast, differentiation of distinct subclones can provide insights into disease progression in individual patients. Using this approach, we identified mitochondrial function and chromosome stability as key pathways affected by acquisition of mutations in MDS.
MDS is a premalignant disorder characterized by aberrant differentiation that has been challenging to model.4 MDS patient samples are typically cytopenic and engraft poorly in immunodeficient mice.38 Human cell models have almost exclusively used cell lines that poorly recapitulate human disease. Reprogramming creates versatile disease models that recapitulate aberrant differentiation, dysplastic features, and molecular programs of primary cells.16,17 However, in most cases, only a single subclone was reprogrammed due to lower efficiency of reprogramming of MDS cells. We find that episomal reprogramming used in this study results in a high proportion of MDS-derived iPSCs, enabling reprogramming of multiple distinct subclones. Because MDS cells have higher levels of innate immune signaling, they may be more prone to apoptosis39 following infection with Sendai virus, resulting in enrichment for normal cells during reprogramming. In most cases, there was an inverse relationship between the number of abnormalities, particularly cytogenetic events, and reprogramming efficiency. This scenario favors representation of early preleukemic subclones that may otherwise be too rare to be detected directly. We used this approach to explore mutation order in a small cohort of SF3B1-mutant MDS patients. Previous studies have shown that SF3B1 is usually a founder mutation.27,28 Our analysis shows that it can be a second hit, preceded by CH-associated epigenetic mutations such as DNMT3A, ASXL1, and TET2. This outcome raises the possibility that SF3B1 may be either an initiating or a secondary event and that these scenarios might have clinical implications. However, the limited number of patients studied precludes generalization of our conclusions. Our study showed that reprogramming can be used to make important inferences about the order and functional implications of initiating mutations.
To uncover disease-relevant phenotypes, iPSCs must first be differentiated into HPCs. Consistent with previous studies,16,40 acquisition of mutations in MDS progressively impaired hematopoietic differentiation. We suggest this finding is due to inefficient development of MDS HPCs from hemogenic endothelium, rather than intrinsic defects in proliferation or apoptosis. The limited hematopoietic potential of MDS iPSCs presents a practical challenge for characterizing disease phenotypes.13 We have adopted a strategy that uses conditional expression of 5 factors to create expandable HPCs.41 We previously used this system to model congenital anemia and identify therapeutic compounds.25 The engraftment potential of CD34-5F progenitors remains limited. More recently reported transcription factor protocols may specify more durable engraftment potential.42 Generation of engraftable MDS HPCs from iPSCs remains an important future goal that would enable modeling of clonal dominance by MDS-HSCs.
Gain-of-function SF3B1 mutations are strongly associated with MDS-RS,21,22 suggesting a causative role, but cooperating mutations may also play a role. Unlike other splicing factor mutations, MDS-RS has been challenging to model. An SF3B1 K700E knock-in mouse model develops anemia but not RS,43 whereas human knock-in cell lines do not undergo normal erythroid differentiation. By analyzing clonal evolution in a patient with mutant SF3B1, we showed that erythroid differentiation is accompanied by iron deposition with findings of ring sideroblasts and accumulation of damaged mitochondria. We propose a model in which rapid mitochondrial biosynthesis combined with iron-induced oxidative damage creates a pool of damaged mitochondria leading to increased ROS and apoptosis. We further showed that mutant SF3B1 was required and cooperated with EZH2 mutations to impair mitochondrial function, consistent with more severe anemia in patients with these comutations.22 Identification of direct targets of SF3B1 that contribute to mitochondrial dysfunction and ring sideroblast formation is a key goal for future study.
Complex karyotype is common in MDS and is associated with TP53 mutations, del(5q), and poor prognosis.32,44 Little is known about the mechanisms that lead to genome instability and progression to complex karyotype because chromosomal alterations are difficult to model in mice or engineer into human cell lines. Through our reprogramming method, we identified in one of the patients a del(5q) subclone that preceded evolution to complex karyotype. We find that loss of the 5q22-31.1 region often observed in patients with high-risk MDS and AML dysregulates a gene expression program that maintains genome stability. Del(5q) CD34-5F cells have increased levels of DNA damage after genotoxic stress and structural loss of TP53 heterozygosity. This model may thus be instrumental in identifying genes in the 5q-deleted region that maintain chromosomal stability and promote progression to complex karyotypes in MDS and AML.
Our study has shown broad utility of cellular reprogramming to gain insights into clonal evolution during leukemic progression. We anticipate that this approach can be applied broadly to study mechanisms of progression and transformation in hematologic malignancies and cancer.
RNA sequencing data are available in the Gene Expression Omnibus database (accession number GSE129851).
The online version of this article contains a data supplement.
The publication costs of this article were defrayed in part by page charge payment. Therefore, and solely to indicate this fact, this article is hereby marked “advertisement” in accordance with 18 USC section 1734.
Acknowledgments
The authors thank Derek Stirewalt, the FH/UW Leukemia Repository, and Michael Linenberger for providing patient samples, David L. McDonald at the Fred Hutchinson Imaging Center for assistance with karyotyping, and Lorinda Soma at UWMC Laboratory Medicine for assistance with histology stains. Additional cytogenetic services were provided by DCI Cytogenetics (Seattle). Norman Gerry at Advanced Biomedical Laboratories assisted with SNP genome arrays, and Donna Prunkard at the Pathology Flow Core and Nathaniel Peters at the Keck Imaging Center provided technical assistance.
This research was supported by the National Institutes of Health (NIH)/National Heart, Lung, and Blood Institute (NHLBI) Transition to Independence Award (R00HL123484), NIH New Innovator Award DP2HL147126, and EvansMDS Foundation Discovery Research Grant (S.D.). This research was funded in part through the American Federation for Aging Research Junior Faculty Grant (S.D.), Tietze Young Scientist Award (S.D.), Safeway Early Career Award (S.D.), NIH/National Cancer Institute Cancer Center Support Grant (P30CA015704), NIH/National Institute of Diabetes and Digestive and Kidney Diseases (U54DK106829-04) (B.T.S.), NIH/National Cancer Institute (P01CA077852), and NIH/NHLBI (R01HL31823) (J.L.A.). B.J.H. is supported by NIH/National Institute of Diabetes and Digestive and Kidney Diseases (F32DK102336). A.R. is supported by the Hematology training grant NIH/NHLBI (T32HL007093).
Authorship
Contribution: S.D. and J.L.A. conceived the project; J.H., A.R., J.L.A., and S.D. designed the experiments; J.H., A.R., B.J.H., D.W., and S.D. generated data; J.H., A.R., C.A.C., J.L.A., S.B.K., S.G., D.W., E.Q.K., and S.D. analyzed data; P.S.B., S.B.K., J.L.A., and B.T.-S. provided essential clinical samples and clinical history; and J.H., A.R., J.L.A., S.B.K., and S.D. prepared the manuscript.
Conflict-of-interest disclosure: The authors declare no competing financial interests.
Correspondence: Sergei Doulatov, Division of Hematology, Department of Medicine, University of Washington, 1705 NE Pacific St, Box 357710, Seattle, WA 98195; e-mail: doulatov@uw.edu.

This feature is available to Subscribers Only
Sign In or Create an Account Close Modal