

Key Points
Protease nexin-1 is an underestimated endogenous inhibitor of thrombin.
Targeting protease nexin-1 improves coagulation in hemophilia.
Abstract
Hemophilia A and B, diseases caused by the lack of factor VIII (FVIII) and factor IX (FIX) respectively, lead to insufficient thrombin production, and therefore to bleeding. New therapeutic strategies for hemophilia treatment that do not rely on clotting factor replacement, but imply the neutralization of natural anticoagulant proteins, have recently emerged. We propose an innovative approach consisting of targeting a natural and potent thrombin inhibitor, expressed by platelets, called protease nexin-1 (PN-1). By using the calibrated automated thrombin generation assay, we showed that a PN-1-neutralizing antibody could significantly shorten the thrombin burst in response to tissue factor in platelet-rich plasma (PRP) from patients with mild or moderate hemophilia. In contrast, in PRP from patients with severe hemophilia, PN-1 neutralization did not improve thrombin generation. However, after collagen-induced platelet activation, PN-1 deficiency in F8−/−mice or PN-1 blocking in patients with severe disease led to a significantly improved thrombin production in PRP, underlining the regulatory role of PN-1 released from platelet granules. In various bleeding models, F8−/−/PN-1−/− mice displayed significantly reduced blood loss and bleeding time compared with F8−/−mice. Moreover, platelet recruitment and fibrin(ogen) accumulation were significantly higher in F8−/−/PN-1−/− mice than in F8−/−mice in the ferric chloride-induced mesenteric vessel injury model. Thromboelastometry studies showed enhanced clot stability and lengthened clot lysis time in blood from F8−/−/PN-1−/− and from patients with hemophilia A incubated with a PN-1-neutralizing antibody compared with their respective controls. Our study thus provides proof of concept that PN-1 neutralization can be a novel approach for future clinical care in hemophilia.

Introduction
Hemostasis is an essential process allowing minimal blood leakage after an injury by inducing clotting at the site of vascular damage while maintaining an acceptable level of blood fluidity. This process is characterized by a finely tuned balance among procoagulant, anticoagulant, and fibrinolytic systems. Rupture of this balance may result in bleeding disorders such as hemophilia. Hemophilia A and B are monogenic X-linked recessive bleeding disorders characterized by a disrupted clotting cascade. Deficiency of procoagulant factor VIII (FVIII) in hemophilia A, or of factor IX (FIX) in hemophilia B, leads to impaired thrombin generation, giving rise to defects in clot formation, and therefore spontaneous bleeding. Recently, there has been a surge in innovation in hemophilia treatments. A new considered therapeutic strategy that does not rely on FVIII or FIX replacement implies the neutralization of natural anticoagulant proteins such as antithrombin (AT) and tissue factor pathway inhibitor (TFPI) to rebalance hemostasis. A small interfering RNA targeting AT1 and a humanized monoclonal antibody inhibiting TFPI2 are under study to promote hemostasis in hemophilia. In the same line of thought, an activated protein C (APC)-specific serpin able to rescue thrombin generation in vitro has been proposed to restore hemostasis in hemophilia mouse models.3 Recently, targeting protein S (PS), the cofactor facilitating the action of APC, has also been proposed to improve hemostasis in hemophilia.4 Importantly, in contrast to conventional replacement therapy, such blockade of endogenous anticoagulant proteins will not lead to the development of inhibitory alloantibodies against coagulation factors. Moreover, this could represent a treatment approach for patients both without, and most importantly with, inhibitors to clotting factor concentrates.
We hypothesized that another natural anticoagulant protein, protease nexin-1 (PN-1) or serpinE2, could also be an interesting target to promote hemostasis in hemophilia. Indeed, the serpin PN-1 is a highly efficient thrombin inhibitor,5 but it is also known to be an effective inhibitor of FXIa,6 a key factor in the amplification of the coagulation cascade. In vitro studies demonstrated that PN-1 inhibits thrombin more effectively than AT,7 even in the presence of heparin.5 Heparin also strongly accelerates FXIa inhibition by PN-1, making PN-1 a far better inhibitor of FXIa than C1 inhibitor.6,8 In contrast to AT, PN-1 is barely detectable in plasma, but is present in blood cells, and in particular in platelets.9 Most of platelet PN-1 is stored in the α-granules and is secreted during platelet activation. PN-1 also displays antifibrinolytic activity,10 but this activity is relatively minor compared with its antithrombin-directed activity.
We have previously shown that PN-1 present in platelets can significantly inhibit both thrombin activity and thrombin generation.11 Moreover, in vivo studies showed that thrombus formation induced after a vascular lesion was accelerated and facilitated in PN-1-deficient mice compared with wild-type mice. Thus, PN-1 accumulates at the site of the platelet thrombus, where it displays its antithrombotic activity via its ability to block both the activity and the generation of thrombin.
Here we examined, for the first time, the effects of PN-1 inhibition on thrombin generation in murine and human hemophilia platelet-rich plasma, and on hemostasis and thrombosis in mouse hemophilia models.
Materials and methods
Human hemophilia blood
Blood from patients with hemophilia A and B was provided by the Hemophilia Center (Hospital André Mignot, Le Chesnay, France). Approval was obtained from the Ethic Evaluation Committee and the Institutional Review Board of the French Institute of Medical Research and Health; all subjects gave written informed consent for blood sampling.
Patients with hemophilia without inhibitors were classified depending on the deficit severity level. Mild, moderate, and severe hemophilia refer to circulating FVIII or FIX levels between 5% and 40%, between 1% and 5%, and less than 1%, respectively. None of the patients with hemophilia B, or with mild and moderate hemophilia A, were receiving prophylactic treatment at the time of blood sampling. Four patients with severe hemophilia A were receiving prophylactic treatment but had a circulating FVIII level strictly inferior to 1% at the time of blood sampling.
Preparation of human plasma
Blood was drawn by venipuncture, using a vacutainer system (Becton Dickinson) containing 109 mM trisodium citrate as anticoagulant in the ratio of 1-part anticoagulant to 9 parts blood. Platelet-rich plasma (PRP) was obtained by centrifugation at 120g for 15 min at room temperature (RT). Platelet-poor plasma (PPP) was obtained by a double centrifugation: after a first centrifugation of blood at 1200g for 12 min, plasma was subsequently centrifuged at 10 000g for 5 minutes to remove residual platelets and cell fragments. PRP was adjusted to 160 × 103 platelets/μL with autologous PPP.
Mice
PN-1-deficient mice (PN-1−/−) were generated by heterozygous mating and bred in-house. PN-1 heterozygous mice (PN-1+/−) and F8-deficient mice were crossed to obtain double knock-out mice for F8 and PN-1 (F8−/−/PN-1−/−). F8+/+/PN-1−/− (PN-1-deficient), F8+/+/PN-1+/+ (wild-type), and F8−/−/PN-1+/+ (hemophilia) mice were generated by heterozygous mating and bred in-house. All mice had a C57Bl/6 genetic background. PN-1 and F8 genotypes were determined by polymerase chain reaction. All experiments were performed on littermates in accordance with French ethical laws (agreement number, APAFIS n° 4342).
Preparation of murine plasma
Mouse blood was sampled from the inferior vena cava under 5% isoflurane anesthesia. The abdominal cavity was opened, and blood was drawn using a 23-gauge needle and 1-mL plastic syringe previously charged with 100 μL 3.2% sodium citrate. PRP was prepared immediately after blood drawing by centrifugation at 200g for 3 minutes at room temperature. PPP was obtained by a double centrifugation: the first at 2500g for 15 minutes at RT and the second at 10 000g for 5 minutes to remove residual platelets and cell fragments. PRP was adjusted to 450 × 103 platelets/μL with autologous PPP.
Thrombin generation assay
Assays were performed in a 96-well microtiter plate in a final volume of 120 µL per well. Samples spiked with thrombin calibrator (Diagnostica Stago) were run in parallel with each cycle of test sample. Thrombin generation was triggered by adding CaCl2 (16.7 nM final concentration) and fluorogenic substrate Z-Gly-Gly-Arg-AMC (417 μM final concentration) in Fluo Buffer pH 7.5 (20 mM HEPES, 60 g/L BSA). Fluorescence was measured over the course of 60 minutes and analyzed by the Thrombinoscope software (Thrombinoscope BV). All experiments were carried out in triplicate.
Human assay.
Adjusted hemophilic PRP was preincubated with 100 μg/mL blocking in-house polyclonal rabbit anti-PN-1 antibody11 that was produced after injection of recombinant human PN-1 in rabbits, or 100 μg/mL irrelevant immunoglobulin G (IgG; Immunoresearch) for 15 minutes at 37°C before transfer to microtitration plates containing 0.5 pM tissue factor (TF; Diagnostica Stago) in the presence or absence of collagen at 5 µg/mL (Horm, Nicomed Pharma).
Mouse assay.
Adjusted hemophilic PRP from F8+/+/PN-1+/+, F8+/+/PN-1−/−, F8−/−/PN-1−/− mice, or F8−/−/PN-1+/+ preincubated or not with 100 μg/mL blocking in-house polyclonal rabbit anti-PN-1 antibody11 or 100 μg/mL irrelevant IgG (Immunoresearch), were transferred to microtitration plates containing 1 pM TF in the presence or absence of collagen at 5 μg/mL final (Horm, Nicomed Pharma).
Tail clip bleeding model
Mice were anesthetized with 2% isoflurane. The tail was immersed in a prewarmed saline solution (37°C) in a 15-mL tube. Ten minutes later, 3-mm of the tail tip was amputated using a scalpel and the tail immediately re-immersed in the saline. Bleeding time was measured from the moment of transection until the first arrest of bleeding, and blood was collected and quantified. The observation was stopped at 6 minutes if bleeding continued.
Tail vein transection or tail artery transection bleeding models
Tail vein transection and tail artery transection assays were performed essentially as described.12 Briefly, mice were anesthetized with 2% isoflurane. The tail was placed into a tube filled with prewarmed saline (37°C). Ten minutes after, using a specially designed transection template, the tail was cut at 2.5 mm diameter through a 0.5-mm-deep incision transecting either the left lateral vein or the ventral artery for tail vein transection or tail artery transection bleeding models, respectively. Immediately after injury, the tail was re-immersed in the saline and the bleeding was monitored over the course of 60 minutes. In both bleeding models, if the mouse was not bleeding at 15, 30, and 45 minutes postinjury, the wound was challenged by gently wiping it twice with a saline-wetted gauze swab in the distal direction. Immediately after the challenge, the tail was re-submerged into the saline. At 60 minutes, mice were killed by cervical dislocation while still under full anesthesia.
Blood loss quantification
Blood loss was determined by collecting blood cells via a centrifugation at 1500g for 25 minutes. After lysis of blood cells with a known volume of water, hemoglobin content was determined by measuring absorbance at 575 nm.13 A standard curve in which known volumes of mouse blood were used to extract hemoglobin served to calculate blood loss volumes.
Real-time in vivo imaging of thrombus formation
Mice were anesthetized by intraperitoneal injection of 100 mg⋅kg−1 ketamine and 10 mg⋅kg−1 xylazine in saline. Then, Alexa Fluor 647-conjugated antibody against glycoprotein IX (0.12 mg/kg mouse; Emfret Analytics) and fluorescein isothiocyanate conjugated-human-fibrinogen (10 mg/kg mouse; Invitrogen Life Technologies) were injected into the retroorbital sinus. The mesentery was gently exteriorized and small vessels were visualized by intravital microscopy, using an upright fluorescence macroscope (MacroFluo, Leica Microsystems) equipped with a thermostated heating plate and a 5× objective, and connected to a sCMOS camera (Orca-Flash-4.0, Hamamatsu Photonics) for image acquisition, using Metamorph software (Molecular Devices). A filter paper strip (1×2 mm) was immersed in a ferric chloride solution (10% FeCl3; Sigma-Aldrich) and applied to the surface of the selected vessels. After 3 minutes of exposure, the filter paper was removed. Thrombus formation after injury was examined in real-time by monitoring the accumulation of fluorescence for 50 min.
Rotational thromboelastometry
Whole-blood coagulation profiles were recorded by a ROTEM Coagulation Analyzer (Tem International). Prewarmed ROTEM cups were prepared with 300 μL citrated human or murine whole blood in the presence of tissue-plasminogen activator at 0.5 or 1 μg/mL, respectively (Alteplase, Boehringer) to induce fibrinolysis. Human blood samples were preincubated with 100 μg/mL irrelevant IgG or 100 μg/mL polyclonal anti-PN-1 antibody at RT for 15 minutes. Clotting was initiated by adding 20 μL of extrinsically activated ROTEM assay reagent (ExTEM, Tem International) prediluted at 1:50 for murine samples or undiluted for human samples, and 20 μL of buffered concentrated calcium chloride solution (Star-TEM reagent, Tem International), according to the manufacturer’s recommendation. Clotting time (s), maximum clot firmness (MCF, mm), lysis onset time (LOT, s), lysis time (s), and maximum clot elasticity were assessed using ROTEM software.
Statistical analyses
Results are shown as means ± standard error of the mean (SEM). The Shapiro-Wilk test was applied to analyze the data distribution and determine the use of parametric or nonparametric tests. Statistical analysis of differences between groups was performed using the appropriate test as indicated. A P value less than .05 was considered significant.
Results
PN-1 inhibition enhances thrombin generation in PRP from patients with mild and moderate hemophilia A and B, but has no such effect in PRP from severely affected patients
We determined thrombin generation in PRP, using the calibrated automated thrombin generation assay (TGA). In this assay, we tested PRP from patients with mild and moderate hemophilia in the presence of a polyclonal anti-PN-1 antibody that abolishes the protease inhibitory activity of PN-1 (Figure 1). The mean values of TGA parameters: lag time, thrombin peak, time to peak (TTP), endogenous thrombin potential (ETP), and calculated velocity are summarized in Tables 1 and 2. Patients with mild and moderate hemophilia A displayed a significantly higher thrombin peak height and a reduced time to peak in the presence of the neutralizing anti-PN-1 antibody compared with values obtained with the irrelevant antibody (Figure 1A-B; Table 1). Increased peak and velocity of thrombin generation were also observed in PRP from patients with hemophilia B in the presence of the neutralizing anti-PN-1 antibody (Figure 1C-D; Table 2). Even if the endogenous thrombin potential was not modified, our data clearly indicate that blocking PN-1 can significantly shorten the thrombin burst in mildly and moderately affected patients, as illustrated by the increased velocity (Tables 1 and 2).
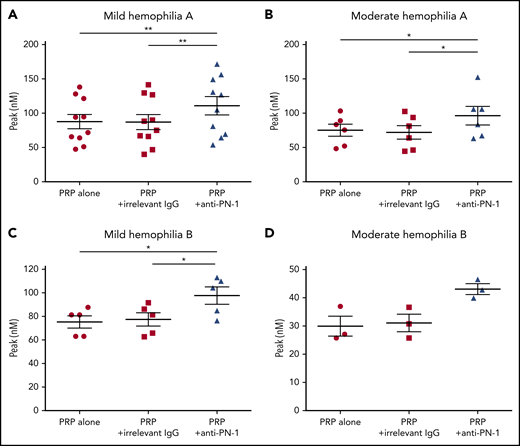
PN-1 inhibition enhances thrombin generation in PRP from mild and moderate patients with hemophilia A and B. Peaks were measured in PRP from patients with mild and moderate hemophilia A (A-B) or patients with hemophilia B (C-D), incubated with 100 µg/mL irrelevant IgG antibody or 100 µg/mL anti-PN-1 antibody. Each dot represents 1 patient. Values are means ± SEM. A nonparametric 1-way analysis of variance (ANOVA) test followed by a multiple comparison test was used. *P < .05; **P < .01.
PN-1 inhibition enhances thrombin generation in PRP from mild and moderate patients with hemophilia A and B. Peaks were measured in PRP from patients with mild and moderate hemophilia A (A-B) or patients with hemophilia B (C-D), incubated with 100 µg/mL irrelevant IgG antibody or 100 µg/mL anti-PN-1 antibody. Each dot represents 1 patient. Values are means ± SEM. A nonparametric 1-way analysis of variance (ANOVA) test followed by a multiple comparison test was used. *P < .05; **P < .01.
Parameters of thrombin generation in PRP from patients with mild and moderate hemophilia A
| Patients with mild hemophilia A (n = 10) | Patients with moderate hemophilia A (n = 6) | |||||
|---|---|---|---|---|---|---|
| PRP alone | PRP + irrelevant IgG | PRP + anti-PN-1 | PRP alone | PRP + irrelevant IgG | PRP + anti-PN-1 | |
| Lag time, min | 10.32 ± 2.92 | 10.33 ± 2.96 | 10.32 ± 3.02 | 11.98 ± 1.70 | 12.09 ± 1.70 | 11.89 ± 1.83 |
| Peak, nM | 87.68 ± 32.70 | 87.16 ± 35.19 | 110.8 ± 42.10* | 75.05 ± 21.33 | 71.88 ± 24.37 | 96.25 ± 32.91† |
| TTP, min | 23.23 ± 5.09 | 23.34 ± 5.07 | 21.55 ± 4.68‡ | 25.41 ± 4.63 | 25.73 ± 4.82 | 22.92 ± 4.30† |
| ETP, nM⋅min | 1485 ± 381.0 | 1474 ± 382.2 | 1442 ± 374.2 | 1341 ± 448.0 | 1288 ± 452.6 | 1299 ± 410.6 |
| Velocity, nM/min | 7.26 ± 3.63 | 7.07 ± 3.64 | 10.99 ± 6.63* | 5.77 ± 2.24 | 5.56 ± 2.67 | 9.19 ± 4.65† |
Means ± SD. A nonparametric 1-way ANOVA test followed by a multiple comparison test was used.
P < .01.
P < .05.
P < .001 vs PRP + irrelevant IgG.
Parameters of thrombin generation in PRP from patients with mild and moderate hemophilia B
| Patients with mild hemophilia B (n = 5) | Patients with moderate hemophilia B (n = 3) | |||||
|---|---|---|---|---|---|---|
| PRP alone | PRP + irrelevant IgG | PRP + anti-PN-1 | PRP alone | PRP + irrelevant IgG | PRP + anti-PN-1 | |
| Lag time, min | 11.53 ± 1.55 | 11.33 ± 1.76 | 11.41 ± 1.87 | 14.62 ± 2.09 | 15.29 ± 3.57 | 15.74 ± 3.90 |
| Peak, nM | 75.28 ± 11.50 | 77.49 ± 12.65 | 97.73 ± 16.28* | 29.92 ± 6.12 | 31.07 ± 5.41 | 43.09 ± 3.31 |
| TTP, min | 22.31 ± 3.76 | 21.88 ± 3.91 | 20.69 ± 2.78 | 27.11 ± 2.93 | 30.01 ± 6.32 | 29.73 ± 3.53 |
| ETP, nM⋅min | 1368 ± 411.2 | 1395 ± 374.4 | 1292 ± 303.4 | 775,6 ± 173.0 | 1013 ± 491.1 | 813.1 ± 264.9 |
| Velocity, nM/min | 7.44 ± 1.92 | 7.51 ± 1.98 | 10.60 ± 1.73* | 2,47 ± 0.80 | 2.33 ± 0.85 | 2.80 ± 0.44 |
Means ± SD. A nonparametric 1-way ANOVA test followed by a multiple comparison test was used.
P < .05 vs PRP + irrelevant IgG.
TGA was also performed in platelet-poor plasma (PPP) from patients with hemophilia A and patients with hemophilia B in the presence of the polyclonal anti-PN-1 antibody. As expected, the anti-PN-1 antibody had no effect on the mean values of TGA in these patients, confirming the platelet origin of PN-1 (supplemental Table 1, available on the Blood Web site).
Moreover, TGA was performed on PRP from patients with severe hemophilia A and those with severe hemophilia B (Figure 2; Table 3). The anti-PN-1 antibody had no significant effect on thrombin generation parameters either in the PRP (Tables 3 and 4) or in the PPP of these patients (supplemental Table 1). Thus, a minimum amount of generated thrombin was required to observe a significant improvement of coagulation in the presence of the neutralizing anti-PN-1 antibody.
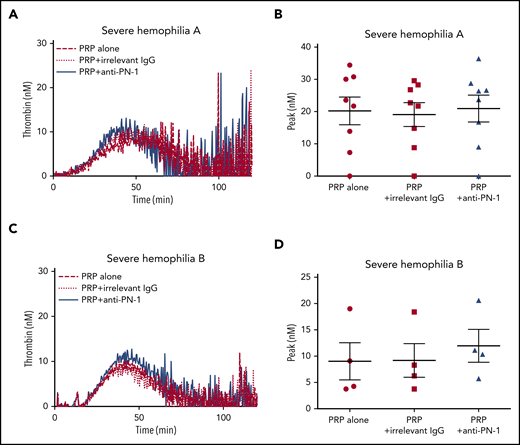
PN-1 inhibition has no effect on thrombin generation in PRP from patients with severe hemophilia A and patients with severe hemophilia B. Representative thrombin generation profiles from a patient with severe hemophilia A (A) and a patient with severe hemophilia B (C). Peaks were measured in PRP from patients with severe hemophilia A (B) and patients with severe hemophilia B (D), incubated with 100 µg/mL irrelevant IgG antibody or 100 µg/mL anti-PN-1 antibody. Each dot represents 1 patient. Values are means ± SEM. A nonparametric 1-way ANOVA test followed by a multiple comparison test was used.
PN-1 inhibition has no effect on thrombin generation in PRP from patients with severe hemophilia A and patients with severe hemophilia B. Representative thrombin generation profiles from a patient with severe hemophilia A (A) and a patient with severe hemophilia B (C). Peaks were measured in PRP from patients with severe hemophilia A (B) and patients with severe hemophilia B (D), incubated with 100 µg/mL irrelevant IgG antibody or 100 µg/mL anti-PN-1 antibody. Each dot represents 1 patient. Values are means ± SEM. A nonparametric 1-way ANOVA test followed by a multiple comparison test was used.
Parameters of thrombin generation in PRP from patients with severe hemophilia A and B without collagen-induced platelet activation
| PRP alone | PRP + irrelevant IgG | PRP + anti-PN-1 | |
|---|---|---|---|
| Patients with severe hemophilia A (n = 8) | |||
| Lag time, min | 12.82 ± 6.87 | 13.05 ± 7.03 | 13.40 ± 7.36 |
| Peak, nM | 20.21 ± 12.18 | 19.19 ± 10.44 | 20.96 ± 11.76 |
| TTP, min | 40.40 ± 22.26 | 41.45 ± 22.95 | 39.15 ± 23.94 |
| ETP, nM⋅min | 230.9 ± 336.8 | 235.9 ± 323.6 | 360.5 ± 383.5 |
| Velocity, nM/min | 0.74 ± 0.51 | 0.67 ± 0.45 | 0.87 ± 0.61 |
| Patients with severe hemophilia B (n = 4) | |||
| Lag time, min | 8.21 ± 6.0 | 8.90 ± 3.77 | 8.44 ± 3.73 |
| Peak, nM | 9.03 ± 7.07 | 9.19 ± 6.42 | 11.97 ± 6.24 |
| TTP, min | 24.25 ± 7.0 | 24.21 ± 6.39 | 28.94 ± 2.45 |
| ETP, nM⋅min | 254.9 ± 198.9 | 272.3 ± 149.3 | 398.2 ± 140.8 |
| Velocity, nM/min | 0.51 ± 0.43 | 0.59 ± 0.36 | 0.65 ± 0.48 |
Parameters of thrombin generation in PRP from patients with severe hemophilia A and B with collagen-induced platelet activation
| PRP alone | PRP + irrelevant IgG | PRP + anti-PN-1 | |
|---|---|---|---|
| Patients with severe hemophilia A (n = 6) | |||
| Lag time, min | 12.48 ± 4.61 | 12.14 ± 4.72 | 11.23 ± 4.70 |
| Peak, nM | 22.59 ± 11.66 | 23.59 ± 11.65 | 31.49 ± 16.20* |
| TTP, min | 40.30 ± 5.67 | 39.90 ± 5.49 | 34.94 ± 6.31* |
| ETP, nM⋅min | 1060 ± 587.0 | 1103 ± 579.0 | 1172 ± 581.9 |
| Velocity, nM/min | 0.81 ± 0.39 | 0.88 ± 0.41 | 1.39 ± 0.81* |
| Patients with severe hemophilia B (n =3) | |||
| Lag time, min | 8.85 ± 1.08 | 8.39 ± 1.08 | 8.30 ± 1.75 |
| Peak, nM | 19.56 ± 6.64 | 19.56 ± 6.11 | 38.95 ± 10.62 |
| TTP, min | 29.59 ± 0.92 | 28.30 ± 1.45 | 26.04 ± 2.93* |
| ETP, nM⋅min | 1046 ± 243.2 | 926.1 ± 300.3 | 1429 ± 194.0* |
| Velocity, nM/min | 1.05 ± 0.31 | 0.99 ± 0.32 | 2.23 ± 0.78 |
Means ± SD. A nonparametric 1-way ANOVA test followed by a multiple comparison test was used.
P < .05 vs PRP + irrelevant IgG.
PN-1 inhibition enhances thrombin generation in PRP from patients with severe hemophilia A and patients with severe hemophilia B after collagen-induced platelet activation
Thrombin generation is known to be greatly increased when TGA is performed in PRP incubated with collagen.14 Indeed, under this condition, there is a strong induction of platelet activation, and therefore of platelet release. We thus performed TGA in PRP from patients with severe hemophilia in the presence of collagen to accentuate platelet PN-1 release. Interestingly, under this condition, blocking PN-1 can increase thrombin generation (Figure 3; Table 4). These results underline the regulatory role of PN-1 released after platelet activation on thrombin generation.
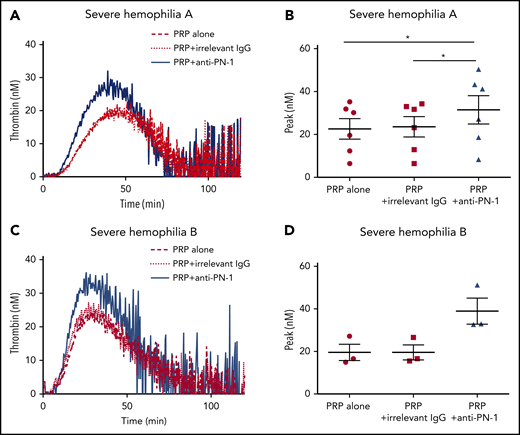
PN-1 inhibition enhances thrombin generation in PRP from patients with severe hemophilia A and patients with severe hemophilia B after collagen-induced platelet activation. Representative thrombin generation profiles from a patient with severe hemophilia A (A) and a patient with severe hemophilia B (C) after TF and collagen activation. Peaks were measured in PRP from patients with severe hemophilia A (B) and patients with severe hemophilia B (D), incubated with 100 µg/mL irrelevant IgG antibody or 100 µg/mL anti-PN-1 antibody. Each dot represents 1 patient. Values are means ± SEM. A non-parametric1-way ANOVA test followed by a multiple comparison test was used; *P < .05.
PN-1 inhibition enhances thrombin generation in PRP from patients with severe hemophilia A and patients with severe hemophilia B after collagen-induced platelet activation. Representative thrombin generation profiles from a patient with severe hemophilia A (A) and a patient with severe hemophilia B (C) after TF and collagen activation. Peaks were measured in PRP from patients with severe hemophilia A (B) and patients with severe hemophilia B (D), incubated with 100 µg/mL irrelevant IgG antibody or 100 µg/mL anti-PN-1 antibody. Each dot represents 1 patient. Values are means ± SEM. A non-parametric1-way ANOVA test followed by a multiple comparison test was used; *P < .05.
PN-1 deficiency or PN-1 blocking enhances thrombin generation in PRP from mice with F8 deficiency after collagen-induced platelet activation
To support our data obtained with PRP from patients with severe hemophilia A, TGA was also performed on PRP from WT, PN-1−/−, F8−/−, F8−/−/PN-1−/−, and F8−/− mice preincubated with the anti-PN-1 antibody. The mean values of TGA parameters are summarized in Table 5. As previously described, TF-triggered thrombin generation was accelerated and increased in the PRP from PN-1−/− compared with WT.11 As expected, thrombin generation was clearly abnormal in PRP from F8−/− mice, with decreases in thrombin peak height, velocity, and ETP compared with WT and PN-1−/− mice. Under our experimental conditions, no significant differences in the mean values of TGA parameters were observed between F8−/− and F8−/−/PN-1−/− mice (Figure 4A-B; Table 5) or between PRP from F8−/− preincubated with the anti-PN-1 antibody vs F8−/− preincubated with the irrelevant antibody (Figure 4E-F; Table 5).
Parameters of thrombin generation in murine PRP
| WT (n = 7)* | PN-1−/− (n = 6)* | F8−/− (n = 7)* | F8−/−/PN-1−/− (n = 6)* | F8−/− (n = 10) | |||
|---|---|---|---|---|---|---|---|
| PRP alone† | PRP + irrelevant IgG† | PRP + anti-PN-1† | |||||
| Lag time, min | 5.47 ± 1.82 | 5.12 ± 2.07 | 7.34 ± 2.84 | 6.26 ± 1.23 | 2.43 ± 1.06 | 5.63 ± 7.21 | 2.78 ± 1.18 |
| Peak, nM | 10.36 ± 4.47 | 19.53 ± 9.29 | 3.05 ± 2.44 | 3.30 ± 3.69 | 2.38 ± 1.71 | 2.17 ± 1.82 | 2.40 ± 1.97 |
| TTP, min | 12.80 ± 2.86 | 11.12 ± 3.02 | 11.96 ± 1.98 | 11.71 ± 2.02 | 7.05 ± 3.38 | 9.51 ± 7.45 | 7.12 ± 3.40 |
| ETP, nM.min | 179.5 ± 47.62 | 222.3 ± 120.4 | 31.11 ± 35.25 | 25.95 ± 10.45 | 29.55 ± 23.69 | 25.83 ± 23.19 | 27.10 ± 22.17 |
| Velocity, nM/min | 1.64 ± 0.79 | 3.35 ± 2.15 | 0.44 ± 0.26 | 0.58 ± 0.41 | 0.48 ± 0.37 | 0.42 ± 0.35 | 0.47 ± 0.28 |
Thrombin generation was triggered by TF. Means ± SD.
A Mann-Whitney test was used here.
A nonparametric 1-way ANOVA test followed by a multiple comparison test was used here.
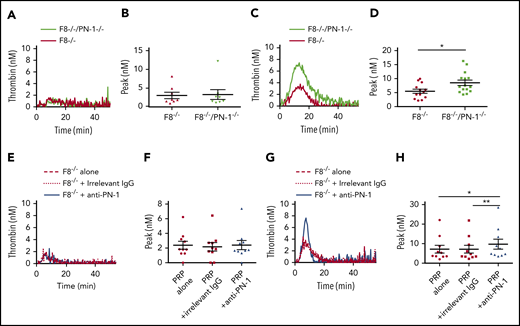
PN-1 deficiency enhances thrombin generation in PRP from mice with an F8 deficiency after collagen-induced platelet activation. Representative thrombin generation profiles and thrombin peaks obtained after TF activation (A-B,E-F), or after TF and collagen activation (C-D,G-H) in PRP from F8−/−, F8−/−/PN-1−/− and F8−/− mice in the presence of 100 µg/mL irrelevant IgG antibody or 100 µg/mL anti-PN-1 antibody. Each dot represents 1 mouse. Values are means ± SEM. A Mann-Whitney test was used for B and D; *P < .05. A non-parametric 1-way ANOVA test followed by a multiple comparison test was used for F and H; *P < .05, **P < .01.
PN-1 deficiency enhances thrombin generation in PRP from mice with an F8 deficiency after collagen-induced platelet activation. Representative thrombin generation profiles and thrombin peaks obtained after TF activation (A-B,E-F), or after TF and collagen activation (C-D,G-H) in PRP from F8−/−, F8−/−/PN-1−/− and F8−/− mice in the presence of 100 µg/mL irrelevant IgG antibody or 100 µg/mL anti-PN-1 antibody. Each dot represents 1 mouse. Values are means ± SEM. A Mann-Whitney test was used for B and D; *P < .05. A non-parametric 1-way ANOVA test followed by a multiple comparison test was used for F and H; *P < .05, **P < .01.
To confirm the role of PN-1 released after platelet activation on thrombin generation, we also performed TGA on PRP from F8−/−, F8−/−/PN-1−/−, and F8−/− mice preincubated with the anti-PN-1 antibody in the presence of collagen to accentuate platelet PN-1 release. Thrombin generation was significantly increased in PRP from F8−/−/PN-1−/− compared with PRP from F8−/−, in response to TF and collagen activation (Figure 4C-D; Table 6). Neutralizing PN-1 with the anti-PN-1 antibody in PRP from F8−/− mice also significantly increased thrombin generation in response to TF and collagen activation (Figure 4G-H; Table 6).
Parameters of thrombin generation in murine PRP after collagen-induced platelet activation
| WT (n = 22)* | PN-1−/− (n = 12)* | F8−/− (n = 13)* | F8−/−/PN-1−/− (n = 15)* | F8−/− (n = 10) | |||
|---|---|---|---|---|---|---|---|
| PRP alone† | PRP + irrelevant IgG† | PRP + anti-PN-1† | |||||
| Lag time, min | 4.92 ± 1.30 | 5.14 ± 0.83 | 3.57 ± 0.75 | 3.63 ± 0.88 | 3.36 ± 0.74 | 4.67 ± 3.57 | 3.67 ± 0.55 |
| Peak, nM | 27.06 ± 7.43 | 27.41 ± 9.81 | 5.50 ± 2.65 | 8.50 ± 3.74‡ | 7.18 ± 6.28 | 7.16 ± 6.29 | 9.73 ± 8.05¶ |
| TTP, min | 9.57 ± 1.73 | 10.39 ± 1.87 | 10.55 ± 1.53 | 10.81 ± 1.11 | 9.12 ± 1.74 | 9.93 ± 2.84 | 8.36 ± 0.94 |
| ETP, nM.min | 373.8 ± 134.4 | 361.8 ± 136.0 | 65.47 ± 28.04 | 114.3 ± 61.90‡ | 88.45 ± 74.25 | 79.43 ± 65.34 | 87.30 ± 66.90 |
| Velocity, nM/min | 5.89 ± 2.08 | 5.78 ± 3.17 | 0.99 ± 0.63 | 1.05 ± 0.61 | 1.37 ± 1.38 | 1.41 ± 1.37 | 2.3 ± 1.98¶ |
Thrombin generation was triggered by TF and collagen. Means ± SD.
A Mann-Whitney test was used here.
A nonparametric 1-way ANOVA test followed by a multiple comparison test was used here.
P < .05 vs F8−/− mice
P < .01 vs PRP + irrelevant IgG.
PN-1 deficiency limits tail bleeding in mice with F8 deficiency
To determine the in vivo efficacy of PN-1 deficiency for reducing bleeding in hemophilic mice, blood loss was measured in 3 different models: the classical tail clip assay and the tail vein and artery transection bleeding models. In the classical tail clip model, the bleeding phenotype of hemophilia was totally rescued in F8−/−/PN-1−/− mice (Figures 5A-B). Indeed, bleeding volumes and times were similar between F8−/−/PN-1−/− and WT mice, whereas F8−/− mice displayed, as expected, a prolonged bleeding time and an increased blood loss. The tail tip bleeding model is a common and easy test to evaluate hemostasis in mice. However, caution must be taken in drawing broad conclusions when using only 1 bleeding model. We thus performed the complementary tail vein transection bleeding model, a highly sensitive hemostasis model.12 In this model, blood loss and bleeding time were significantly reduced in F8−/−/PN-1−/− mice compared with F8−/− mice (Figures 5C-D). The results obtained with the tail artery transection model showed the same significant differences: reduced blood loss and bleeding time in F8−/−/PN-1−/− mice compared with F8−/− mice (Figures 5E-F). Taken together, these results demonstrate that PN-1 deficiency reduces blood loss and thus can provide protection against bleeding.
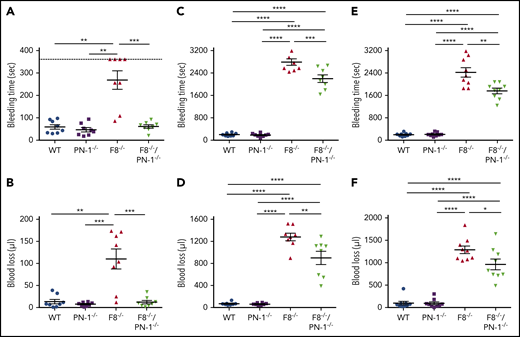
PN-1 deficiency limits tail bleeding in mice with an F8 deficiency. Tail bleeding times and volumes in WT, PN-1−/−, F8−/− and F8−/−/PN-1−/− mice in a classical tail clip model (A-B), in a tail vein transection model (C-D), and in a tail artery transection model (E-F). Each dot represents 1 mouse. A nonparametric 1-way ANOVA test followed by a multiple comparison test was used. *P < .05; **P < .01; ***P < .001.
PN-1 deficiency limits tail bleeding in mice with an F8 deficiency. Tail bleeding times and volumes in WT, PN-1−/−, F8−/− and F8−/−/PN-1−/− mice in a classical tail clip model (A-B), in a tail vein transection model (C-D), and in a tail artery transection model (E-F). Each dot represents 1 mouse. A nonparametric 1-way ANOVA test followed by a multiple comparison test was used. *P < .05; **P < .01; ***P < .001.
PN-1-deficiency does not lead to excessive thrombosis in mice with F8 deficiency in a mesenteric vessel ferric chloride-induced injury model
The effect of PN-1 deficiency on clotting was also assessed in vivo, using the ferric chloride mesenteric vessel injury. In this model, we monitored thrombus formation over time by visualizing platelets (red) and fibrin (green) depositions, using intravital microscopy. Representative images from recorded videos are presented in Figure 6A. Thirty minutes after mesenteric vessel injury, occlusive thrombi were observed both in venules and arterioles of WT mice (Figure 6A). As expected, in F8−/− mice, venules showed very few, if any, platelet-fibrin depositions during the entire period of recording, and none of the arterioles presented thrombi. In contrast, F8−/−/PN-1−/− mice showed small subocclusive thrombi in the mesenteric vessels. Fluorescence quantification over time showed that platelet accumulation and fibrin deposition on mesenteric arterioles were significantly increased in F8−/−/PN-1−/− mice compared with F8−/− mice without reaching fluorescence levels observed in WT mice (Figures 6B-C). Regarding mesenteric venules, platelet accumulation was also significantly increased in F8−/−/PN-1−/− mice compared with F8−/− mice, and fibrin accumulation tended to be increased; this tendency being significant only during the first 15 minutes after injury (Figures 6D-E). However, even if thrombus formation was promoted in F8−/−/PN-1−/− mice, injured vessels were never occluded.
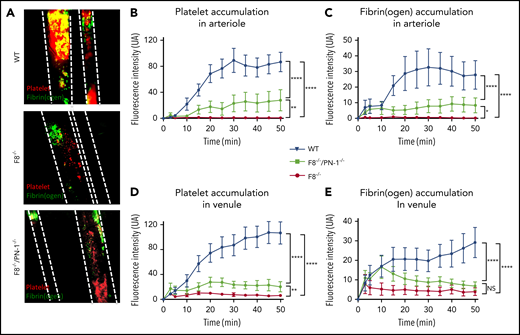
PN-1 deficiency effect in mice with an F8 deficiency during the mesenteric vessel ferric chloride-induced injury model. Quantitative analysis of platelet accumulation and fibrin generation after deposit of FeCl3 to mesenteric vessels. Mice were injected with Alexa 647-labeled antibodies against glycoprotein IX and with AF488-labeled fibrinogen to monitor platelet accumulation and fibrin generation respectively. Representative images obtained 30 min after the start of recording (A). Platelet (B,D) and fibrin accumulation (C,E) in arterioles (B-C) and in venules (D-E). The mean of fluorescence intensity ± SEM is shown (n = 10-12). A 2-way ANOVA test followed by a multiple comparison test was used. *P < .05; **P < .01; ***P < .001; ****P < .0001.
PN-1 deficiency effect in mice with an F8 deficiency during the mesenteric vessel ferric chloride-induced injury model. Quantitative analysis of platelet accumulation and fibrin generation after deposit of FeCl3 to mesenteric vessels. Mice were injected with Alexa 647-labeled antibodies against glycoprotein IX and with AF488-labeled fibrinogen to monitor platelet accumulation and fibrin generation respectively. Representative images obtained 30 min after the start of recording (A). Platelet (B,D) and fibrin accumulation (C,E) in arterioles (B-C) and in venules (D-E). The mean of fluorescence intensity ± SEM is shown (n = 10-12). A 2-way ANOVA test followed by a multiple comparison test was used. *P < .05; **P < .01; ***P < .001; ****P < .0001.
PN-1 deficiency in mice with F8 deficiency or PN-1 inhibition in patients with hemophilia A improves clot stability and limits clot lysis
Clot stability is an important hemostatic aspect in the treatment of hemophilia A. We investigated the effect of PN-1 deficiency in mice or the effect of PN-1 blocking in patients with hemophilia A on blood clot stability and lysis, using the rotational thromboelastometry (ROTEM)-based assay, with tissue plasminogen activator as the clot lysis trigger. Representative thromboelastogram profiles are shown in Figure 7A,D. Under our experimental conditions, ROTEM parameters were similar between WT and PN-1−/− mice (Table 7). As expected, clots from hemophilic mice displayed not only abnormal structure compared with WT, as illustrated by the very low MCF, but also excessive susceptibility to fibrinolysis, as illustrated by the shortening of the LOT (Table 7). Interestingly, both MCF and LOT were significantly increased in F8−/−/PN-1−/− mice compared with F8−/− mice (Figure 7B-C; Table 7). Similarly, clots from patients with hemophilia A displayed improved MCF and LOT in the presence of the neutralizing anti-PN-1 antibody compared with values obtained with the irrelevant antibody (Figure 7E-F; Table 8). These results demonstrate that in the context of hemophilia, PN-1 deficiency or neutralizing PN-1 does not induce excessive fibrinolysis.
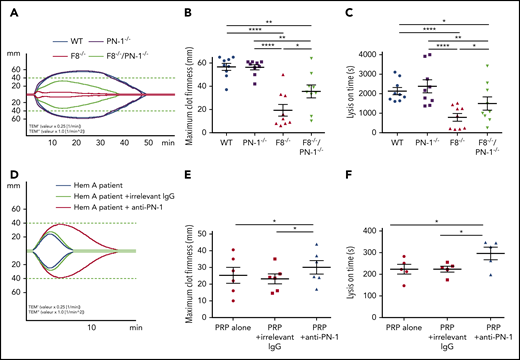
PN-1 deficiency in mice with F8 deficiency or PN-1 blocking in blood of hemophilia A patients improves clot stability and limits clot lysis. Representative whole blood thromboelastogram (ROTEM) profiles for hemophilic mice (A) or a patient with hemophilia (D). The maximum clot firmness corresponds to the maximum amplitude reached during the test (B,E), and the lysis on time corresponds to the time span from clotting time to the start of significant lysis (C,F). Each dot represents 1 mouse (B-C) or 1 patient (E-F). Values are means ± SEM. A 2-way ANOVA followed by a multiple comparison test was used. *P < .05; **P < .01; ****P < .0001.
PN-1 deficiency in mice with F8 deficiency or PN-1 blocking in blood of hemophilia A patients improves clot stability and limits clot lysis. Representative whole blood thromboelastogram (ROTEM) profiles for hemophilic mice (A) or a patient with hemophilia (D). The maximum clot firmness corresponds to the maximum amplitude reached during the test (B,E), and the lysis on time corresponds to the time span from clotting time to the start of significant lysis (C,F). Each dot represents 1 mouse (B-C) or 1 patient (E-F). Values are means ± SEM. A 2-way ANOVA followed by a multiple comparison test was used. *P < .05; **P < .01; ****P < .0001.
Parameters of thromboelastography in PRP from hemophilia mice
| WT (n = 9) | PN-1−/− (n = 9) | F8−/− (n = 9) | F8−/−/PN-1−/− (n = 9) | |
|---|---|---|---|---|
| Clotting time, s | 216.8 ± 33.21 | 225.7 ± 26.99 | 246.6 ± 39.84 | 241.2 ± 60.42 |
| MCF, mm | 56.56 ± 9.14 | 56.33 ± 6.44 | 19.33 ± 15.39 | 35.56 ± 16.61* |
| LOT, s | 2139 ± 555.0 | 2383 ± 1001 | 796.3 ± 583.3 | 1498 ± 1019* |
| Lysis time, s | 3079 ± 896.2 | 3609 ± 1557 | 2066 ± 479.1 | 2639 ± 1393 |
| Maximum clot elasticity | 137.6 ± 42.37 | 133.2 ± 30.32 | 28.89 ± 31.61 | 65.78 ± 51.10 |
Means ± SD. A 2-way ANOVA test, followed by a multiple comparison test, was used.
P < .05 vs F8−/− mice.
Parameters of thromboelastography in PRP from patients with hemophilia
| Patients with severe hemophilia (n = 5) | |||
|---|---|---|---|
| PRP alone | PRP + irrelevant IgG | PRP + anti-PN-1 | |
| Clotting time, s | 90.20 ± 12.81 | 90.80 ± 7.64 | 88.70 ± 7.13 |
| MCF, mm | 25.25 ± 11.52 | 23.17 ± 7.42 | 30.00 ± 9.93* |
| LOT, s | 222.80 ± 50.41 | 223.60 ± 30.62 | 295.70 ± 64.69* |
| Lysis time, s | 358.40 ± 91.40 | 387.20 ± 102.10 | 480.10 ± 134.10 |
| Maximum clot elasticity | 30.20 ± 16.39 | 26.90 ± 7.89 | 38.90 ± 15.52* |
Means ± SD. A nonparametric 1-way ANOVA test, followed by a multiple comparison test, was used.
P < .05 vs PRP + irrelevant IgG.
Discussion
Research in hemophilia management is currently undergoing major changes by developing novel strategies to rebalance the hemostatic system. Some new approaches consist of targeting negative clotting regulators such as AT, TFPI, APC, or PS. Neutralizing another anticoagulant serpin such as PN-1 is a concept that has not yet been proposed up to now for hemophilia treatment. This is probably because PN-1 is an underestimated negative regulator of thrombin generation. Yet, in vitro studies demonstrated that PN-1 inhibits thrombin at a rate approximately 100-fold faster than AT.7 Thus, by directly inhibiting thrombin activity, PN-1 is able to regulate the pleiotropic activities of thrombin involved in the coagulation cascade, such as the direct activations of FVIII, FV, FXI, and fibrin formation. The increased thrombin generation obtained in PRP from patients with hemophilia A incubated with a neutralizing anti-PN-1 antibody, and the in vivo improvement of the bleeding phenotype of F8−/−/PN-1−/− mice observed in the different tail-bleeding assays clearly demonstrate that targeting PN-1 can improve hemostasis in hemophilia.
Our data with the TGA showed that blocking PN-1 improved TF-initiated thrombin generation in PRP from patients with hemophilia displaying a minimum of 1% plasma FVIII. This result thus indicates that blocking PN-1 may be used in mildly or moderately affected patients with hemophilia A as an adjuvant therapy to reduce FVIII injections. When PN-1 was blocked, the total amount of thrombin generated was not increased; however, thrombin formation was clearly accelerated and facilitated. Thus, targeting PN-1 in the hemophilia context makes sense because the capacity for thrombin production in the initial stages of coagulation is essential for optimum hemostasis.
Importantly, neither blocking PN-1 in PPP from patients with hemophilia A nor PN1 deficiency in PPP from F8−/−/PN-1−/− mice had an effect on TF-initiated thrombin generation because PN-1 is not present in plasma, but is principally expressed in platelets. We have previously demonstrated the anticoagulant properties of platelet PN-1.11 In the context of hemophilia, such platelet properties are of particular interest. Indeed, platelets play a central role in the promotion and regulation of thrombin generation. In hemophilia, there is a failure of platelet-surface FX activation, leading to a decrease in platelet-surface thrombin generation and ineffective clot formation.15 Therefore, PN-1 appears as a platelet-dependent factor, playing a nonnegligible regulatory role in hemophilia via platelet-dependent thrombin generation. This was further confirmed by our data obtained when TGA was performed in PRP incubated with collagen, a strong agonist for platelet activation and release. We indeed observed that thrombin generation remained flat in PRP from F8−/−/PN-1−/− mice in the presence of TF alone, whereas it was improved in the presence of TF mixed with collagen. These data demonstrate that platelet PN-1 released from the α-granules has a direct effect on coagulation, and thus regulates thrombin generation on platelets.
Drugs targeting other natural anticoagulant proteins have been developed for the treatment of hemophilia. A therapeutic RNAi targeting AT has indeed been developed. AT is a highly concentrated plasma protein, and therefore, targeting AT via inhibitory molecules will require caution to avoid uncontrolled rebalancing of the hemostatic system in hemophilia. A serpin engineered to specifically inhibit APC was also found to rescue hemostasis in a hemophilia mouse model. Because APC provides also cytoprotection through its antiapoptotic and antiinflammatory effects, targeting APC should allow inhibition of its anticoagulant activity with preservation of its antiinflammatory and cytoprotective effects. Targeting TFPI is another therapeutic strategy developed for hemophilia. However, TFPI displays different splicing forms (TFPIα and TFPIβ) that act in different ways, and its bio-distribution is complex. Targeting PN-1 would have the advantage of reinforcing thrombin generation, specifically on platelet surfaces, and thus could represent a safer approach for the treatment of hemophilia. When targeting PN-1, we can act in a spatially restricted area that corresponds to the site of injury where activated platelets are present. Another important positive point concerning PN-1 targeting strategy is the absence of thrombotic risk demonstrated by our data in the in vivo model of thrombosis. Indeed, although PN-1 deficiency improved hemostasis in hemophilic mice, the kinetics and extent of thrombus formation remained lower than that measured in WT mice.
The abnormal composition of hemophilic clots makes them unstable and prone to premature lysis. This abnormal clot fragility is explained by altered activation of FXIII by thrombin, leading to impaired crosslinking of fibrin, and therefore to the formation of weaker clots.16 The high susceptibility of hemophilic clots to fibrinolysis is explained by a defective downregulation of fibrinolysis resulting from the lack of thrombin-activatable fibrinolysis inhibitor activation by thrombin.17 We thus assumed that PN-1 deficiency could favor thrombin effects on the hemophilic clot structure. Our data obtained by ROTEM confirmed this hypothesis, as clot strength and lysis onset time were significantly increased in F8−/−/PN-1−/− mice compared with F8−/− mice. This increased lysis time may appear surprising, as we have previously shown that PN-1 could also regulate fibrinolysis by inhibiting plasmin generation and activity. This apparently conflicting result is explained by the fact that the effect of PN-1 deficiency on clot stability in normal blood is not comparable to that in hemophilic blood. Indeed, in hemophilia, enhanced fibrinolysis results from defective clotting and abnormal fibrin. Thus, in this pathology, neutralizing PN-1 is able to correct such secondary hyperfibrinolysis. Because various in vitro studies previously showed that PN-1 inactivates thrombin at a rate at least 1000-fold faster than plasminergic proteases,5,18,19 we can assume that in the context of hemophilia, the antithrombin activity of PN-1 is dominant compared with its antifibrinolytic activity.
This study provides the proof of concept that targeting PN-1 is an original and novel approach for future clinical care in hemophilia. Interestingly, the platelet strategy has become an approach chosen by several groups who try to use platelets as a target to deliver therapeutics for hemophilia A treatment.20 Further studies would be justified to assess whether accentuating PN-1 targeting directly inside platelets could be a promising approach.
The online version of this article contains a data supplement.
The publication costs of this article were defrayed in part by page charge payment. Therefore, and solely to indicate this fact, this article is hereby marked “advertisement” in accordance with 18 USC section 1734.
Acknowledgments
The authors thank all the patients with hemophilia from the Centre de Traitement de l'Hémophilie Hôpital Mignot who have participated. We are also grateful to J. Miloradovic and E. Ferre for their excellent technical assistance and Mary Osborne-Pellegrin for editing this manuscript.
This work was supported by INSERM, Université de Paris, and grants from CSL Behring-SFH, the Agence Nationale de la Recherche (ANR-14-OHRI-0013), the Bayer Hemophilia Award Program and the National Blood Foundation. K.A. was the recipient of a fellowship from the Société Française d’Hématologie
Authorship
Contribution: K.A., C.K., and L.V. designed and performed the experiments and analyzed the data; E.d.R. recruited the patients, contributed to the experimental design, and proofread the manuscript; Y.B., O.D.C., P.J.L., V.A., and C.V.D. contributed to the experimental design and proofread the manuscript; M.-C.B. designed the study, supervised the research, and analyzed the data; and K.A., C.K., and M.-C.B. wrote the manuscript.
Conflict-of-interest disclosure: The authors declare no competing financial interests.
Correspondence: Marie-Christine Bouton, Unité INSERM U1148-Laboratory for Vascular Translational Science, CHU Xavier Bichat, 46 rue Henri Huchard, 75877 Paris Cedex 18, France; e-mail: marie-christine.bouton@inserm.fr.

This feature is available to Subscribers Only
Sign In or Create an Account Close Modal